Canopy Closure Assessment Checklist
Unlock optimal crop health & yields! Our comprehensive Canopy Closure Assessment checklist guides you to accurately measure leaf coverage, identify growth bottlenecks, and maximize resource utilization. Perfect for precision agriculture & informed decision-making. Download now & boost your farm's potential!
Diese Vorlage wurde 1 Mal installiert.
Site Information & Planning
Records essential details about the assessment location and preparation.
GPS Coordinates of Assessment Site
Assessment Date
Assessment Start Time
Crop Type
Field/Block Identifier
Field Area (hectares/acres)
Purpose of Assessment
Any Relevant Site History (e.g., recent weather events, previous crop)
Equipment & Personnel
Confirms availability of necessary tools, personnel, and their training.
Number of Assessors
Assessor Qualifications (e.g., Trained, Certified)
Brief description of assessor training/experience
GPS Device Status
Calibration Certificate (if applicable)
Drone Status (if used)
Drone Model and Firmware Version (if applicable)
Assessment Area Selection
Details how representative areas for canopy closure assessment were chosen.
Describe the criteria used to select assessment areas.
Number of assessment areas selected.
Selection method used for assessment areas (e.g., random, stratified, targeted).
GPS Coordinates of first assessment area.
Describe any specific factors considered when choosing locations (e.g., variability in planting density, field history).
Distance between assessment areas (in meters)
Were areas avoided due to obvious issues (e.g., pest damage, waterlogging)?
Attach a map or diagram of assessment area locations.
Observation Methods
Describes the methodology used for estimating canopy closure (e.g., visual assessment, digital imagery).
Primary Assessment Method Used:
Observer Distance from Canopy (meters)
Describe any challenges or limitations encountered during visual assessment.
If using digital imagery, what type of image was used?
If 'Other' image type selected above, please specify:
Factors Considered During Visual Estimation (Select all that apply)
If 'Other' selected above, please specify factors considered:
Data Collection
Details the specific measurements and observations taken within the assessment areas.
Number of Observation Points per Area
Observation Method Used
Distance from Ground Observer (if applicable)
Observer Height (if applicable)
Sky Visibility Score (if using visual assessment)
Canopy Height at Observation Point (m)
Notes/Observations Regarding Canopy Structure or Variability
Photo of Assessment Area (with scale if possible)
Data Analysis & Calculation
Outlines the process used to analyze collected data and calculate canopy closure percentages.
Number of Samples Analyzed
Description of Calculation Method Used
Average Canopy Closure (%)
Standard Deviation of Canopy Closure (%)
Unit of Measurement for Area (if applicable)
Justification for any adjustments or corrections made during calculation.
Spreadsheet or Data Table of Raw Measurements
Results & Interpretation
Presents the calculated canopy closure percentages and interprets their implications.
Average Canopy Closure (%)
Minimum Canopy Closure (%)
Maximum Canopy Closure (%)
Observed Variations in Canopy Closure
Overall Canopy Closure Status
Potential Causes for Observed Canopy Closure Levels
Implications for Crop Yield & Health
Agreement with Expected Levels?
Recommendations for Improvement
Documentation & Reporting
Covers the recording of observations, creation of maps, and overall report generation.
Summary of Assessment Findings
Report Creation Date
Report Creation Time
Overall Average Canopy Closure (%)
Supporting Photos (aerial, ground level)
Report Distribution Method (e.g., email, printed copy)
Report Recipient(s) Name(s)
Recommendations for Improvement (if applicable)
Assessor Signature
War diese Checklisten-Vorlage hilfreich?
Demonstration der Managementlösung für die Landwirtschaft
Der Betrieb eines Bauernhofs oder eines landwirtschaftlichen Unternehmens ist komplex. ChecklistGuro's Work OS Plattform vereinfacht Ihre Abläufe, von der Anbauplanung und Bewässerungsmanagement bis hin zur Tierverfolgung und Ernteplanung. Erhöhen Sie die Effizienz, reduzieren Sie Abfall und steigern Sie die Erträge! Sehen Sie, wie ChecklistGuro Ihr landwirtschaftliches Unternehmen revolutionieren kann.
Ähnliche Checklisten-Vorlagen
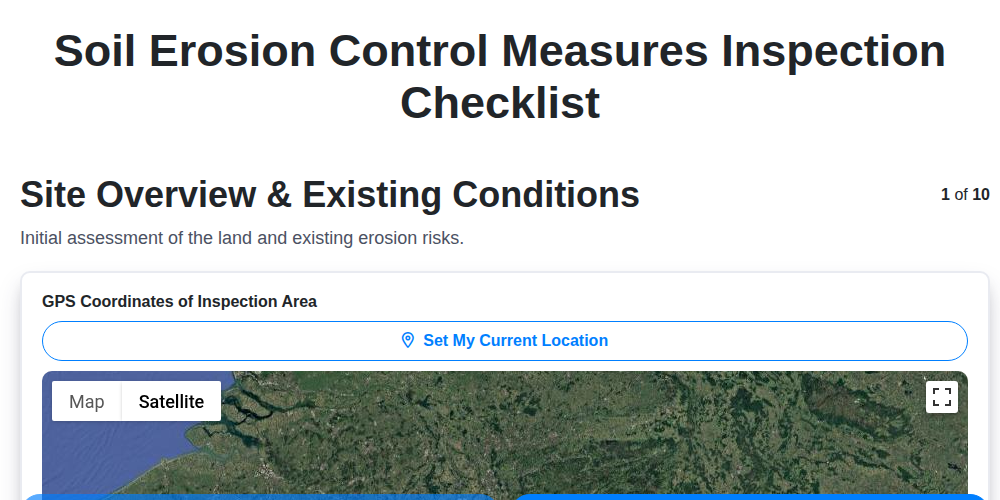
Soil Erosion Control Measures Inspection
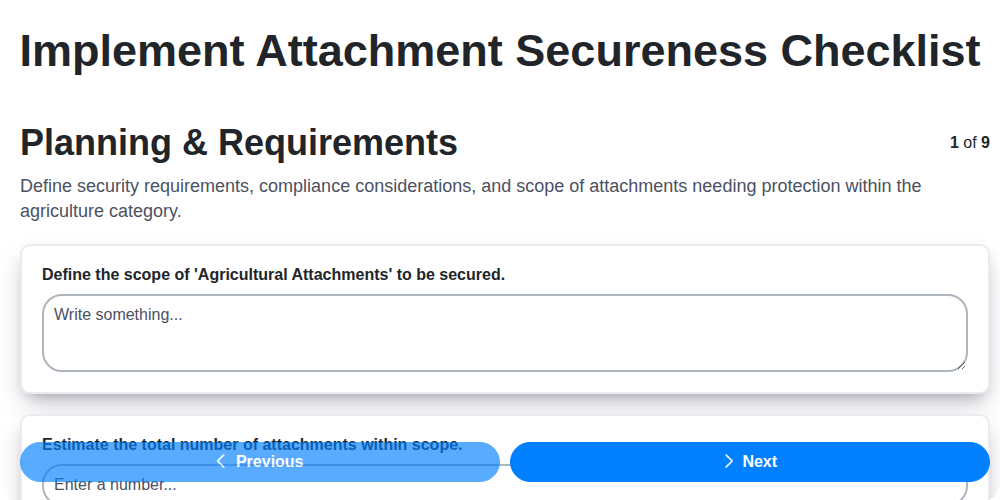
Implement Attachment Secureness
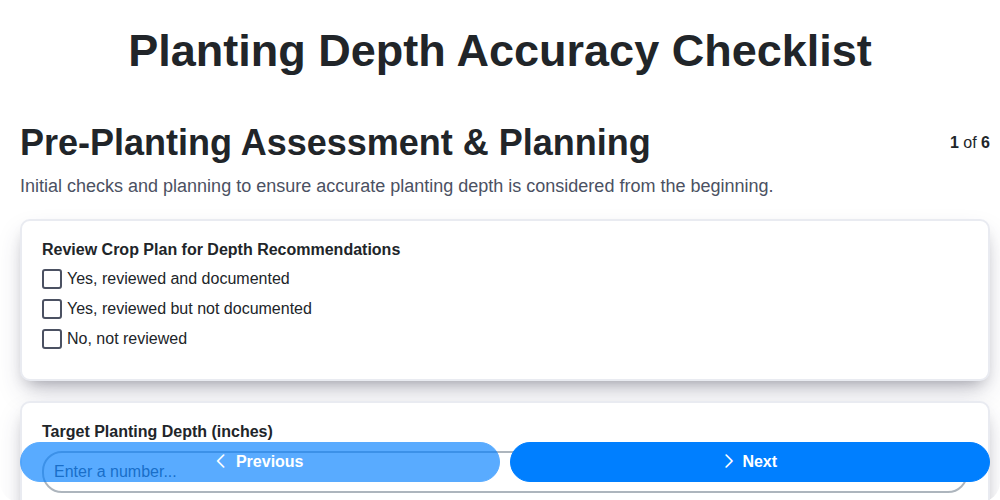
Planting Depth Accuracy
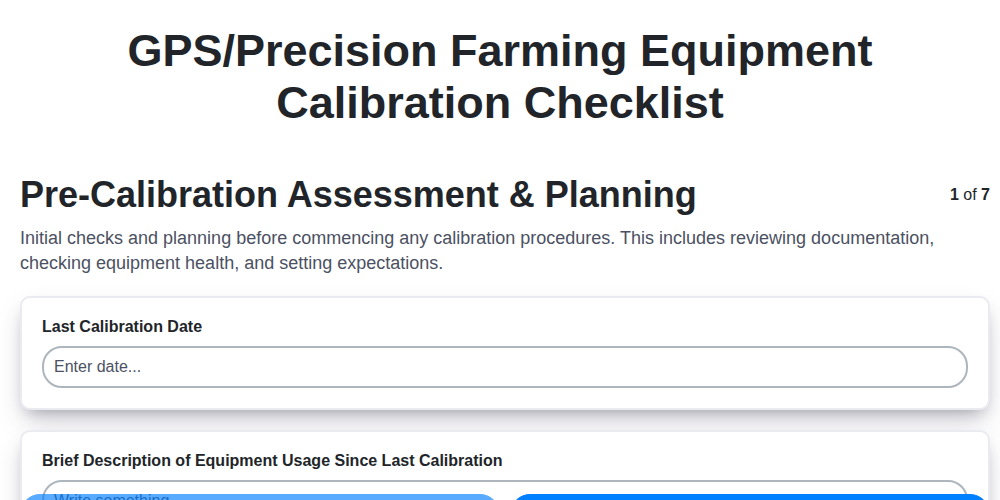
GPS/Precision Farming Equipment Calibration
Soil Moisture Monitoring (Location-Specific)
Weed Infestation Mapping
Bestandsaufnahme und Nachbestellung des Erste-Hilfe-Kits
Drainage System Efficiency Check
Gemeinsam schaffen wir das
Benötigen Sie Hilfe bei Checklisten?
Haben Sie eine Frage? Wir helfen Ihnen gerne. Bitte senden Sie uns Ihre Anfrage, und wir werden Ihnen umgehend antworten.