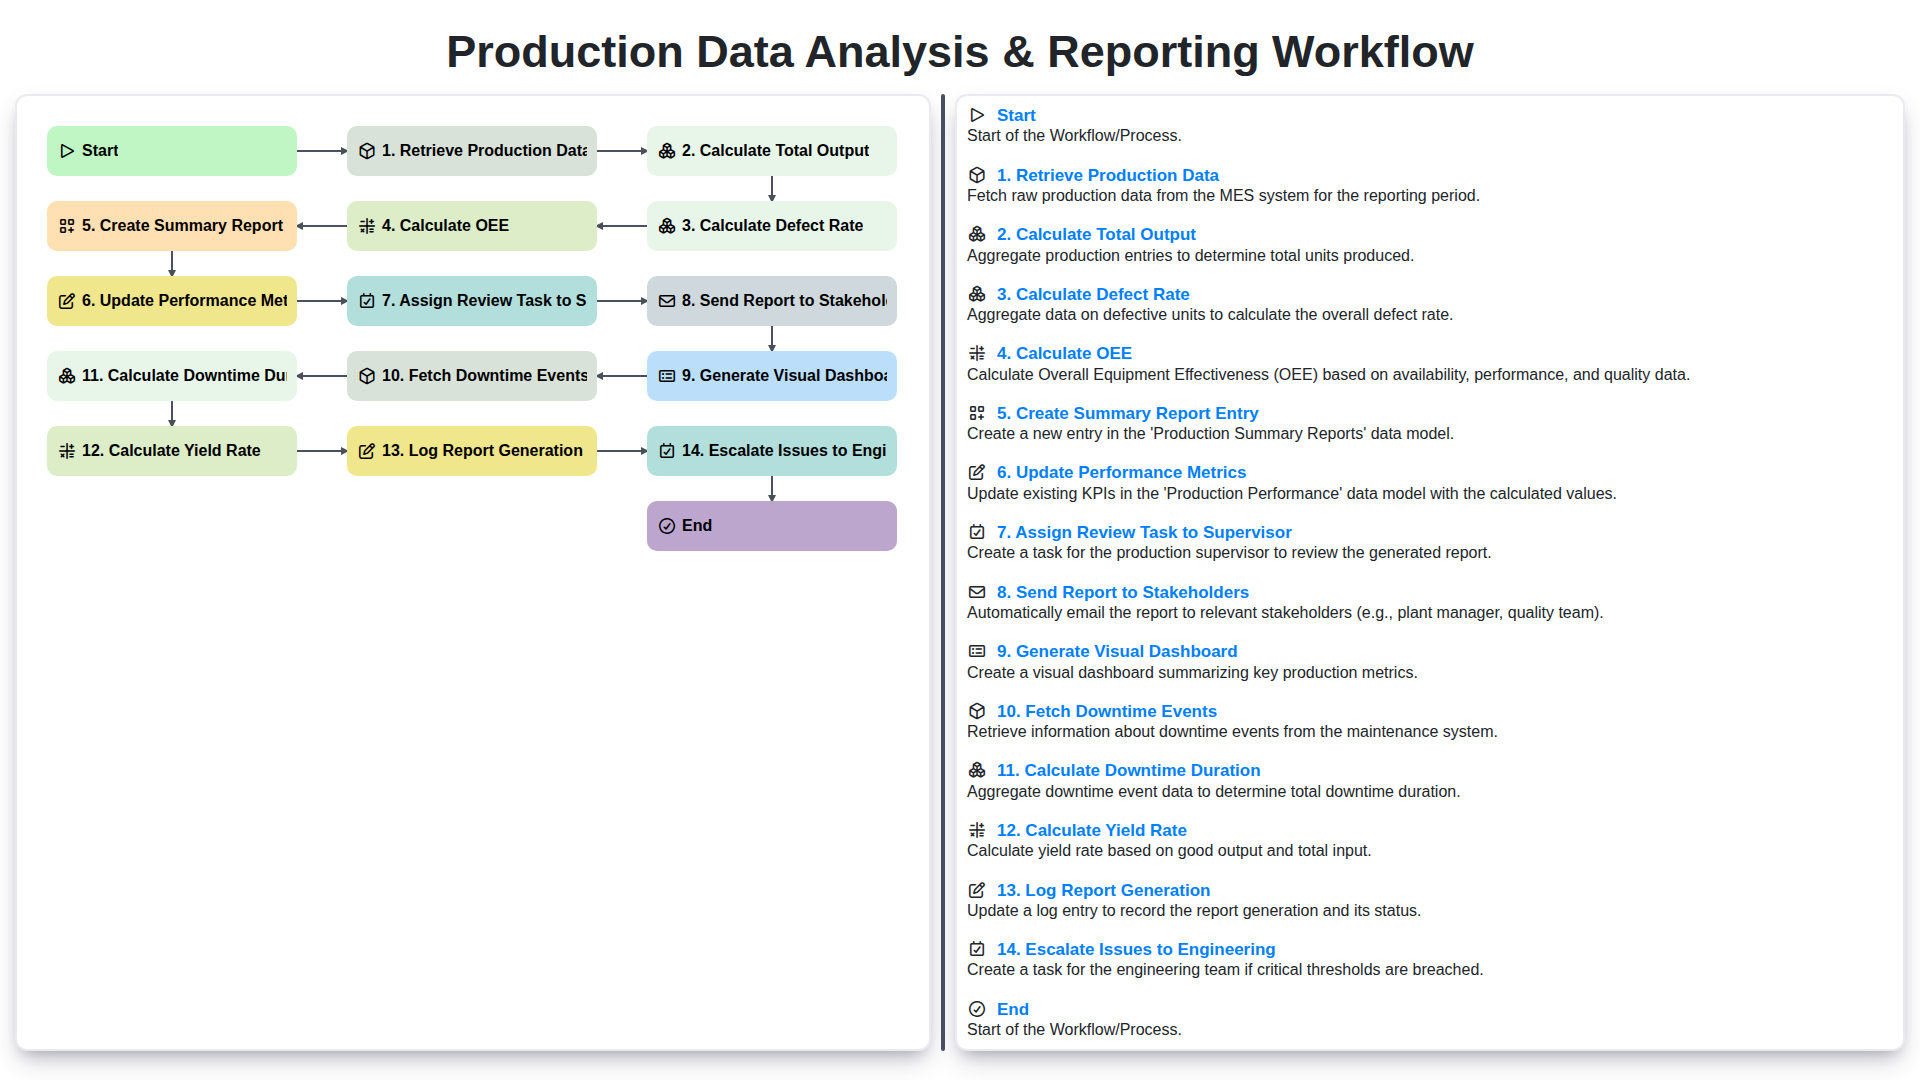
Production Data Analysis & Reporting Workflow
Veröffentlicht: 03/30/2026 Aktualisiert: 03/31/2026
Inhaltsverzeichnis
- Introduction: The Power of Data-Driven Production
- 1. Retrieving Production Data: Sources and Methods
- 2. Calculating Total Output: A Foundation for Analysis
- 3. Calculating Defect Rate: Identifying Areas for Improvement
- 4. Understanding Overall Equipment Effectiveness (OEE)
- 5. Calculating Downtime Duration: Pinpointing Lost Time
- 6. Determining Yield Rate: Measuring Production Efficiency
- 7. Creating a Summary Report Entry: Documenting Performance
- 8. Updating Performance Metrics: Tracking Progress Over Time
- 9. Assigning Review Tasks to Supervisors: Ensuring Accountability
- 10. Generating a Visual Dashboard: Real-Time Insights
- 11. Distributing Reports to Stakeholders: Transparency and Communication
- 12. Escalating Issues to Engineering: Proactive Problem Solving
- 13. Logging Report Generation: Audit Trail and Traceability
- Resources & Links
TLDR: This workflow automates your production analysis! It pulls data, calculates key metrics like OEE, defect rate, and yield, generates reports & dashboards, flags issues for engineering, and keeps supervisors and stakeholders informed - all in one streamlined process.
Introduction: The Power of Data-Driven Production
In today's competitive manufacturing landscape, gut feelings and guesswork simply aren't enough. Data-driven decision-making is no longer a luxury; it't a necessity. Understanding your production processes through meticulous data analysis allows for continuous improvement, optimized efficiency, and ultimately, increased profitability. This isn't just about collecting numbers - it's about transforming raw data into actionable insights. By consistently monitoring key performance indicators (KPIs) and proactively addressing bottlenecks, manufacturers can significantly reduce waste, improve product quality, and respond rapidly to changing market demands. This post will detail a comprehensive workflow designed to harness the power of your production data, transforming it from a vast, often overwhelming, set of figures into a clear roadmap for success.
1. Retrieving Production Data: Sources and Methods
The foundation of any robust production analysis and reporting workflow is accurate and readily accessible data. The methods for retrieving this data vary depending on your manufacturing environment and the systems in place. Here's a breakdown of common sources and retrieval approaches:
Common Data Sources:
- Machine Controllers/PLCs: These are often the primary source, providing real-time data on cycle times, counts, and status. Data can be accessed directly via APIs, Modbus, or other industrial protocols.
- MES (Manufacturing Execution System): MES platforms aggregate data from various sources, offering a centralized location for production information like work orders, materials used, and operator activity.
- ERP (Enterprise Resource Planning) Systems: ERPs provide higher-level data, including material planning, inventory, and order fulfillment details, which can be useful for contextualizing production performance.
- Quality Management Systems (QMS): These systems hold crucial data related to defects, reworks, and quality inspections.
- Manual Data Entry (as a last resort): While less desirable due to the potential for human error, manual entry may be necessary for older equipment or processes not integrated with digital systems.
Retrieval Methods:
- Direct API Integration: APIs (Application Programming Interfaces) allow for automated data extraction, often in real-time, offering the most efficient data retrieval.
- Database Queries (SQL): Many systems store data in relational databases. SQL queries allow for targeted data extraction based on specific criteria.
- File Exports (CSV, Excel): Some systems allow data to be exported in file formats like CSV or Excel. These files then need to be parsed and imported into a data processing system.
- OPC UA (OLE for Process Control Unified Architecture): OPC UA is a communication protocol often used in industrial automation, enabling data exchange between different systems.
- Screen Scraping (Discouraged): As a last resort, screen scraping can be used to extract data from user interfaces, but it's brittle and prone to errors when UI changes occur.
The choice of method should prioritize automation, accuracy, and minimal manual intervention. A well-designed data integration strategy is critical for the success of the entire production analysis and reporting workflow.
2. Calculating Total Output: A Foundation for Analysis
Calculating total output forms the bedrock of any meaningful production data analysis. It's the starting point, the absolute baseline against which all other metrics are measured. This isn't simply counting finished goods; it's a more nuanced calculation that needs to account for various factors.
First, we need to define what constitutes "output." Is it units completed? Weight produced? Volume processed? This definition must be consistent across all production lines and reporting periods. Then, we gather data from each station or process, tracking the number of units processed, partially completed items, and any materials rejected at the initial stages.
The calculation itself involves summing the output from each stage of the production process, adjusting for any scrapped or reworked items. For example, if a machine produces 100 units, but 5 are scrapped at the finishing stage, the total output would be 95.
Accurate total output calculation requires diligent data collection and consistent methodology. Errors at this stage propagate through all subsequent calculations, leading to misleading insights. Regular audits of the data collection process and validation of the total output figures are crucial for maintaining data integrity. Ultimately, a robust total output calculation provides a reliable foundation for understanding production performance and identifying areas for improvement.
3. Calculating Defect Rate: Identifying Areas for Improvement
Calculating defect rate is a crucial step in understanding production performance and identifying areas ripe for improvement. It moves beyond simply knowing how much you're producing and delves into the quality of that production.
The formula itself is straightforward: (Number of Defective Units / Total Number of Units Produced) x 100. However, the devil is in the details. Defining what constitutes a defect is paramount. This definition needs to be clear, consistent, and documented. A misaligned screw? A color variation? A functional failure? Each needs to be categorized and understood.
Furthermore, accurate data collection is vital. Manual inspection can be subjective and prone to error, so investing in automated quality checks, such as vision systems or in-process sensors, is a worthwhile consideration.
Analyzing defect rate trends over time is also key. A sudden spike necessitates immediate investigation. Dig deeper to understand why defects are occurring. Are there issues with raw materials? Is training needed for operators? Is maintenance lagging? The data provides the clues; it's our responsibility to interpret them and implement corrective actions. Reducing the defect rate directly translates to reduced waste, increased efficiency, and improved profitability.
4. Understanding Overall Equipment Effectiveness (OEE)
OEE (Overall Equipment Effectiveness) is a crucial metric for manufacturing, providing a holistic view of your production efficiency. It combines three key factors: Availability, Performance, and Quality. Think of it as a single number that tells you how effectively your equipment is being utilized.
- Availability measures the percentage of planned production time that your equipment is actually available to operate. It accounts for downtime due to breakdowns, setup, and adjustments. A lower availability score indicates frequent interruptions.
- Performance reflects the speed at which your equipment operates compared to its ideal speed. This accounts for slow cycles, minor stops, and reduced speed due to material issues.
- Quality represents the percentage of good parts produced relative to the total parts produced. It focuses on minimizing defects and rework.
OEE is calculated by multiplying these three factors together: OEE = Availability x Performance x Quality. A perfect OEE score is 100%, indicating flawless production. Understanding and improving your OEE is a key driver for operational excellence and increased profitability. The data collected throughout your production data analysis workflow directly feeds into these calculations, allowing for precise monitoring and targeted improvement initiatives.
5. Calculating Downtime Duration: Pinpointing Lost Time
Understanding downtime is critical for optimizing production. Simply knowing downtime occurred isn't enough; we need to quantify it. This step involves meticulously calculating the total duration of downtime events.
Here's how we do it:
- Data Source: We leverage the Fetch Downtime Events step's output, which contains details about each downtime occurrence: start time, end time, and reason.
- Calculation: For each downtime event, we calculate the duration by subtracting the start time from the end time. This result is typically expressed in minutes or hours for easier interpretation.
- Aggregation: We sum up the durations of all downtime events within the reporting period (e.g., a shift, a day, a week). This provides a total downtime duration.
- Categorization (Optional but Recommended): We often further break down downtime duration by reason. This allows us to identify the most frequent causes of downtime (e.g., mechanical failure, material shortage, changeover). Knowing why downtime happens is the first step to preventing it.
- Impact on OEE: Downtime directly impacts Overall Equipment Effectiveness (OEE). Accurately calculating downtime duration ensures that OEE calculations are precise, reflecting the true picture of production performance. A significant downtime duration will directly lower the OEE score.
6. Determining Yield Rate: Measuring Production Efficiency
Calculating yield rate is a crucial step in understanding production efficiency. It directly reflects the percentage of good, usable products produced compared to the total number started. A low yield rate indicates potential problems in your process that need immediate attention.
Here's how we determine yield rate within our workflow:
Formula:
Yield Rate = (Number of Good Units / Total Number of Units Started) * 100
Process Integration:
After calculating total output, we meticulously track the number of units that don't meet quality standards - those classified as defective or scrap. This data is then factored into the yield rate calculation. This isn't just about counting; it requires accurate identification and classification of defective products, often leveraging quality control checks integrated throughout the production line.
Impact on Decision-Making:
A declining yield rate acts as an early warning signal. It prompts a deeper investigation into potential root causes, such as equipment malfunction, raw material inconsistencies, or operator error. Analyzing yield rate trends over time allows for proactive adjustments to processes and preventative maintenance schedules. It's a key performance indicator that directly ties production output to profitability.
7. Creating a Summary Report Entry: Documenting Performance
The heart of any effective workflow lies in clearly documenting findings. After the calculations and analyses are complete, creating a concise and informative summary report entry is crucial. This isn't just about dumping numbers; it's about providing context and highlighting key takeaways.
Here's what a robust summary report entry should include:
- Date and Time of Analysis: Precise timestamps are essential for tracking trends and pinpointing the period the report covers.
- Overall Performance Summary: A brief paragraph highlighting the overall health of production. Was it a good day? Were there any significant deviations from the expected performance?
- Key Metrics: Clearly state the calculated values for Total Output, Defect Rate, OEE, Yield Rate, and Downtime Duration. Use the previously determined benchmarks or targets to indicate performance relative to expectations.
- Significant Events: Note any unusual occurrences that impacted production, such as equipment malfunctions, material shortages, or process changes. Briefly describe the event and its estimated impact.
- Root Cause (Preliminary): Based on the data, include any initial observations regarding potential root causes for performance issues. This is a preliminary assessment; further investigation might be required.
- Recommendations (Initial): If problems are detected, suggest initial corrective actions.
- Report Generated By: Record the individual responsible for generating the report.
This detailed summary entry becomes a vital record, allowing for consistent tracking, retrospective analysis, and informed decision-making across the team.
8. Updating Performance Metrics: Tracking Progress Over Time
The data flowing through our production analysis workflow isn't just about a snapshot in time; it's about understanding trends and driving continuous improvement. This is where updating performance metrics becomes critical. Once we've calculated key indicators like Total Output, Defect Rate, OEE, and Yield Rate, these values aren't just stored - they're integrated into a historical database.
This database serves as the foundation for tracking progress. Each data point becomes a marker along a timeline, allowing us to compare performance across shifts, days, weeks, and months. We're looking for patterns - are defect rates consistently higher on certain days? Is OEE declining during specific shifts? Are downtime events increasing?
Beyond simple trendlines, we also implement rolling averages and control charts. Rolling averages smooth out daily fluctuations, revealing underlying trends more clearly. Control charts establish baselines and identify points that fall outside acceptable ranges, signaling potential problems that require investigation.
The beauty of this approach lies in its proactive nature. By consistently tracking and visualizing these performance metrics, we can quickly identify deviations from expected behavior and take corrective actions before they significantly impact overall production goals. This closed-loop system ensures that our production process is constantly monitored, evaluated, and optimized.
9. Assigning Review Tasks to Supervisors: Ensuring Accountability
Once the summary report entry is created and performance metrics updated, the next crucial step is assigning a review task to the relevant supervisor. This isn't just about passing the report along; it's about establishing accountability and ensuring someone takes ownership of the data and any actions required.
The review task should include a clear deadline and a list of specific areas the supervisor needs to scrutinize. This might include validating the accuracy of the calculated metrics, identifying any unexpected trends or anomalies, and proposing potential corrective actions. A dedicated task management system or integrated workflow platform makes this assignment and tracking seamless. The supervisor's feedback and any resulting actions are then documented within the same reporting system, creating a traceable audit trail. This ensures that data isn't just generated, but actively analyzed and acted upon.
10. Generating a Visual Dashboard: Real-Time Insights
Static reports are valuable, but they only paint a snapshot in time. To truly understand production performance and proactively address potential issues, a dynamic visual dashboard is essential. This dashboard pulls data directly from the previously generated report and transforms it into easily digestible charts, graphs, and key performance indicators (KPIs).
Think beyond simple line graphs. Your dashboard should feature:
- Real-time OEE tracking: A prominent display showing current Overall Equipment Effectiveness, updated frequently.
- Defect Rate Trend: A graph illustrating defect rate fluctuations over time, helping identify patterns and root causes.
- Output vs. Target: A clear comparison of actual production output against planned targets.
- Downtime Event Summary: A visual representation of downtime events, categorized by cause and duration.
- Yield Rate Visualization: A gauge or chart displaying the current yield rate, showing progress towards goals.
- Interactive Filtering: Allow users to filter data by shift, machine, product type, or date range for more granular analysis.
The visual dashboard empowers stakeholders to quickly identify trends, anomalies, and areas for improvement, leading to faster decision-making and increased operational efficiency. It transforms raw data into actionable intelligence.
11. Distributing Reports to Stakeholders: Transparency and Communication
Sharing production data insights with stakeholders isn't just about generating a report; it's about fostering transparency and enabling informed decision-making. This step in the workflow focuses on disseminating the compiled data and analysis to the relevant individuals and teams.
The method of distribution should be tailored to the audience. While email remains a common approach, consider other options like shared online portals, collaboration platforms (e.g., Microsoft Teams, Slack), or even scheduled presentations. The key is to ensure stakeholders receive the information in a format that's accessible and digestible.
Clearly define who receives the report - this often includes management, sales, operations, and potentially even key customers. Include a concise executive summary highlighting key performance indicators (KPIs) and any significant deviations from targets. Encourage feedback and open communication to ensure the report's value is maximized and any concerns are addressed proactively. Don't just send; engage.
12. Escalating Issues to Engineering: Proactive Problem Solving
When the data analysis and reporting workflow identifies concerning trends or significant deviations from expected performance, escalating these issues to the Engineering team is crucial for proactive problem-solving. This isn't about assigning blame; it's about leveraging the Engineering team's expertise to diagnose root causes and implement corrective actions.
The escalation process should be clearly defined and linked to the pre-determined thresholds established within the workflow. For instance, a sustained OEE drop below a certain level, a consistently high defect rate, or a recurring downtime event would automatically trigger an escalation.
The escalation should include:
- Specific Data Points: Provide the exact data that triggered the escalation, including timestamps, production run details, and relevant metrics (OEE, defect rate, downtime duration, yield rate).
- Trend Analysis: Highlight any historical trends that support the concern. Is this a new issue, or has it been recurring?
- Potential Causes (if known): If the Production team has preliminary hypotheses about the root cause, include them. This isn't mandatory, but can expedite the Engineering team's investigation.
- Impact Assessment: Briefly describe the impact of the issue on production efficiency, quality, and potentially, cost.
The goal is to provide Engineering with the information they need to quickly understand the problem and begin investigating. A clear escalation path ensures that issues are addressed promptly, preventing further production losses and contributing to continuous improvement.
13. Logging Report Generation: Audit Trail and Traceability
A crucial, and often overlooked, element of any robust production analysis workflow is meticulous logging of report generation. This isn't simply about knowing when a report was created; it's about having a complete audit trail detailing the entire process.
Each report generation instance should be logged with key information, including:
- Timestamp: When the report was initiated and completed.
- User: Who triggered the report generation (identifies responsibility).
- Data Source: Which database or system the data was pulled from.
- Parameters Used: Specific filters, time periods, or other criteria applied during data retrieval.
- Report Version: A version number allows you to track changes to the report's structure, calculations, or visualizations over time.
- Any Errors Encountered: Record any errors during data retrieval, calculation, or report creation. This aids in troubleshooting and ensures data integrity.
This logging provides a readily available audit trail. It enables you to:
- Reproduce Reports: If an issue arises with a historical report, you can recreate it using the logged parameters.
- Trace Data Lineage: Understand exactly where the data originated and how it was processed.
- Identify Process Inconsistencies: Detect deviations from standard procedures.
- Support Compliance Requirements: Many industries require documented processes and data integrity.
Implementing a robust logging system isn't just about creating a record; it's about ensuring transparency, accountability, and the reliability of your production data analysis and reporting.
Resources & Links
- OEE.com : A comprehensive resource for Overall Equipment Effectiveness (OEE) including definitions, calculation methods, industry best practices, and software solutions. Helps understand and improve production efficiency.
- Statista : A statistics portal providing data on a wide range of industries including manufacturing and production. Useful for benchmarking and understanding industry trends.
- The Manufacturing Map : A global manufacturing directory and resource. Useful for understanding different manufacturing processes and potential data sources.
- National Institute of Standards and Technology (NIST) : NIST provides data, standards, and tools related to manufacturing and quality. Can be helpful for understanding measurement accuracy and process control.
- Tableau : A leading data visualization and business intelligence platform. Useful for creating the visual dashboards mentioned in the workflow.
- Microsoft Power BI : Another popular business intelligence and data visualization tool suitable for generating dashboards and reports.
- Smartsheet : A work management platform that can be used for documenting workflows, assigning tasks, and tracking performance metrics - directly applicable to steps like assigning review tasks and updating performance metrics.
- Quality Magazine : A publication focusing on quality control and improvement in manufacturing. Provides insights into defect rate analysis and process optimization.
- ISO (International Organization for Standardization) : Provides international standards for quality management systems (e.g., ISO 9001). Can be useful for understanding quality best practices and audit trails (related to logging report generation).
- Lean Enterprise Institute : A resource focused on Lean Manufacturing principles. Can provide context for understanding yield rate and overall production efficiency.
Häufig gestellte Fragen
What is the primary goal of a Production Data Analysis & Reporting Workflow?
The primary goal is to transform raw manufacturing data into actionable insights that improve operational efficiency, reduce downtime, and ensure consistent product quality.
What are the key stages involved in this workflow?
The workflow typically involves data collection from machines and sensors, data cleaning and normalization, data analysis (identifying trends and anomalies), and finally, the generation of automated reports for stakeholders.
Why is data cleaning critical in production analysis?
Data cleaning is critical because raw production data often contains noise, errors, or missing values caused by sensor malfunctions or network latency. Without cleaning, analysis could lead to incorrect conclusions and poor decision-making.
What types of metrics are commonly reported in production workflows?
Common metrics include Overall Equipment Effectiveness (OEE), downtime duration, scrap rates, cycle times, and production throughput.
How can automated reporting benefit manufacturing plants?
Automated reporting reduces human error, ensures real-time visibility into production status, and allows managers to focus on addressing issues rather than manually compiling spreadsheets.
War dieser Artikel hilfreich?
Demo der Fertigungsmanagementlösung
Hören Sie auf, sich mit Papierkram herumzuschlagen und mit inkompatiblen Systemen zu kämpfen! Unsere Lösung bringt Klarheit und Kontrolle in Ihren Produktionsprozess. Von Standardarbeitsanweisungen (SOPs) und Geräteinstandhaltung bis hin zur Qualitätskontrolle und Bestandsverfolgung vereinfachen wir jeden Schritt.
Verwandte Artikel
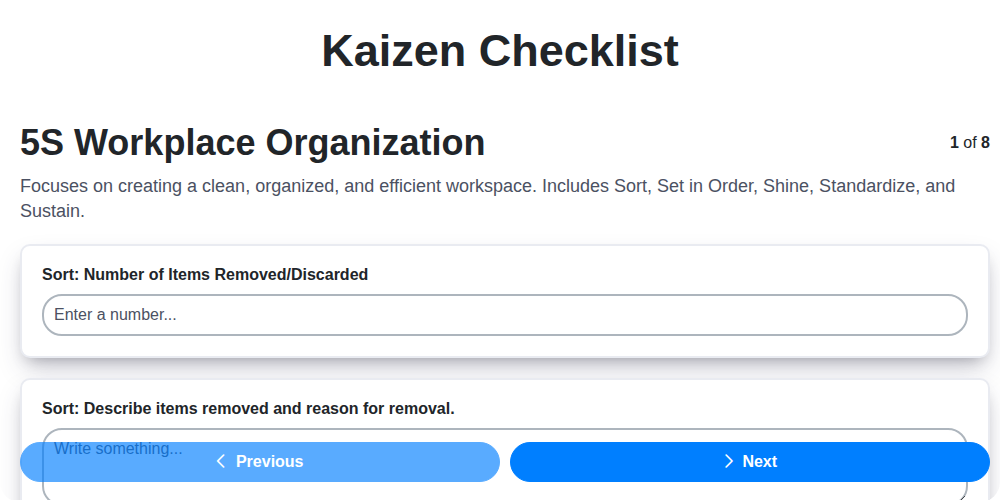
Kaizen-Checklisten-Vorlage: Ihr Weg zur kontinuierlichen Verbesserung

Machine Safety Audit Checklist: Your Guide to a Safer Manufacturing Workplace
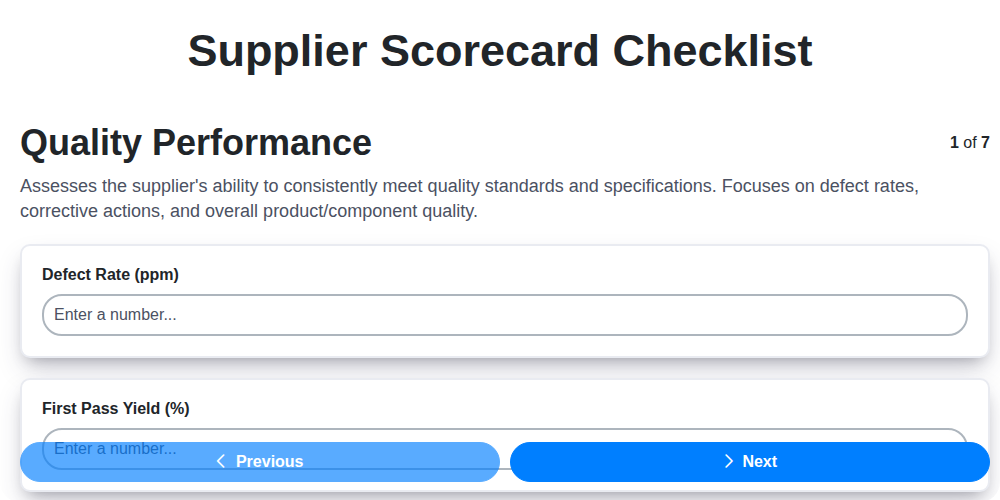
Mastering Supplier Performance: Your Free Supplier Scorecard Checklist Template
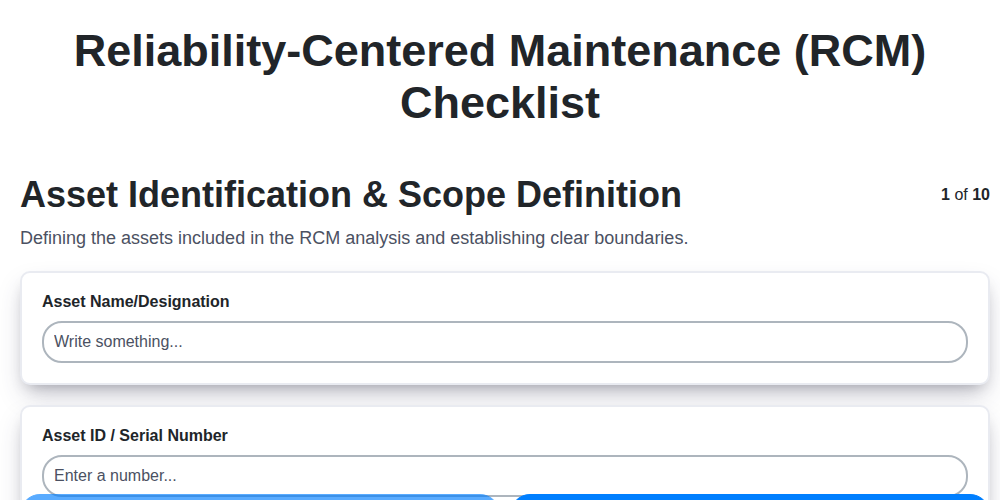
Ihr ultimatives RCM-Checklisten-Template: Ein Schritt-für-Schritt-Leitfaden

LPA-Checklisten-Vorlage: Ihr Leitfaden für mehrschichtige Prozessprüfungen

Ihre ultimative Checklisten-Vorlage für Abschaltung und Kennzeichnung (LOTO)

Your Ultimate FSC 22000 Checklist Template
Qualitätskontroll-Prüflisten-Vorlage: Fehler vermeiden & Fertigungsprozesse verbessern
Gemeinsam schaffen wir das
Benötigen Sie Hilfe bei Checklisten?
Haben Sie eine Frage? Wir helfen Ihnen gerne. Bitte senden Sie uns Ihre Anfrage, und wir werden Ihnen umgehend antworten.