Precision Agriculture Checklist: Data Analysis & Yield Optimization Plan
Maximize your farm's potential! This Precision Agriculture Checklist guides you through data analysis, ensuring accurate insights & a tailored yield optimization plan for healthier crops & increased profitability. Perfect for modern farmers embracing data-driven techniques.
Diese Vorlage wurde 5 Mal installiert.
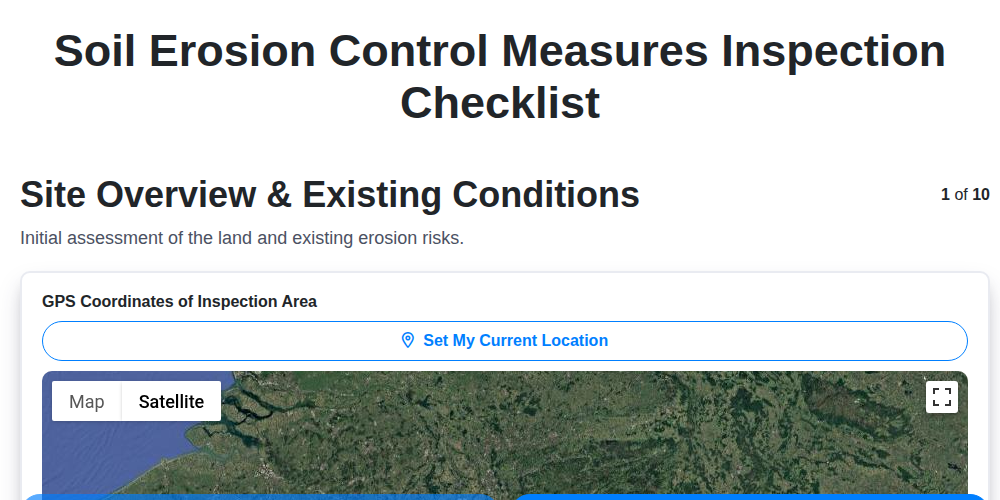
Data Acquisition & Sensor Calibration
Verify proper functionality and calibration of all data-gathering sensors (soil moisture, weather stations, yield monitors).
Soil Moisture Sensor Reading (Avg.)
Weather Station Temperature (°C)
Yield Monitor Calibration Factor
Last Sensor Calibration Date
Sensor Power Source (Battery/Solar)
GPS Accuracy (m)
Sensor Calibration Certificates (if applicable)
Data Upload & Storage
Confirm seamless data transfer from field devices to cloud platform and ensure secure data storage.
Last Data Upload Date
Last Data Upload Time
File Size (MB)
Data Source
Storage Location
Raw Data File (optional)
Number of Records Uploaded
Data Cleaning & Processing
Validate data integrity by identifying and addressing outliers, missing values, and inconsistencies.
Identify and record number of missing data points per field.
Record number of outlier values detected in soil moisture data.
Select method used for outlier handling (e.g., removal, replacement, capping).
Describe any data imputation techniques applied and justify their use.
Select units for all data fields to ensure consistency.
Date of Data Cleaning Completion
Spatial Data Analysis (Yield Maps & Zoning)
Analyze yield data to identify high and low-performing zones for targeted interventions.
Yield Map File (e.g., shapefile, raster)
Yield Map Resolution (pixels/hectare)
Yield Units (Select one)
Threshold for Low-Yield Zone (e.g., % below average)
Threshold for High-Yield Zone (e.g., % above average)
Notes on observed spatial patterns in yield data
Zoning Method Used (Select one)
Variable Rate Application Planning
Develop variable rate application maps for fertilizer, pesticides, and irrigation based on data insights.
Target Yield (bushels/acre)
Fertilizer Type (Nitrogen)
Application Rate (lbs/acre) - Zone 1
Application Rate (lbs/acre) - Zone 2
Application Rate (lbs/acre) - Zone 3
Application Timing (Select all that apply)
Planned Application Date
Notes/Justification for Variable Rate
Upload VR Application Map (Shapefile/GeoTIFF)
Equipment Calibration for Variable Rate Technology
Ensure accurate application rates through regular equipment calibration and nozzle checks.
Nozzle Flow Rate (L/min)
Application Rate (L/ha)
Ground Speed (km/h)
Distance Between Nozzles (cm)
Calibration Method Used
Calibration Date
Calibration Time
Calibration Log/Photos
Precision Irrigation Scheduling
Optimize irrigation timing and water application based on soil moisture data and crop water requirements.
Current Soil Moisture (inches)
Target Soil Moisture (inches)
Irrigation Run Time (minutes)
Application Rate (inches/hour)
Date of Last Irrigation
Scheduled Irrigation Start Time
Irrigation Zone
Irrigation Method
Nutrient Management Recommendations
Generate customized fertilizer recommendations based on soil tests and yield data to maximize nutrient use efficiency.
Target Yield (Bushels/Acre)
Soil Test Date
Nitrogen Recommendation (lbs/acre)
Phosphorus Recommendation (lbs/acre)
Potassium Recommendation (lbs/acre)
Micronutrient Deficiencies Detected?
Notes/Justification for Recommendations
Pest & Disease Scouting & Monitoring
Implement pest and disease monitoring protocols and utilize data for targeted scouting and preventative measures.
Scouting Date
Observed Pests
Observed Diseases
Average Pest Count per Plant (if applicable)
Detailed Scouting Notes
Severity Level
Scouting Location (GPS Coordinates)
Photo Evidence (Optional)
Performance Evaluation & Reporting
Track the effectiveness of precision agriculture strategies through yield monitoring and data analysis for continuous improvement.
Overall Yield Improvement (%)
Fertilizer Use Efficiency (%)
Water Use Efficiency (%)
Pesticide Application Rate Reduction (%)
Summary of Key Performance Findings
Date of Performance Evaluation
Overall Strategy Success (Subjective)
Yield Map Comparison (Previous vs. Current)
War diese Checklisten-Vorlage hilfreich?
Demonstration der Managementlösung für die Landwirtschaft
Der Betrieb eines Bauernhofs oder eines landwirtschaftlichen Unternehmens ist komplex. ChecklistGuro's Work OS Plattform vereinfacht Ihre Abläufe, von der Anbauplanung und Bewässerungsmanagement bis hin zur Tierverfolgung und Ernteplanung. Erhöhen Sie die Effizienz, reduzieren Sie Abfall und steigern Sie die Erträge! Sehen Sie, wie ChecklistGuro Ihr landwirtschaftliches Unternehmen revolutionieren kann.
Ähnliche Checklisten-Vorlagen
Gemeinsam schaffen wir das
Benötigen Sie Hilfe bei Checklisten?
Haben Sie eine Frage? Wir helfen Ihnen gerne. Bitte senden Sie uns Ihre Anfrage, und wir werden Ihnen umgehend antworten.