Streamlining Success: Your Ultimate Crop Health Monitoring Workflow for Disease & Pest Detection
Opublikowano: Zaktualizowano: 04/16/2026
Spis treści
- Understanding the Need for Proactive Crop Health Monitoring
- Phase 1: Gathering Comprehensive Data Inputs
- Integrating Field Scouting Reports: The Human Element
- Leveraging Crop Growth Stage Data for Context
- Harnessing Weather Forecast Data for Predictive Insights
- Logging and Categorizing Observed Pests and Diseases
- The Core Engine: Calculating the Crop Risk Score
- Determining Optimal Intervention Timing and Strategy
- Generating Actionable Plan Entries and Recommendations
- Assigning Follow-up Tasks and Workflow Management
- Communication Backbone: Alerting Stakeholders on Critical Findings
- Ensuring Accountability: Notifying Responsible Personnel
- Keeping Track: Updating Real-Time Field Status
- Culminating Insights: The Weekly Crop Health Report
- Resources & Links
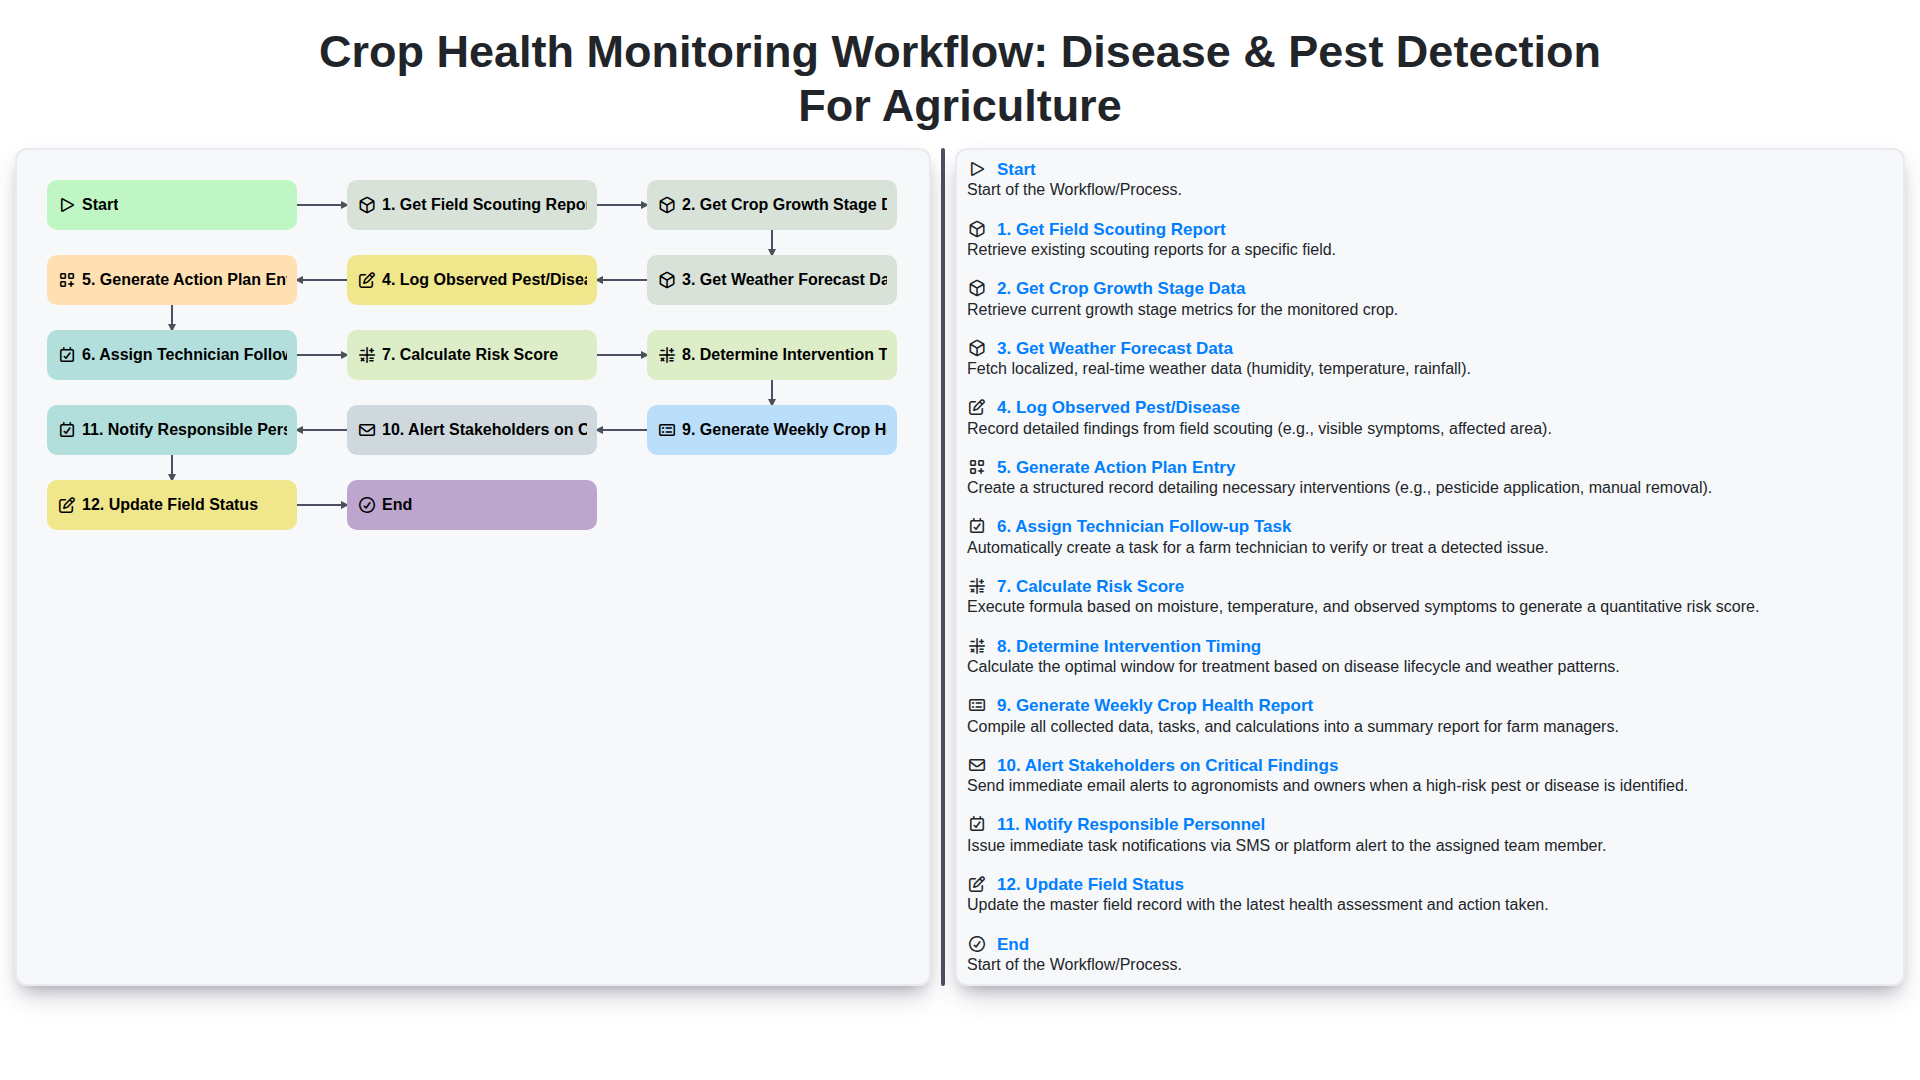
TLDR: This guide outlines a complete, step-by-step workflow to proactively manage crop health. By integrating field scouting reports, growth stage data, and weather forecasts, you can accurately log and analyze pest/disease observations, calculate a risk score, and determine the precise timing for interventions. The system automates action plan generation, assigns follow-up tasks, compiles comprehensive weekly reports, and instantly alerts relevant personnel, ensuring timely and efficient decision-making across your entire farm operation.
Understanding the Need for Proactive Crop Health Monitoring
Modern agriculture faces an ever-increasing barrage of threats from unpredictable weather patterns, emerging pests, and virulent diseases. Relying on reactive monitoring-waiting until symptoms are visible and losses are already occurring-is no longer a sustainable or profitable strategy. True farm resilience demands a shift towards proactive, predictive care. A systematic workflow isn't just a collection of steps; it's the critical bridge between data points and actionable intervention. By integrating real-time scouting reports, current crop development stages, and forward-looking weather predictions, farmers can move beyond simply identifying problems to anticipating them. This proactive approach allows for early detection, minimal intervention, and ultimately, maximized yield potential while minimizing the use of inputs.
Phase 1: Gathering Comprehensive Data Inputs
The foundation of any robust crop health monitoring workflow is the quality and comprehensiveness of its input data. This initial phase focuses on gathering a multi-faceted view of the field, ensuring that subsequent analysis is built upon a solid evidentiary base. First, we incorporate the Field Scouting Report. This human-intelligence layer provides invaluable ground-truth data collected by agronomists, detailing physical observations of the crops in the field-identifying visible signs of distress or infestation. Concurrently, we pull Crop Growth Stage Data from reliable databases or remote sensing platforms. Knowing precisely where the crop is in its lifecycle (e.g., vegetative, flowering, maturity) is critical because a specific pest might only affect the plant at certain stages. Complementing these biological inputs is the Weather Forecast Data. Atmospheric conditions-temperature fluctuations, humidity levels, precipitation patterns, and potential pathogen activity indices-are crucial drivers that dictate disease risk and pest life cycles. Finally, as new information surfaces, any Observed Pest/Disease findings are logged here, creating an evolving, real-time log of identified threats. This aggregation ensures that the system is looking at the crop not in isolation, but within its ecological, temporal, and immediate physical context.
Integrating Field Scouting Reports: The Human Element
The process doesn't begin in a vacuum; it starts with the invaluable insights gathered from the field. The Get Field Scouting Report step is where the human element-the expertise, diligence, and eyes of your agronomists and field technicians-becomes the most critical input. These reports are more than just observational notes; they are rich datasets describing the current state of the crop. Whether it's a detailed photographic log, a quantitative count of visible insect damage, or a qualitative assessment of leaf discoloration, this initial input grounds the entire monitoring workflow in reality. These reports provide the crucial ground truth that artificial intelligence and modeling alone cannot replicate, ensuring that the subsequent analysis of growth stages, weather patterns, and risk calculations are tailored to the specific, on-the-ground conditions of your farm.
Leveraging Crop Growth Stage Data for Context
Understanding the current growth stage of a crop is foundational to accurate pest and disease management. A recommended fungicide treatment in the vegetative stage might be ineffective or harmful when the plant is flowering, and vice versa. By integrating real-time crop growth stage data, your monitoring workflow gains crucial context. This data acts as a filter, helping us pinpoint which pests or diseases are most active at that specific life cycle point, refining diagnoses and ensuring that any recommended intervention-whether it's a physical removal, biological treatment, or chemical application-is both maximally effective and minimizes unnecessary crop stress.
Harnessing Weather Forecast Data for Predictive Insights
The integration of real-time and forecasted weather data is perhaps the most crucial element in shifting crop health monitoring from a reactive process to a truly predictive one. Simply knowing that a pest is present is only half the battle; understanding when and how the next infestation might escalate depends heavily on atmospheric conditions. Our workflow ingests detailed weather forecasts-including temperature fluctuations, relative humidity, rainfall predictions, and wind speed-to calculate the ideal conditions for disease proliferation or pest life cycles. For instance, certain fungal pathogens thrive under specific combinations of high humidity and moderate temperatures. By cross-referencing these biophysical models with the scout reports, the system can predict optimal infection periods days in advance, allowing for preemptive treatments rather than costly, reactionary spraying. This predictive capability is key to determining the optimal intervention timing, saving farmers resources and maximizing yield protection.
Logging and Categorizing Observed Pests and Diseases
Accurate and consistent documentation of observed issues is the bedrock of any effective monitoring system. When a field scout or agronomist encounters signs of distress, whether it's visible leaf spot, discoloration, or pest aggregation, meticulous logging is non-negotiable. This step moves beyond a simple problem found note; it requires detailed data capture. The logging process involves recording the specific pest or disease name, noting the affected plant part (leaves, stems, fruits), and documenting the severity (e.g., using a percentage scale or a scale of 1-5). Crucially, the system must allow for categorization-differentiating between biological issues (disease vs. pest) and recording the suspected pathogen or pest species. Providing photographic evidence alongside this data greatly enhances downstream analysis, allowing the system to cross-reference images with known databases to improve diagnostic accuracy over time.
The Core Engine: Calculating the Crop Risk Score
At the heart of this entire monitoring process lies the calculation of the Crop Risk Score. This single metric acts as the central diagnostic indicator, transforming disparate pieces of information-symptoms, environmental data, and growth metrics-into an actionable, easily understood measure of immediate threat. Simply logging a sighting isn't enough; we need to know how urgent that sighting is. The Risk Score is a sophisticated algorithm that weighs several factors: the severity and type of observed pest or disease, the current susceptibility of the crop (as informed by its growth stage), and the predicted environmental stress coming from the weather forecast. A high risk score doesn't just mean 'problems exist'; it quantitatively suggests 'problems exist, and intervention is required within the next 48 hours.' This score allows farm managers to prioritize their limited time and resources, ensuring that the most vulnerable areas and the most imminent threats are addressed first, maximizing the return on scouting efforts.
Determining Optimal Intervention Timing and Strategy
The heart of an effective crop health monitoring workflow lies in its ability to move beyond mere detection and into prescriptive action. Simply identifying a pest or disease isn't enough; the critical next step is determining when and how to intervene. This is achieved through rigorous calculation of the optimal intervention timing and strategy. Our workflow integrates several data points to create a dynamic decision-making engine. By factoring in the Crop Growth Stage Data and the Weather Forecast Data, we model the pathogen or pest's lifecycle progression alongside the crop's vulnerability window. For instance, a specific fungal infection might thrive best during periods of high humidity coupled with a particular growth stage, making an intervention timed slightly before the predicted peak risk period highly effective. Furthermore, the Calculate Risk Score feeds directly into this determination. A high risk score, coupled with favorable predicted weather conditions for disease development, triggers an immediate flag. This ensures that our advice isn't just reactive but predictive, allowing farmers to apply treatments, cultural modifications, or scouting efforts exactly when they will yield the maximum positive impact on yield protection and resource efficiency.
Generating Actionable Plan Entries and Recommendations
This crucial stage transforms raw data and observations into concrete, actionable steps. After assessing the current situation-drawing from the scouting reports, growth stage data, and risk scores-the system doesn't just point out a problem; it builds a specific remediation strategy. The Generate Action Plan Entry takes into account the identified pest or disease, the crop's current susceptibility (based on growth stage), and the predicted environmental stress (from weather forecasts). It results in a detailed entry that outlines what needs to be done, where it needs to be done (specific GPS coordinates within the field), and why (linking it back to the calculated risk score). This proactive planning ensures that interventions are targeted, efficient, and scientifically justified, moving the farm from diagnosis to cure with maximum precision.
Assigning Follow-up Tasks and Workflow Management
Assigning a clear follow-up task is crucial for converting raw data and identified risks into tangible, actionable steps. Once the risk score is calculated and intervention timing is determined, the system automatically generates a specific follow-up task, assigned directly to the appropriate technician. This moves the process from mere monitoring to active management. The task might include everything from Inspect Sector B for fungal growth using microscope X to Apply pesticide Y at concentration Z on date D. This structured assignment ensures accountability and prevents crucial diagnoses from falling through the cracks, providing a traceable management trail for every field intervention.
Communication Backbone: Alerting Stakeholders on Critical Findings
Effective communication is the linchpin of any successful proactive monitoring system. When critical issues-such as an outbreak of a highly virulent disease or an infestation by a resistant pest-are detected, timely and accurate communication is paramount. Our workflow doesn't just generate data; it ensures that the right people know the right information, at the right time. This involves a multi-layered alerting system. Firstly, the Alert Stakeholders on Critical Findings step triggers immediate notifications when the calculated risk score crosses predefined danger thresholds. Secondly, this often cascades into Notify Responsible Personnel, ensuring that the decision-makers-whether they are farm managers, agronomists, or pesticide suppliers-are immediately aware of the severity and location of the problem. Finally, the workflow automatically facilitates Update Field Status across all relevant platforms, providing a single source of truth to prevent confusion and ensure that subsequent actions are based on the latest, most accurate intelligence. This automated, multi-channel alerting backbone transforms raw data into actionable emergency responses.
Ensuring Accountability: Notifying Responsible Personnel
This crucial step ensures that the right people are aware of potential issues and can take immediate action. Once a risk score crosses a predefined threshold or a critical observation is logged, the system automatically notifies the designated personnel. This might involve sending urgent SMS alerts to farm managers, creating high-priority tickets for agronomists, or triggering immediate emails to site supervisors. By centralizing and automating these alerts, we eliminate reliance on manual reporting, drastically reducing response time and ensuring that critical findings never get missed.
Keeping Track: Updating Real-Time Field Status
This continuous feedback loop is vital for maintaining operational awareness. By systematically updating the field status after each inspection or intervention, the entire team gains a single source of truth. This immediate update doesn't just close out a task; it informs the next cycle. For instance, if a technician reports that fungicide X was applied in Sector B, the system instantly flags that area as Treated - Follow-up required in 14 days, preventing accidental double-treating or missing necessary re-checks. This live status tracking ensures that all stakeholders-from agronomists to farm managers-are operating with the most current picture of the field's health, allowing for proactive decision-making rather than reactive troubleshooting.
Culminating Insights: The Weekly Crop Health Report
The culmination of this entire monitoring process is the Generate Weekly Crop Health Report. This isn't just a compilation of data; it's a strategic narrative. By synthesizing the latest scouting findings, comparing them against ideal growth stage metrics, and factoring in prevailing weather patterns, this report provides a holistic view of the field's overall vitality. It moves beyond mere observation to actionable intelligence, highlighting trends, escalating concerns before they become crises, and providing the bedrock data needed for proactive farm management.
Resources & Links
- Leading Agritech Platforms : Comprehensive overview of advanced platforms that integrate scouting, imagery, and data analysis for modern farm management.
- Plant Pathology & Entomology Journals : Academic resources for staying updated on the latest identification guides, symptoms, and lifecycle stages of common crop pests and diseases.
- Agricultural Weather Services : Reliable sources for localized, high-resolution weather forecasting specifically relevant to agricultural practices (e.g., fungicide spray windows, humidity).
- Crop Development Stage Guides : Educational resources detailing key phenological stages of major crops to correlate with disease susceptibility.
- Farm Management Software Deep Dives : Articles showcasing how different software tools automate data logging, task assignment, and reporting within farming operations.
- Precision Agriculture & Scouting Techniques : Guides on best practices for physical field scouting, including sampling techniques and initial assessment protocols.
- Agricultural Risk Modeling Best Practices : Conceptual articles on building risk scoring models that incorporate multiple variables (weather, pest load, crop stage).
- Critical Alert & Notification Systems : Examples of successful implementation of automated alert systems for immediate action, such as sending SMS or email notifications to specific personnel.
- IoT for Real-Time Field Monitoring : Information on using sensors and connected devices to provide continuous, up-to-the-minute status updates on farm conditions.
Najczęściej zadawane pytania
What is the primary goal of a crop health monitoring workflow?
The primary goal is to create a systematic, proactive approach to detecting pests and diseases early, allowing for timely interventions that minimize crop loss and optimize yield stability.
What are the key components of an effective monitoring workflow?
An effective workflow includes regular field scouting, the use of advanced sensing technologies (like drones or satellite imagery), real-time data collection, and the integration of predictive analytics for decision-making.
How does early detection impact pest and disease management?
Early detection allows farmers to implement localized treatments, reducing the need for widespread chemical applications, lowering costs, and preventing small outbreaks from becoming uncontrollable epidemics.
Can automated tools replace manual field scouting?
While automated tools like IoT sensors and AI-driven imaging provide continuous monitoring and scale, manual scouting remains a vital component for ground-truthing data and inspecting physical plant symptoms closely.
What role does data analytics play in streamlining crop health?
Data analytics processes large volumes of environmental and biological data to identify patterns, predict potential outbreak windows, and provide actionable insights, transforming raw observations into strategic management decisions.
Czy ten artykuł był pomocny?
Demonstracja rozwiązania do zarządzania rolnictwem
Prowadzenie gospodarstwa rolnego lub firmy działającej w branży rolnej jest skomplikowane. Platforma Work OS firmy ChecklistGuro upraszcza Twoje działania, od planowania upraw i zarządzania nawadnianiem, po monitorowanie hodowli i planowanie zbiorów. Zwiększ wydajność, zmniejsz straty i zwiększ plony! Zobacz, jak ChecklistGuro może zrewolucjonizować Twoją działalność w branży rolnej.
Powiązane artykuły
10 prostych kroków do sprawnego systemu odpływu: szablon listy kontrolnej

Opanowanie codziennego raportu z inspekcji upraw: szablon listy kontrolnej dla [Konkretna uprawa]
Lista kontrolna systemu nawadniania: zarządzanie zasobami wodnymi w gospodarstwie i optymalizacja plonów.
Odblokuj potencjał swojego ogrodu: Lista kontrolna weryfikacji pH gleby
Szablon listy kontrolnej dotyczącej środków ochrony indywidualnej: Twój przewodnik po bezpieczeństwie
Szablon listy kontrolnej zgodności z pozwoleniem na odprowadzanie wód
Ostateczna Szablon Lista Kontrolna Kalibracji GPS i Rolnictwa Precyzyjnego
Szablon listy kontrolnej analizy spływu wody
Możemy to zrobić razem
Potrzebujesz pomocy z listami kontrolnymi?
Masz pytanie? Jesteśmy tu, aby pomóc. Prześlij zapytanie, a my szybko na nie odpowiemy.