Logistics KPI & Performance Analytics Process
Optimize your supply chain efficiency with our Logistics KPI & Performance Analytics Process. Streamline end-to-end visibility, track critical delivery metrics, and transform raw logistics data into actionable, real-time insights to drive operational excellence and reduce costs.
Rozpoczęcie
Rozpoczęcie przepływu pracy/procesu.
1. Fetch Monthly Shipping Logs
Retrieve all completed delivery entries from the Logistics Data Model for the current month.
2. Fetch Operational Costs
Retrieve all fuel, labor, and maintenance cost entries from the Expenses Data Model.
3. Calculate Average Delivery Time
Calculate the average duration between 'Order Placed' and 'Delivered' timestamps from shipping entries.
4. Calculate Total Operational Cost
Sum all cost entries (fuel, labor, maintenance) to get total monthly expenditure.
5. Calculate Order Accuracy Rate
Calculate the percentage of orders with zero 'Damaged' or 'Incorrect' flags against total orders.
6. Calculate Cost Per Delivery
Divide Total Operational Cost by the total number of successful deliveries.
7. Calculate Delivery Margin
Subtract Total Operational Cost from Total Revenue collected from deliveries.
8. Create KPI Monthly Summary
Create a new entry in the 'Monthly Performance Report' data model containing the calculated KPIs.
9. Assign Performance Review Task
Create a task for the Logistics Manager to review the monthly variance report.
10. Trigger Incident Investigation
Create a task for the Fleet Supervisor if the 'Damage Rate' exceeds the predefined threshold.
11. Generate Monthly KPI Dashboard
Generate a visual report summarizing the performance trends for the management team.
12. Send Monthly KPI Summary to Stakeholders
Send an automated email to the Executive Team with the summary of key metrics.
13. Alert Fleet Manager of Critical Delay
Send an SMS alert to the Fleet Manager if the 'Average Delivery Time' increases by >15%.
14. Update Monthly Target Status
Update the 'Target vs Actual' entry in the Strategic Goals data model based on current performance.
Koniec
Koniec przepływu pracy/procesu.
Rozpoczęcie przepływu pracy/procesu.
Retrieve all completed delivery entries from the Logistics Data Model for the current month.
Retrieve all fuel, labor, and maintenance cost entries from the Expenses Data Model.
Calculate the average duration between 'Order Placed' and 'Delivered' timestamps from shipping entries.
Sum all cost entries (fuel, labor, maintenance) to get total monthly expenditure.
Calculate the percentage of orders with zero 'Damaged' or 'Incorrect' flags against total orders.
Divide Total Operational Cost by the total number of successful deliveries.
Subtract Total Operational Cost from Total Revenue collected from deliveries.
Create a new entry in the 'Monthly Performance Report' data model containing the calculated KPIs.
Create a task for the Logistics Manager to review the monthly variance report.
Create a task for the Fleet Supervisor if the 'Damage Rate' exceeds the predefined threshold.
Generate a visual report summarizing the performance trends for the management team.
Send an automated email to the Executive Team with the summary of key metrics.
Send an SMS alert to the Fleet Manager if the 'Average Delivery Time' increases by >15%.
Update the 'Target vs Actual' entry in the Strategic Goals data model based on current performance.
Koniec przepływu pracy/procesu.
Czy ten szablon przepływu pracy okazał się pomocny?
Demonstracja rozwiązania do zarządzania logistyką
Masz dość opóźnień w dostawach, zagubionych paczek i nieefektywnych tras? Platforma Work OS firmy ChecklistGuro usprawnia całą Twoją działalność logistyczną, od zarządzania magazynem i realizacji zamówień, po optymalizację tras i śledzenie dostaw. Zyskaj wgląd w czasie rzeczywistym, zmniejsz koszty i popraw satysfakcję klientów. Dowiedz się, jak ChecklistGuro może zrewolucjonizować Twoją działalność logistyczną!
Powiązane Szablony Pracy
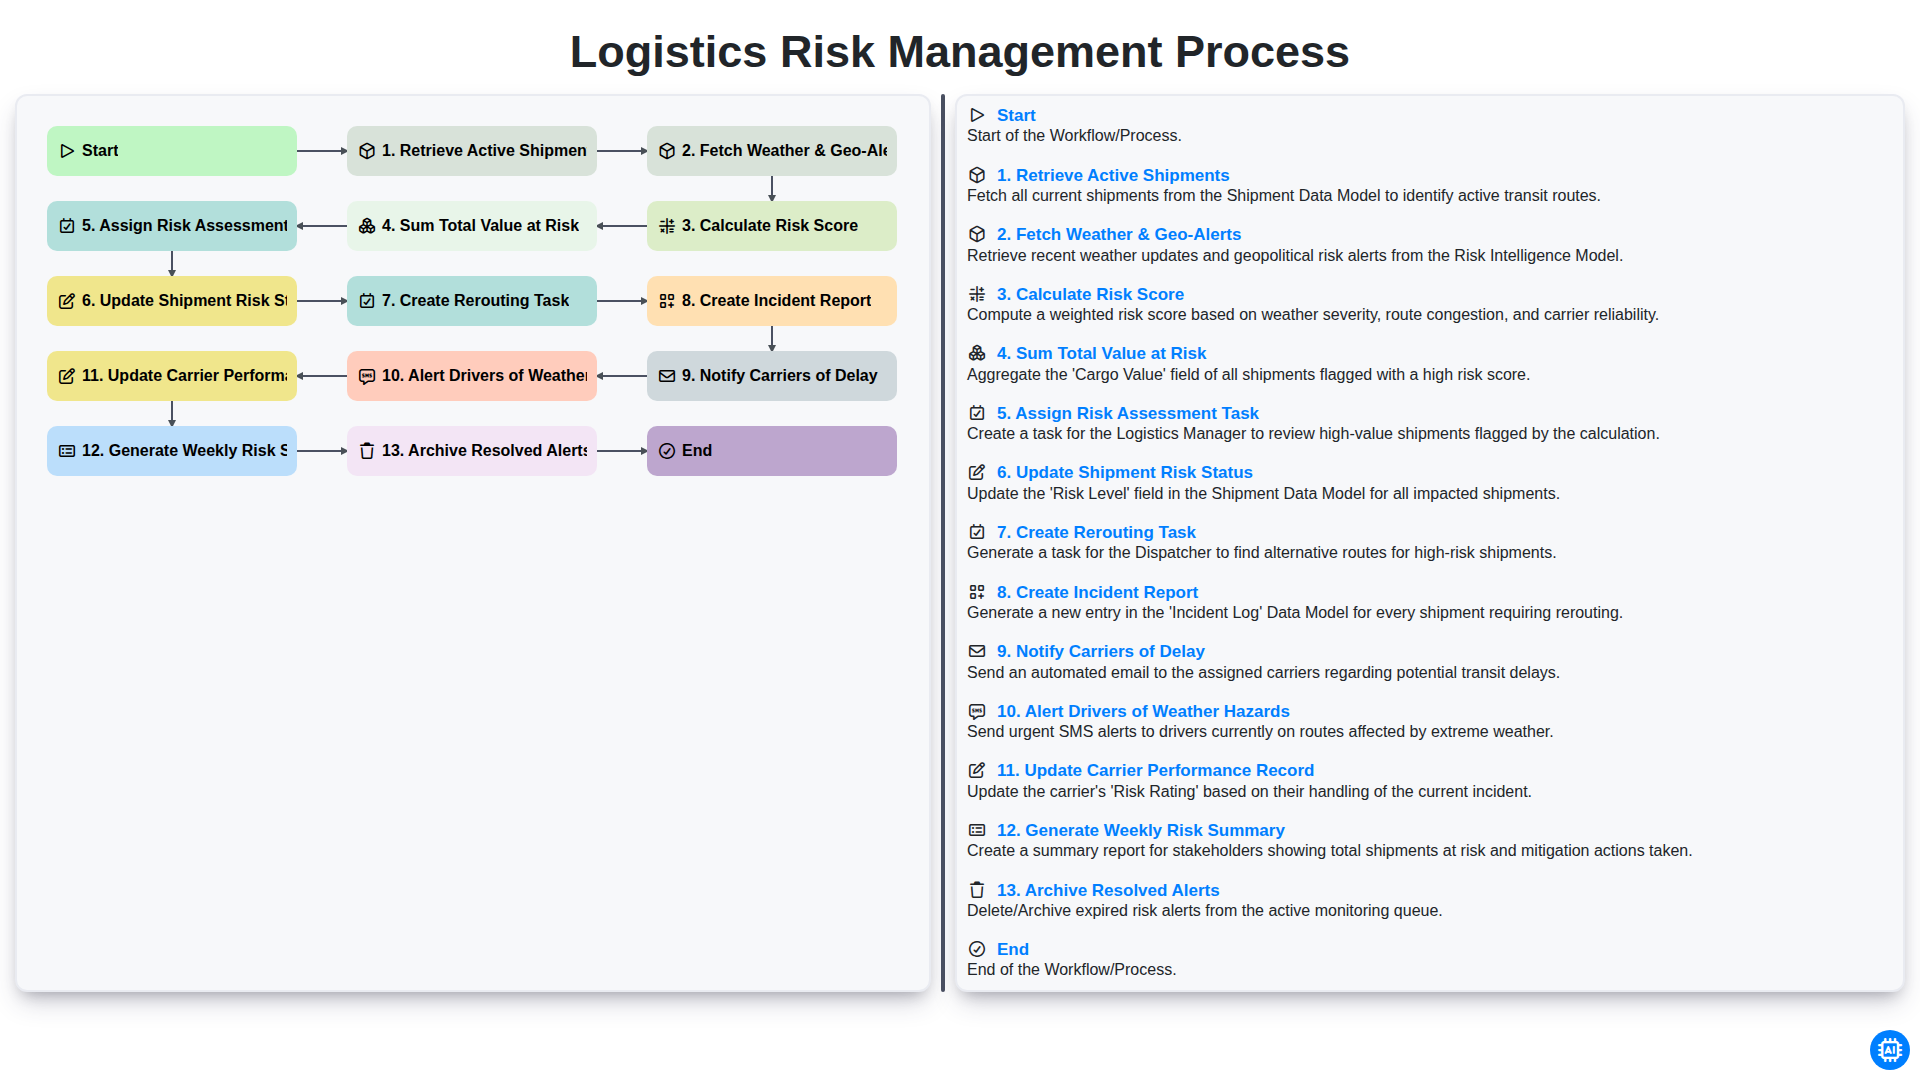
Logistics Risk Management Process
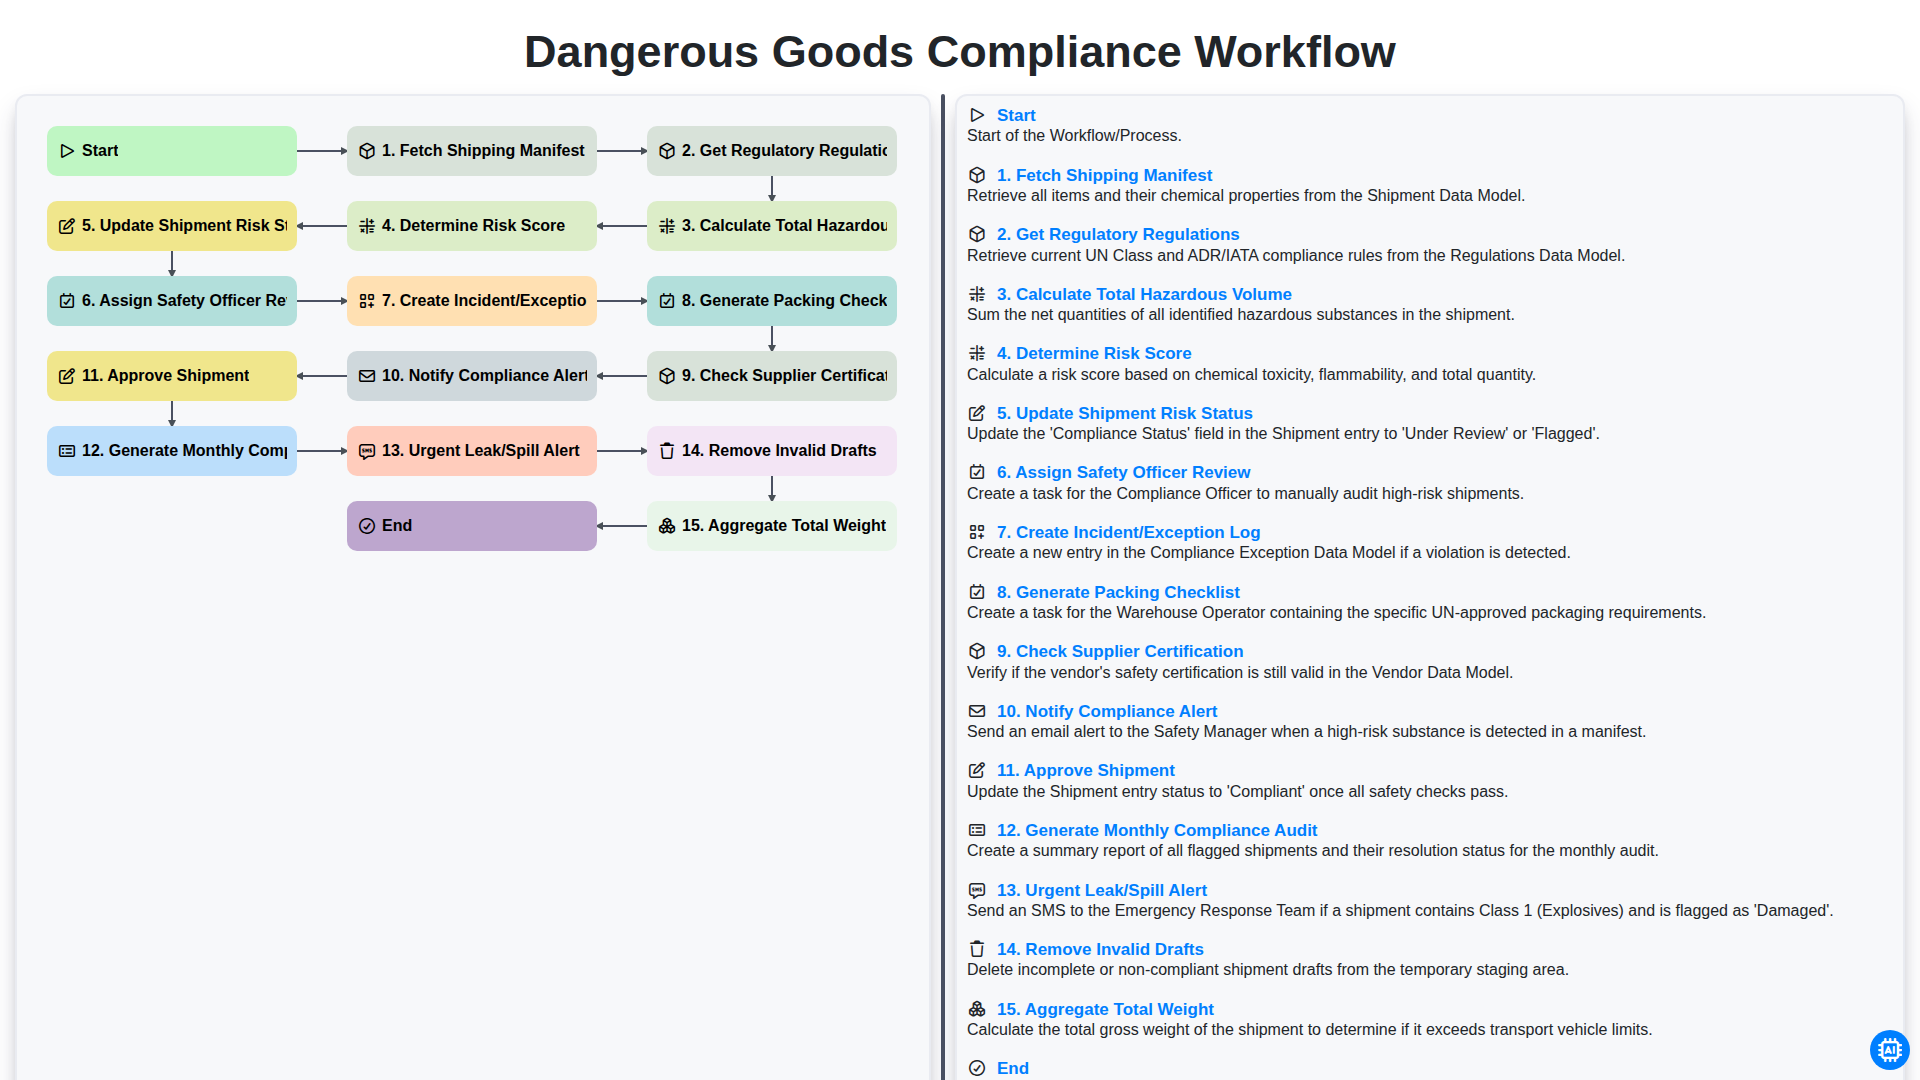
Dangerous Goods Compliance Workflow
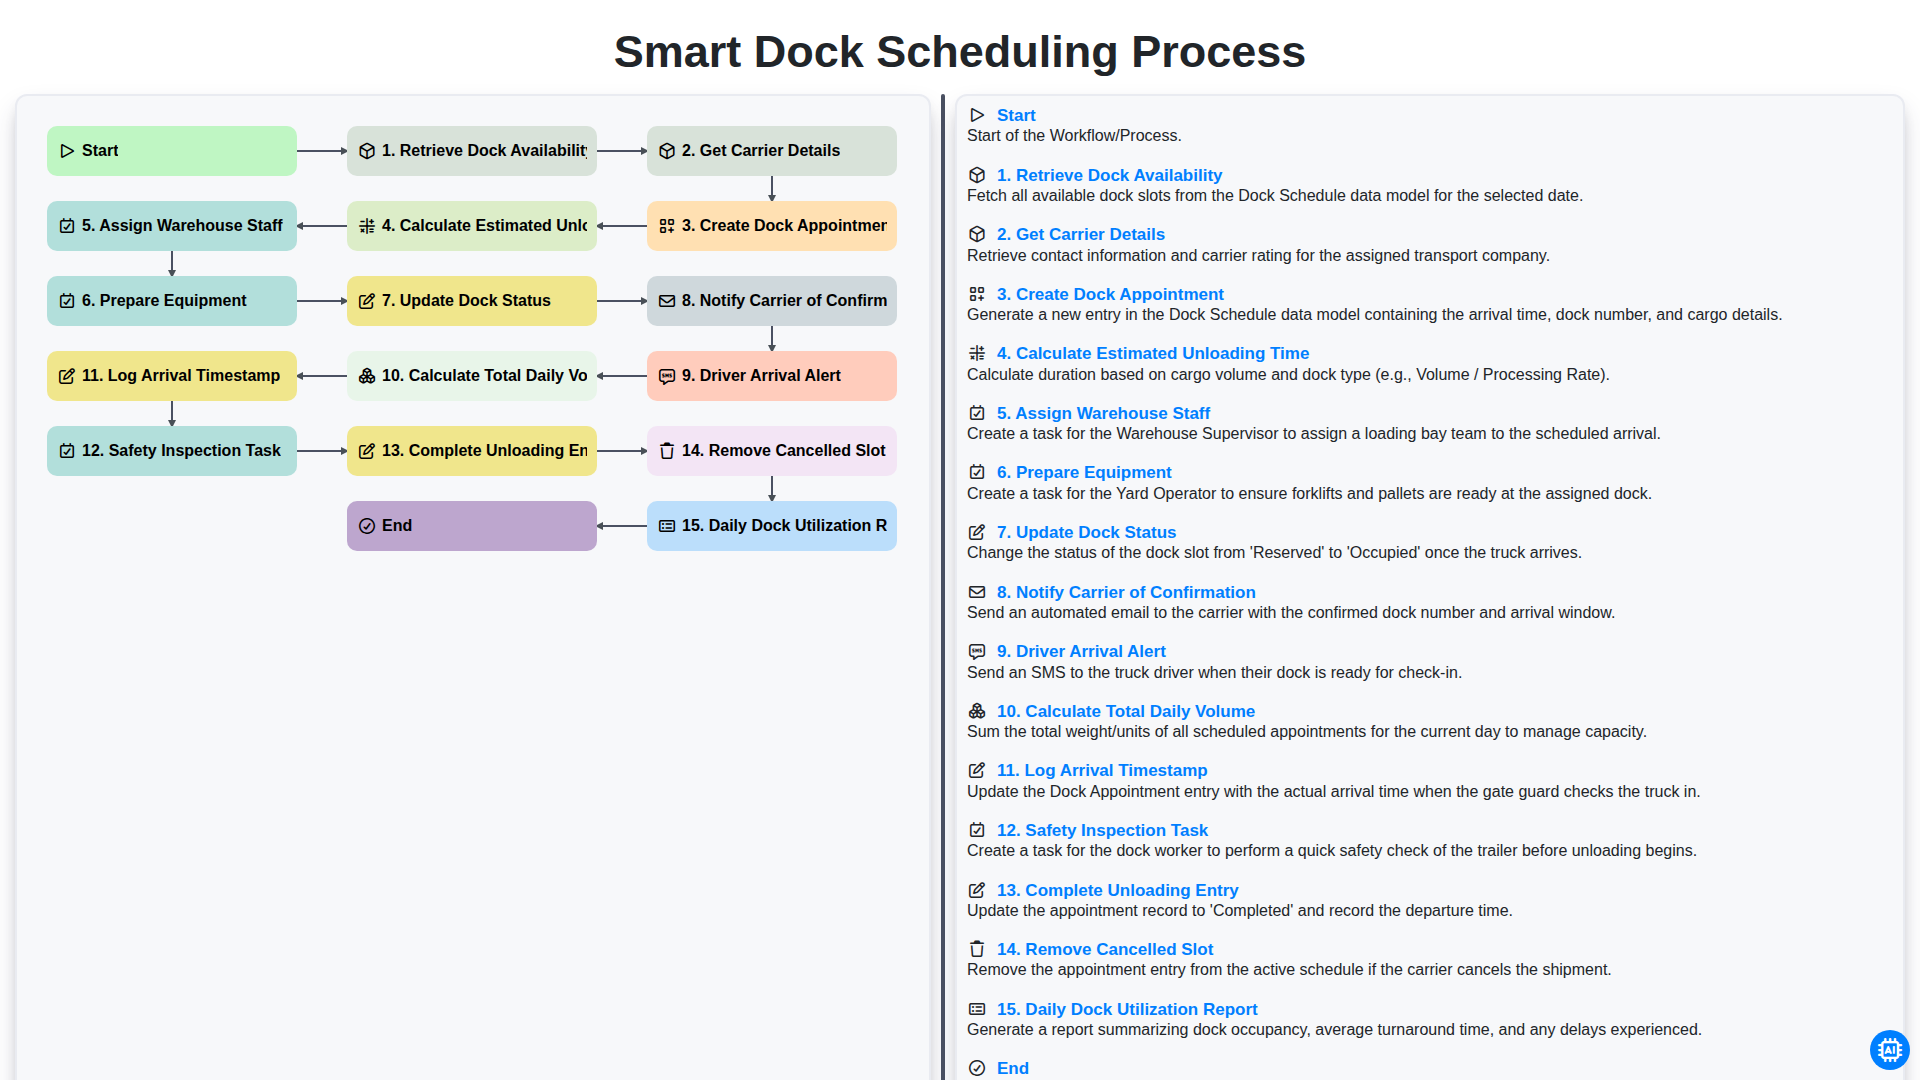
Smart Dock Scheduling Process
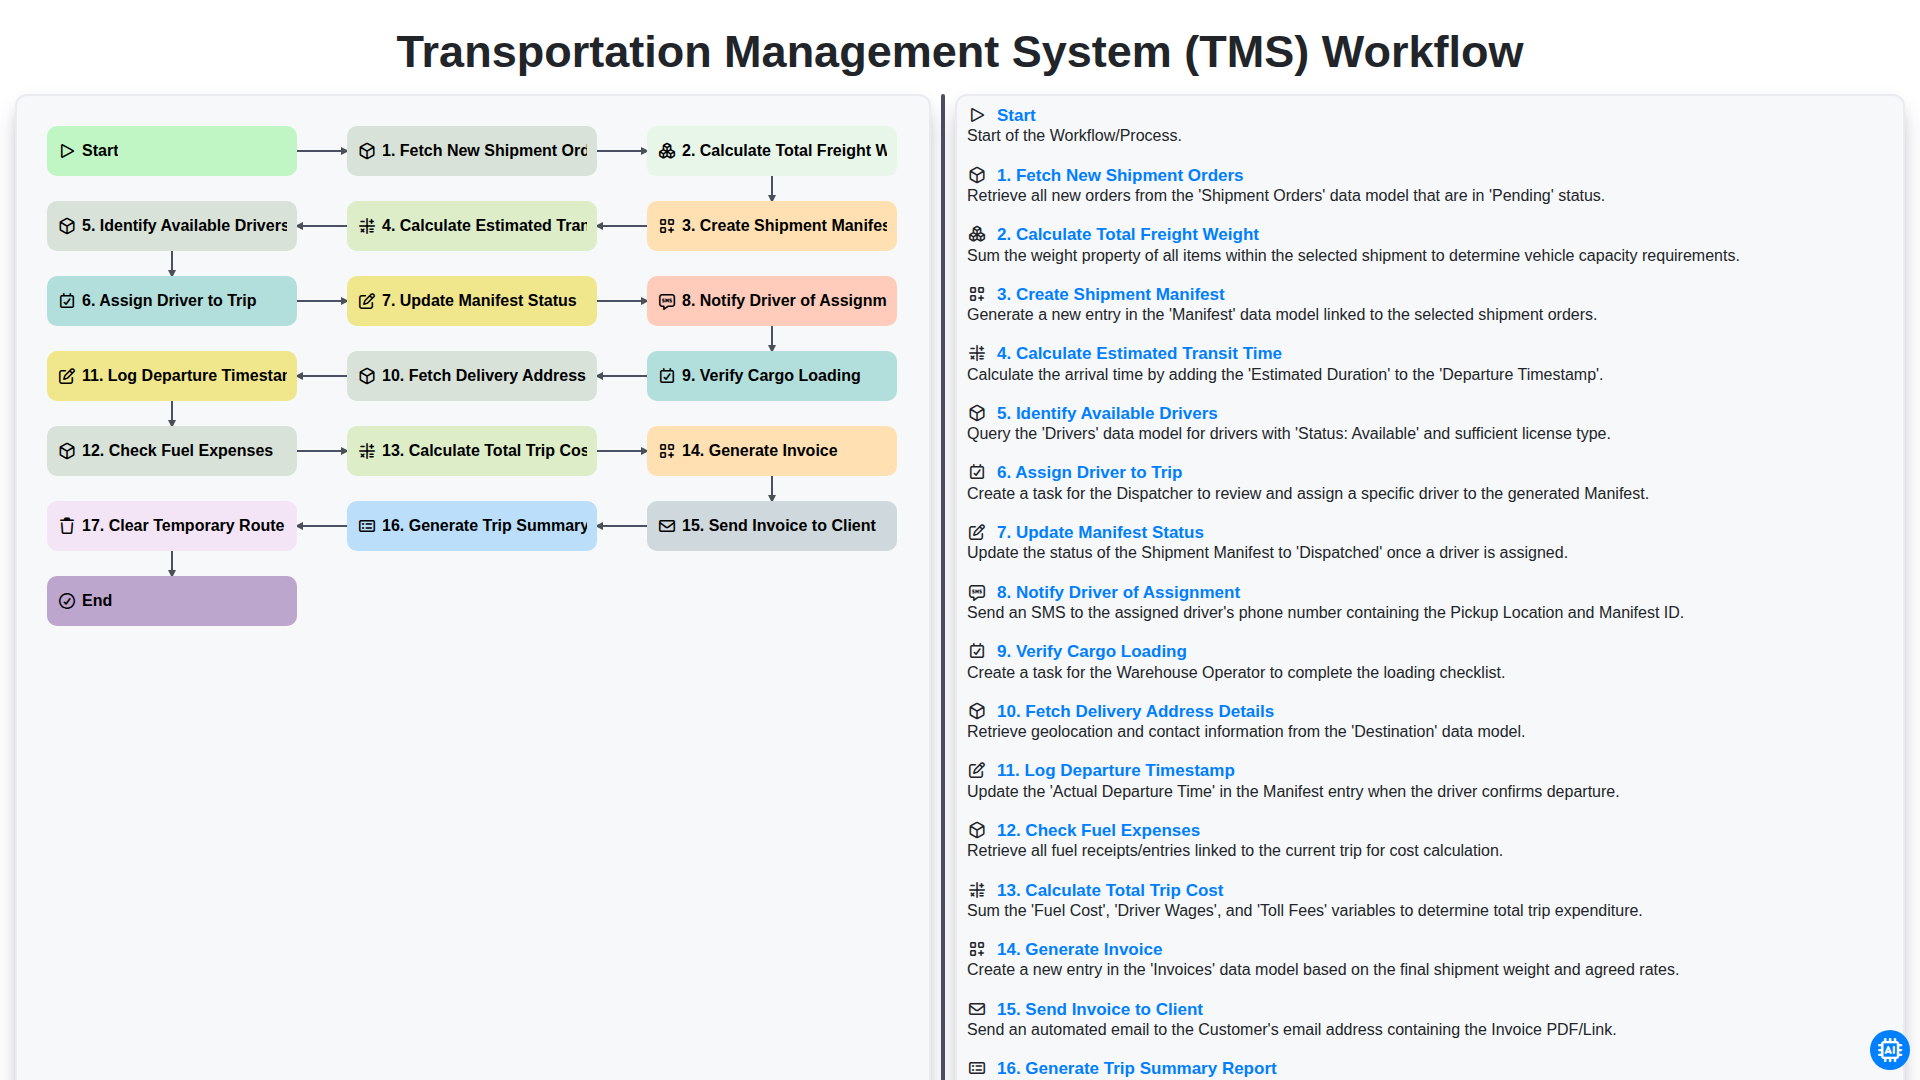
Transportation Management System (TMS) Workflow
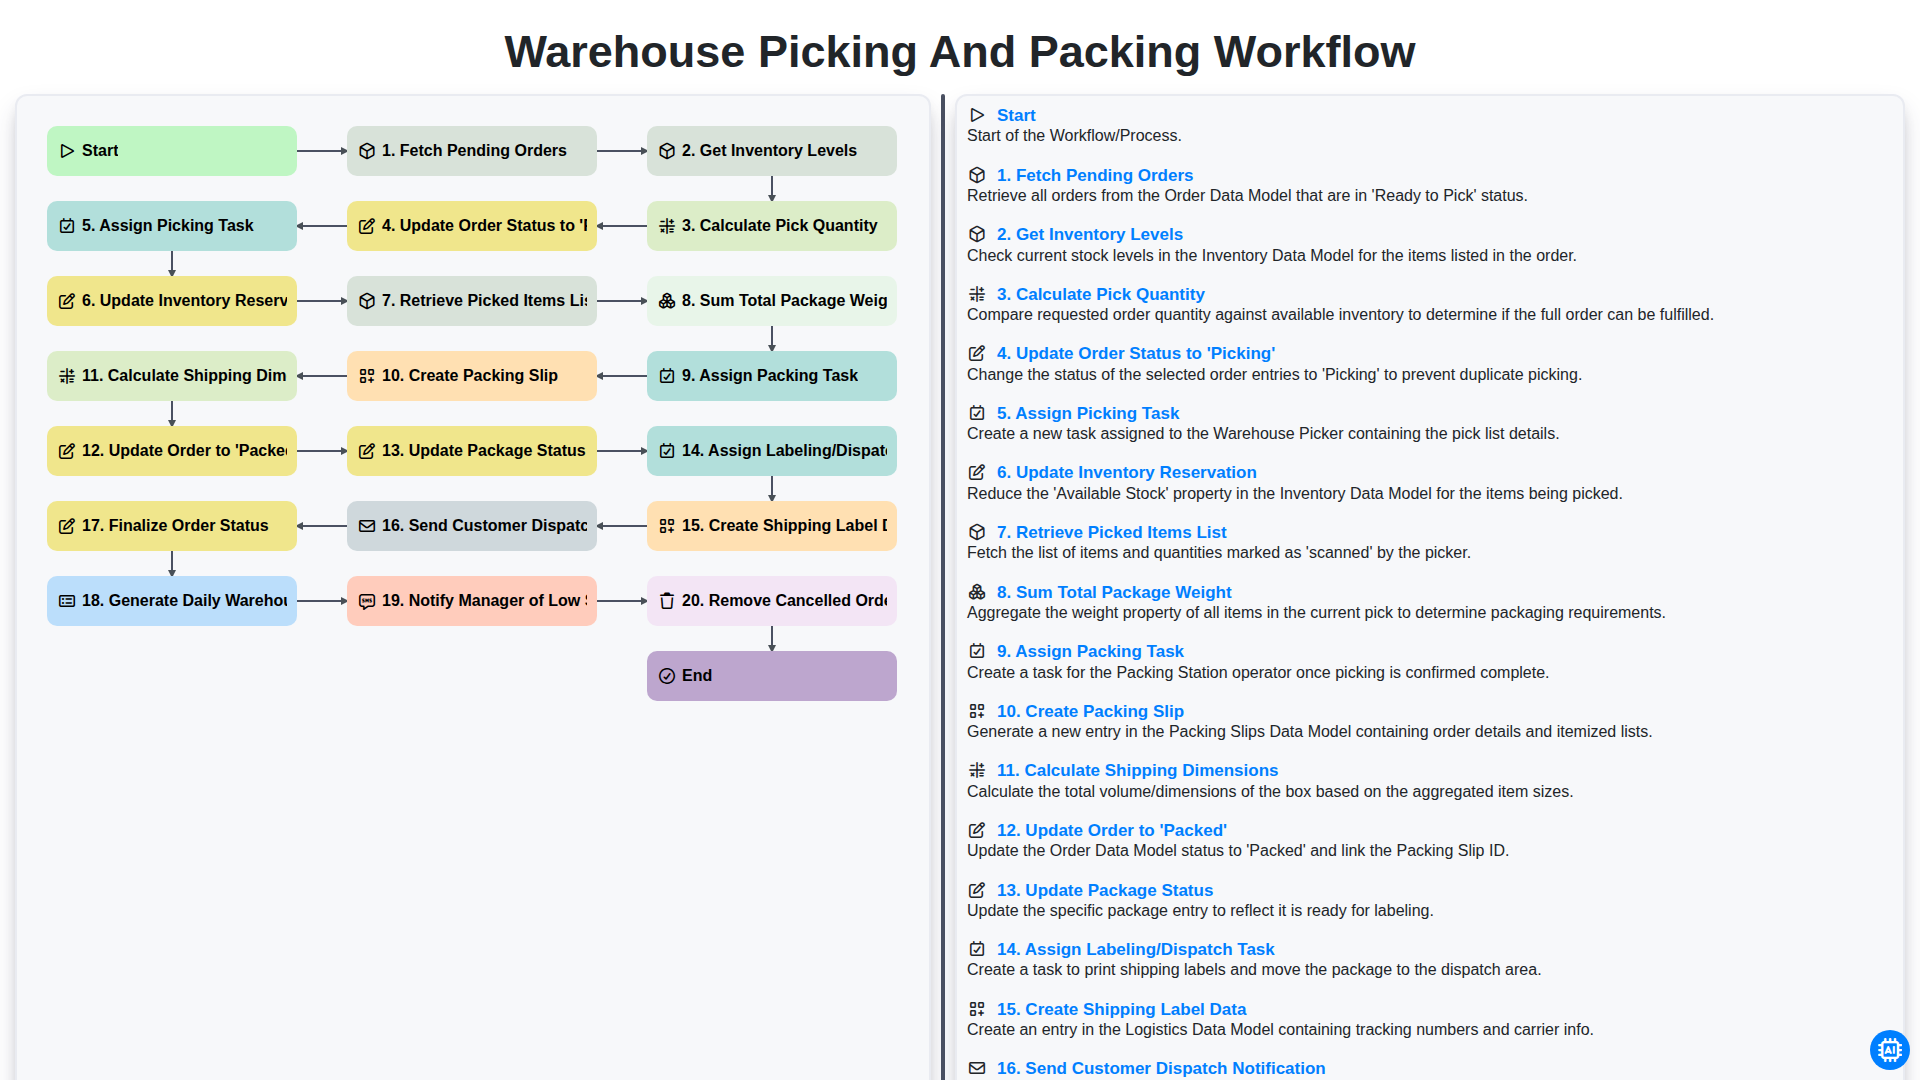
Warehouse Picking and Packing Workflow
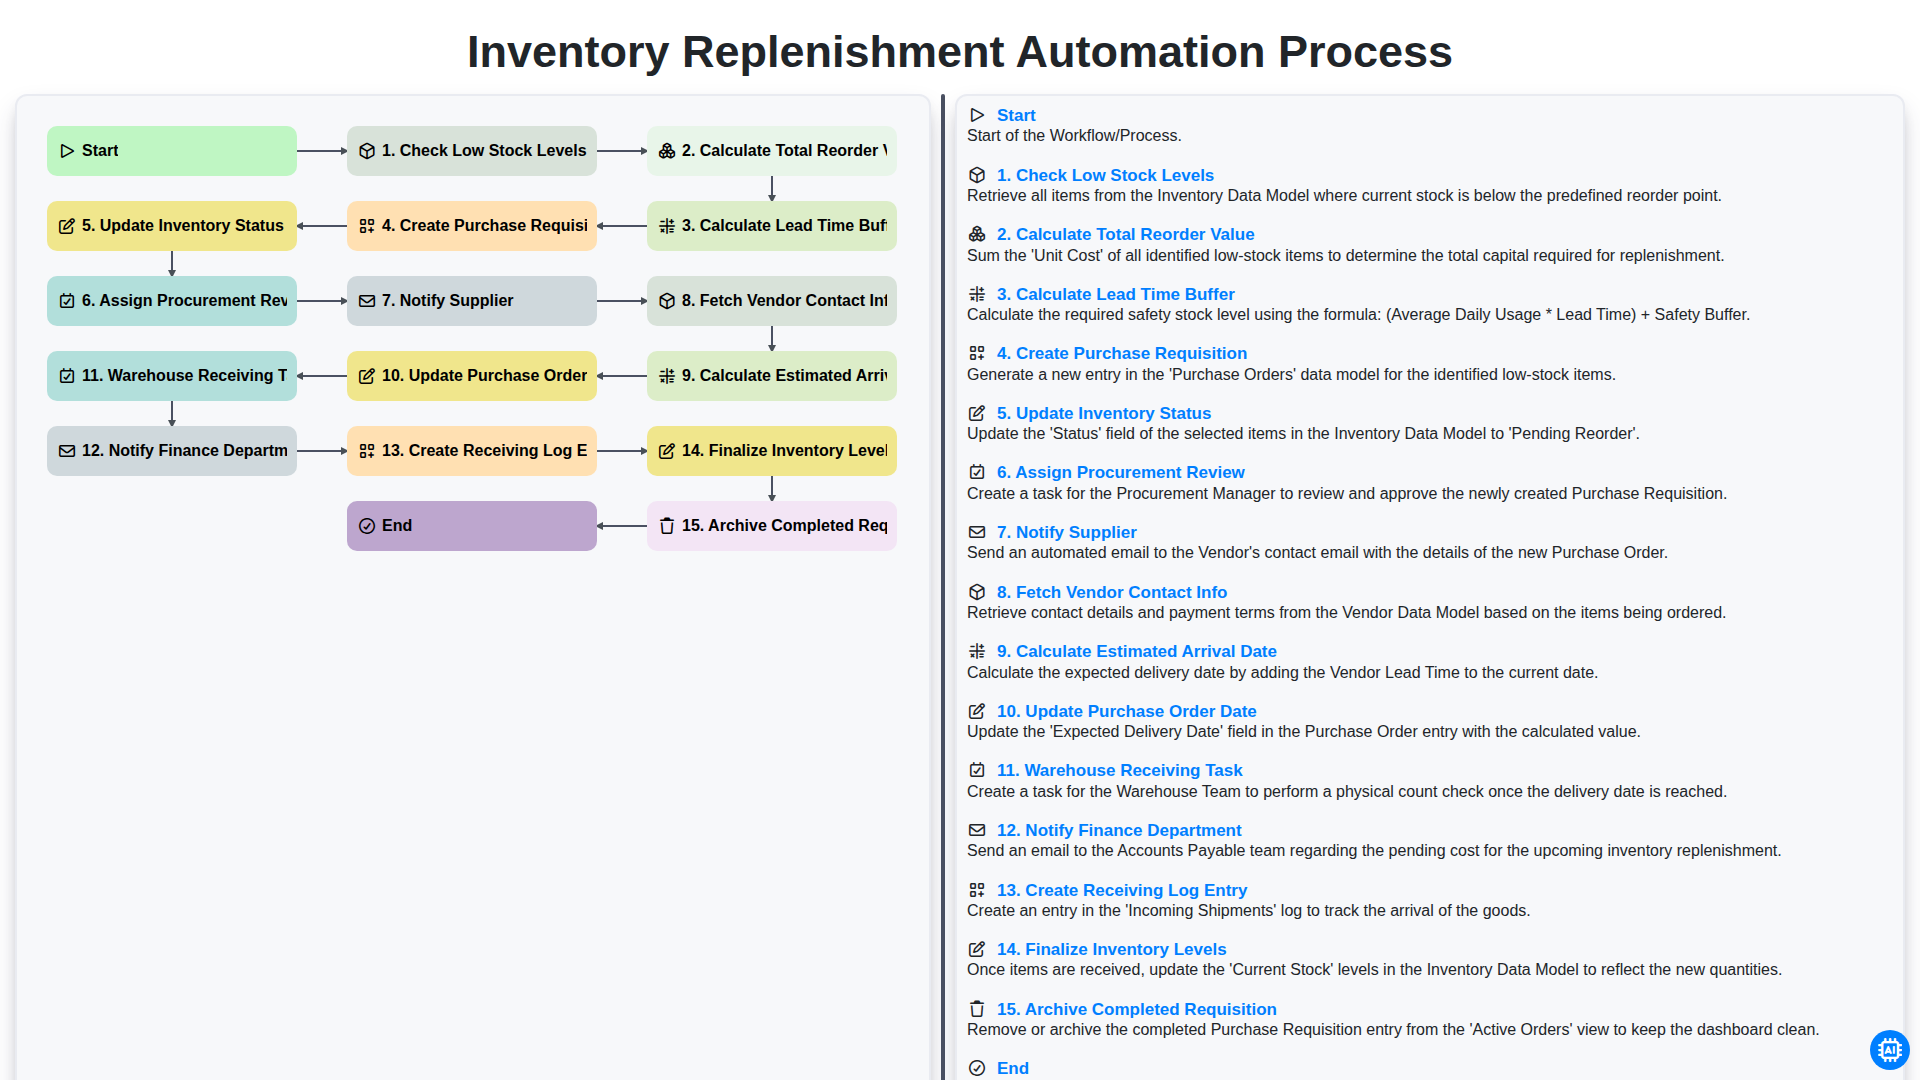
Inventory Replenishment Automation Process
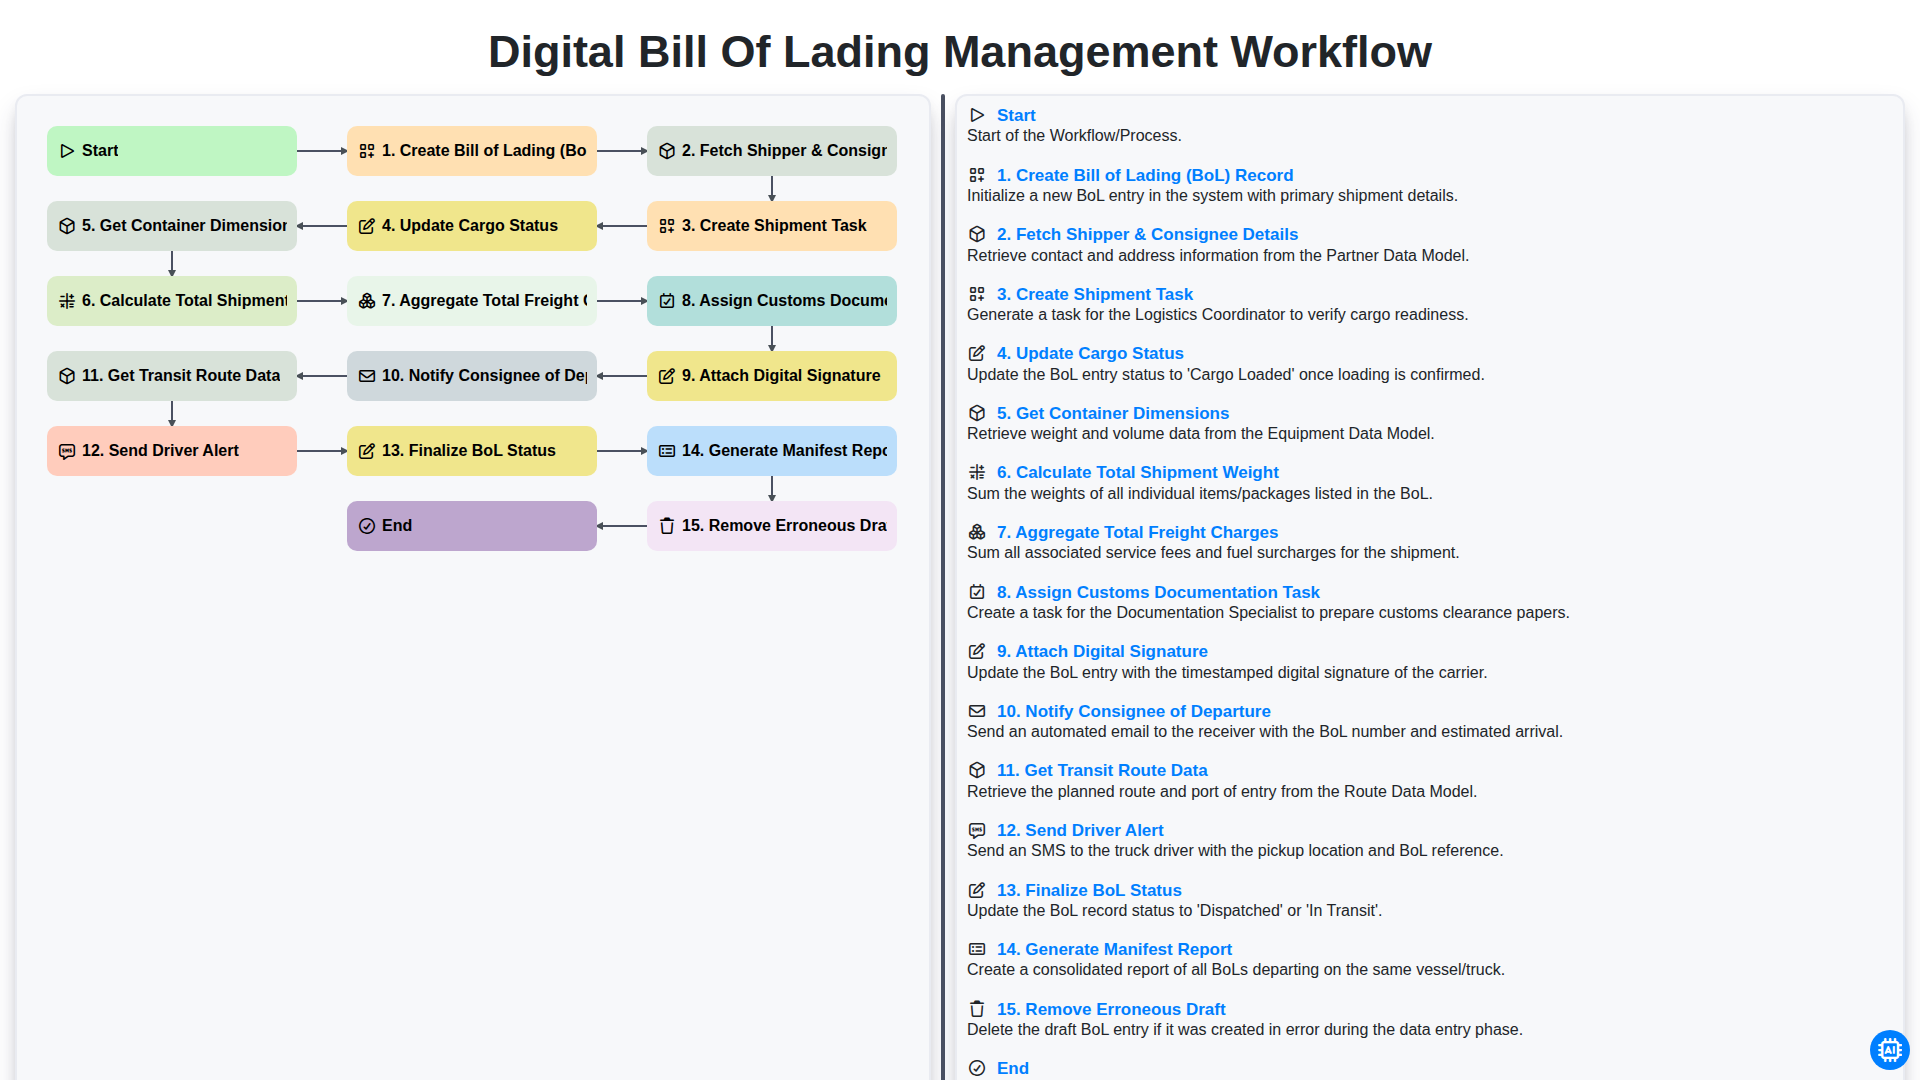
Digital Bill of Lading Management Workflow
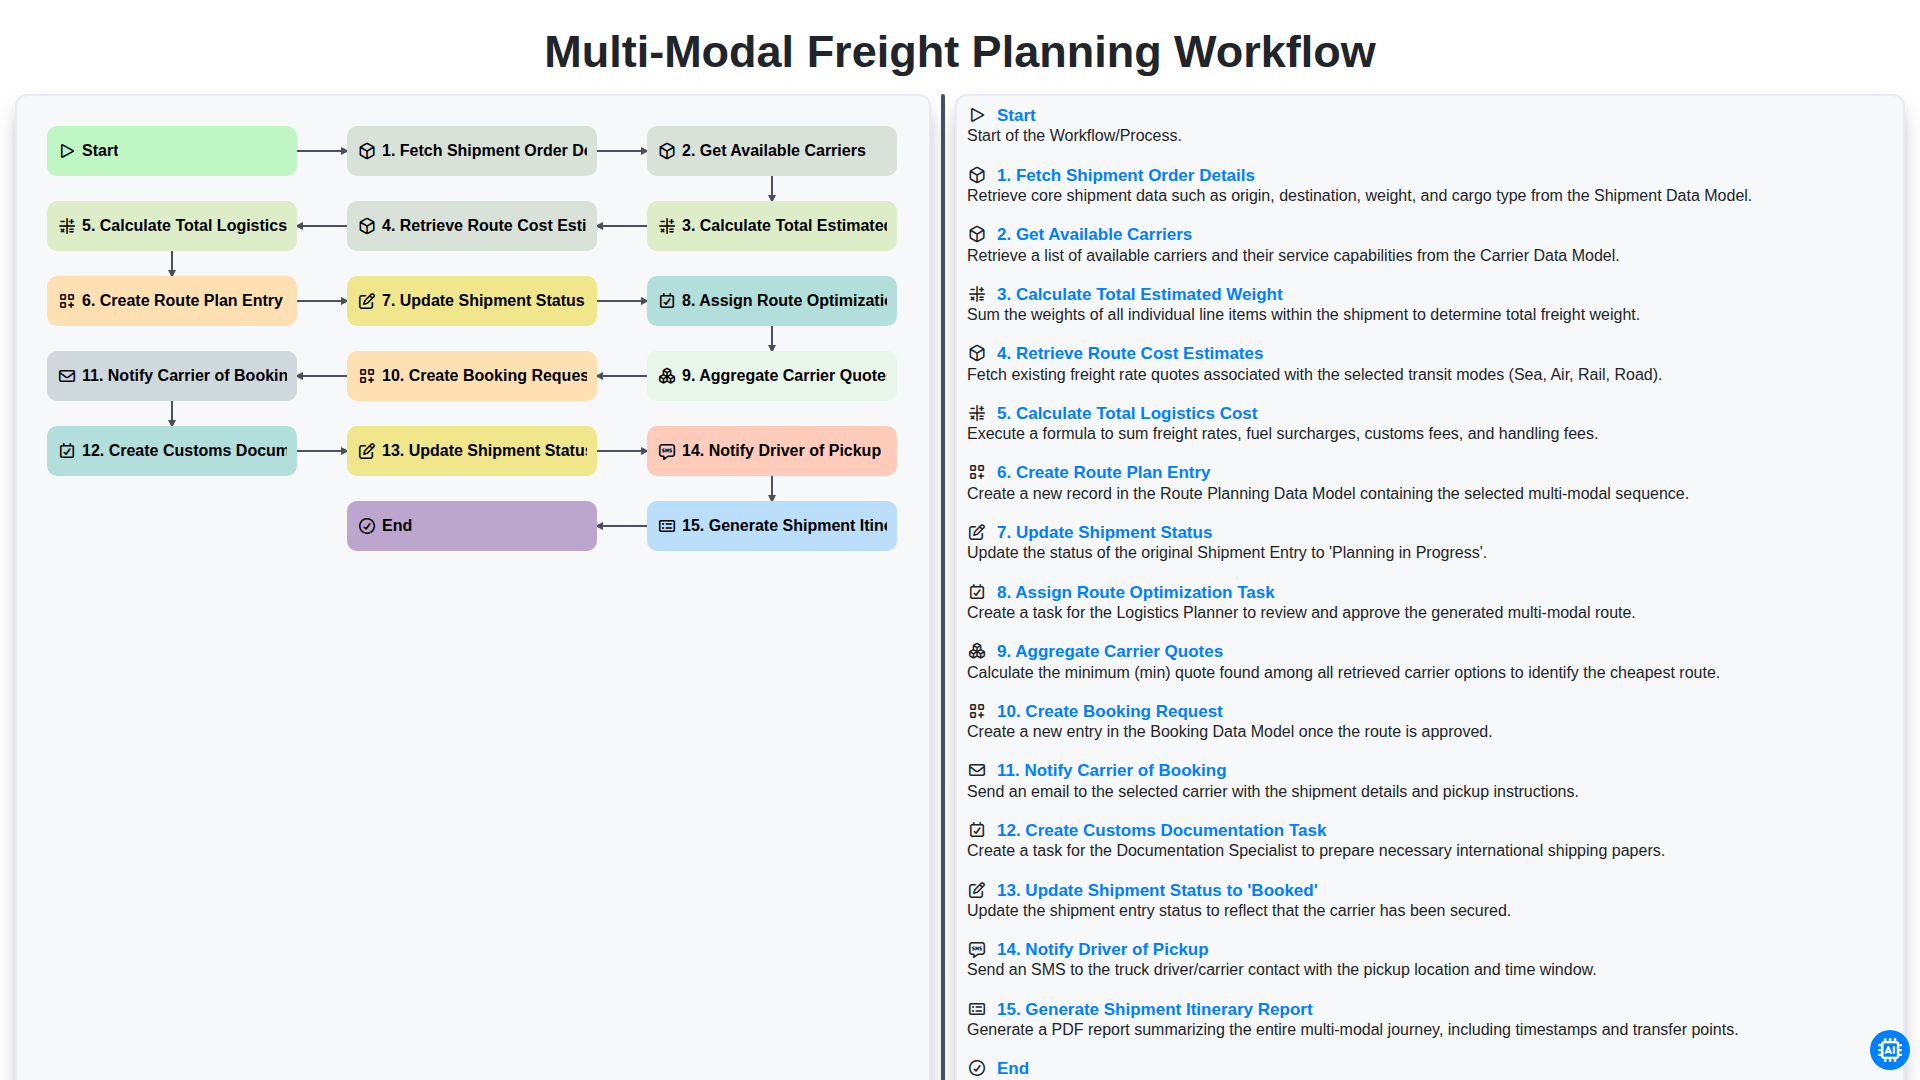
Multi-Modal Freight Planning Workflow
Możemy to zrobić razem
Potrzebujesz pomocy z listami kontrolnymi?
Masz pytanie? Jesteśmy tu, aby pomóc. Prześlij zapytanie, a my szybko na nie odpowiemy.