Mineral Processing Plant Optimization
Maximize throughput and reduce operational costs with our Mineral Processing Plant Optimization workflow. Streamline ore recovery, automate reagent dosing, and enhance downstream efficiency through data-driven process control and continuous improvement strategies designed for modern mining management.
Début
Début du flux de travail/processus.
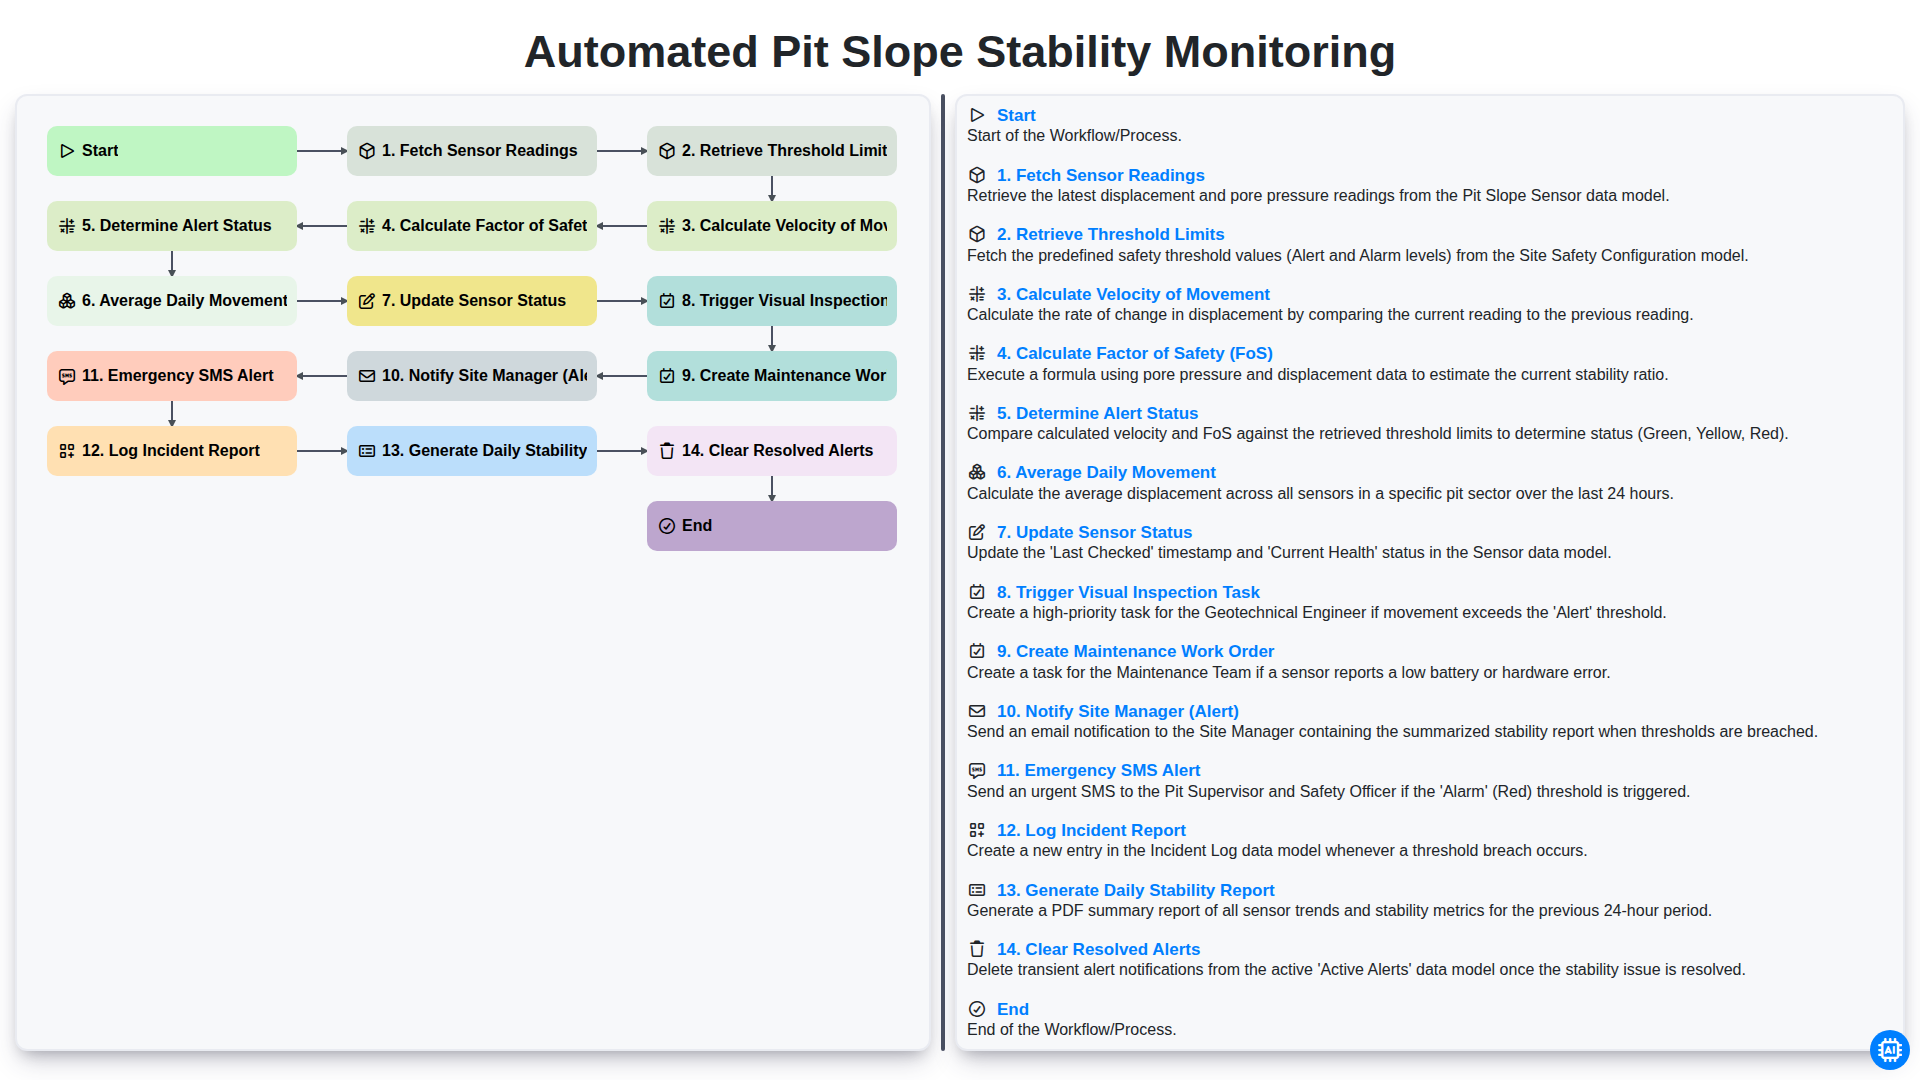
1. Fetch Sensor Telemetry
Retrieve real-time throughput, ore grade, and reagent concentration data from the Plant Sensor Data Model.
2. Retrieve Maintenance Logs
Fetch recent maintenance history and equipment health status for the grinding circuit and flotation cells.
3. Calculate Average Throughput
Calculate the average mass flow rate (t/h) from the retrieved sensor telemetry over the last 24-hour period.
4. Calculate Reagent Consumption Variance
Calculate the variance between actual reagent usage and the theoretical setpoint for the flotation process.
5. Efficiency Deviation Analysis
Execute formula: (Actual Recovery % - Target Recovery %) / Target Recovery % to determine performance gap.
6. Cost per Ton Calculation
Calculate current operational cost per ton using (Total Energy Cost + Reagent Cost + Labor Cost) / Total Throughput.
7. Issue Process Deviation Alert
Create a high-priority task for the Metallurgist to investigate identified deviations in recovery rates.
8. Schedule Equipment Inspection
Create a maintenance task for the mechanical team if vibration sensors exceed the safety threshold.
9. Log Optimization Incident
Create a new entry in the 'Incident Log' data model detailing the parameters and time of the detected anomaly.
10. Update Setpoint Recommendations
Update the 'Active Process Setpoints' data model with new optimized values for reagent dosing and mill speed.
11. Notify Plant Manager
Send an email summary of the daily optimization performance and any critical deviations to the Plant Manager.
12. Emergency Shutdown Alert
Send an SMS alert to the On-Call Supervisor if critical sensor thresholds (e.g., pressure or temperature) are breached.
13. Generate Daily Metallurgical Report
Generate a comprehensive performance report summarizing throughput, recovery, and cost metrics for the shift.
14. Clear Resolved Alerts
Delete old, resolved alert entries from the 'Active Alerts' data model to maintain dashboard clarity.
Fin
Fin du flux de travail/processus.
Début du flux de travail/processus.
Retrieve real-time throughput, ore grade, and reagent concentration data from the Plant Sensor Data Model.
Fetch recent maintenance history and equipment health status for the grinding circuit and flotation cells.
Calculate the average mass flow rate (t/h) from the retrieved sensor telemetry over the last 24-hour period.
Calculate the variance between actual reagent usage and the theoretical setpoint for the flotation process.
Execute formula: (Actual Recovery % - Target Recovery %) / Target Recovery % to determine performance gap.
Calculate current operational cost per ton using (Total Energy Cost + Reagent Cost + Labor Cost) / Total Throughput.
Create a high-priority task for the Metallurgist to investigate identified deviations in recovery rates.
Create a maintenance task for the mechanical team if vibration sensors exceed the safety threshold.
Create a new entry in the 'Incident Log' data model detailing the parameters and time of the detected anomaly.
Update the 'Active Process Setpoints' data model with new optimized values for reagent dosing and mill speed.
Send an email summary of the daily optimization performance and any critical deviations to the Plant Manager.
Send an SMS alert to the On-Call Supervisor if critical sensor thresholds (e.g., pressure or temperature) are breached.
Generate a comprehensive performance report summarizing throughput, recovery, and cost metrics for the shift.
Delete old, resolved alert entries from the 'Active Alerts' data model to maintain dashboard clarity.
Fin du flux de travail/processus.
Ce modèle de workflow vous a été utile ?
Démonstration de la solution de gestion minière
Maximisez l'efficacité et la sécurité des opérations minières ! ChecklistGuro rationalise la gestion des tâches, le suivi des équipements et la production de rapports de conformité. Optimisez les flux de travail, réduisez les risques et augmentez la productivité. Gérez tout cela grâce à notre plateforme Work OS.
Modèles de flux de travail associés
Nous pouvons le faire ensemble
Besoin d'aide avec les listes de contrôle?
Vous avez une question ? Nous sommes là pour vous aider. Veuillez soumettre votre demande et nous vous répondrons rapidement.