Pest & Disease Pressure Mapping Checklist
Unlock healthier harvests! 🌾 Our Pest & Disease Pressure Mapping checklist guides farmers to proactively identify and manage threats. Learn to spot early warning signs, create targeted interventions, and optimize crop protection - boosting yields and minimizing losses. Download now for a resilient farm! #agriculture #pestmanagement #diseasecontrol #crophealth #precisionfarming
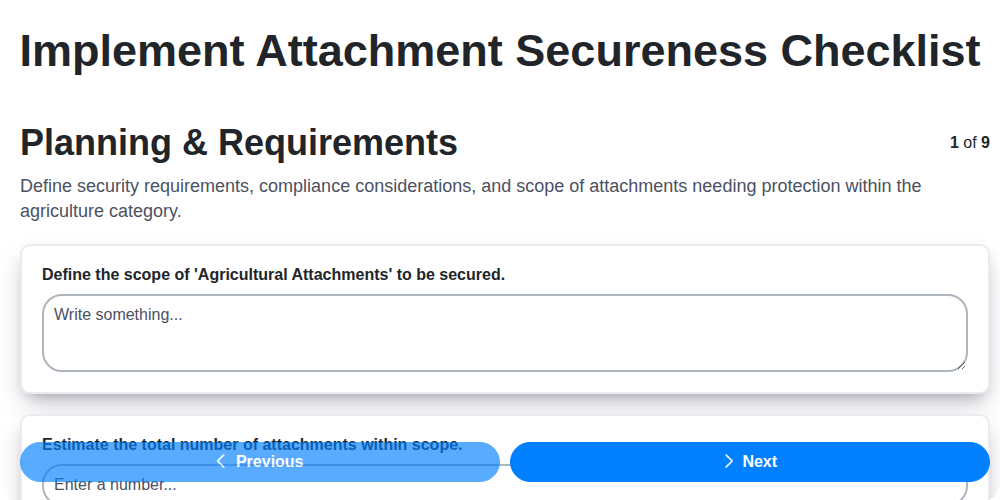
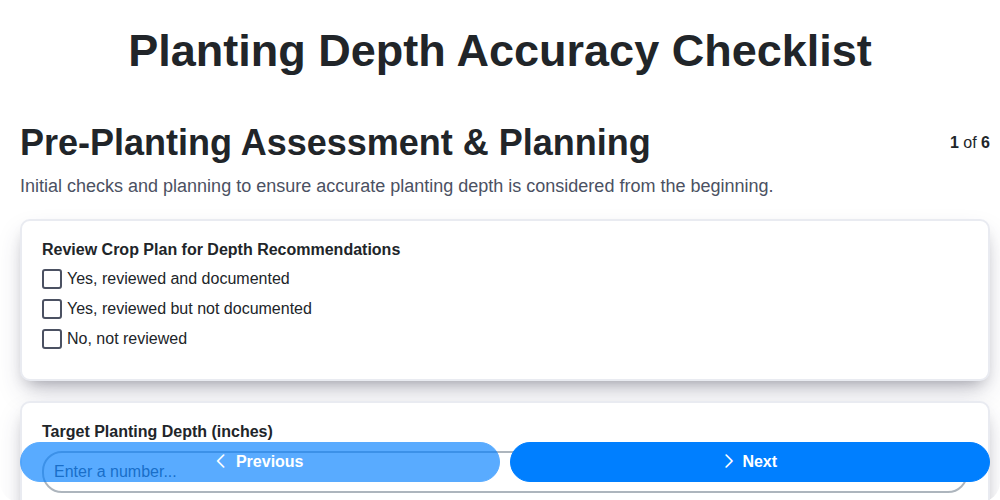
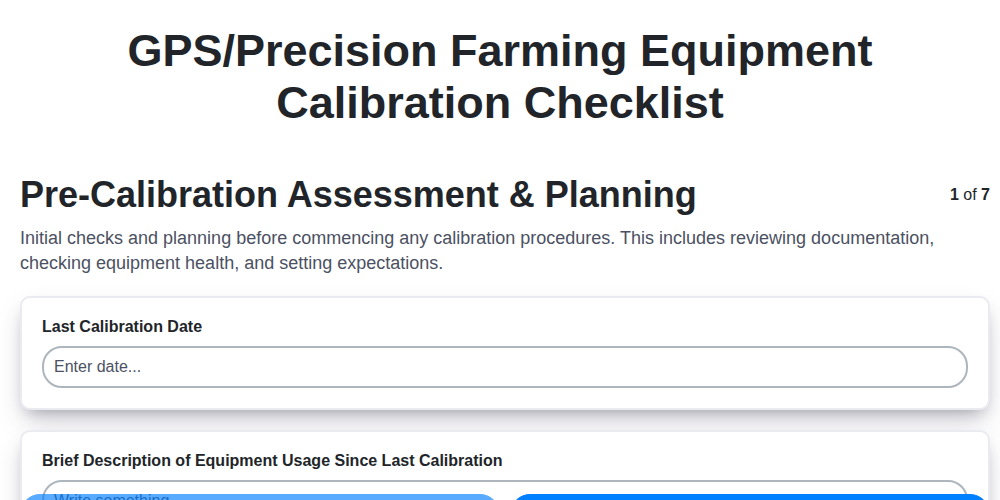
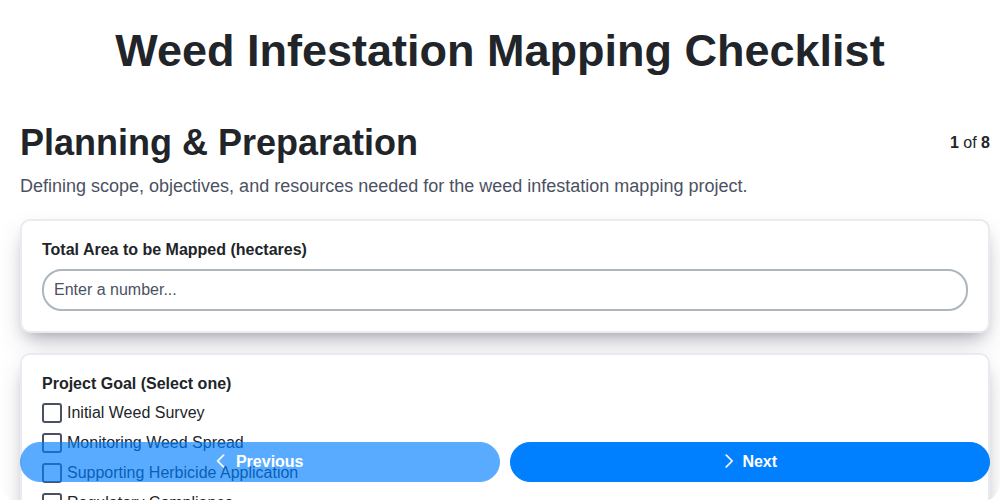
Planning & Preparation
Activities to define scope, resources, and methodology before field work begins.
Project Name
Start Date of Mapping
Total Area to be Mapped (hectares/acres)
Crop/Plant Type
Objectives of the Mapping Project
Potential Pests/Diseases of Concern
Previous Pest/Disease Reports (if available)
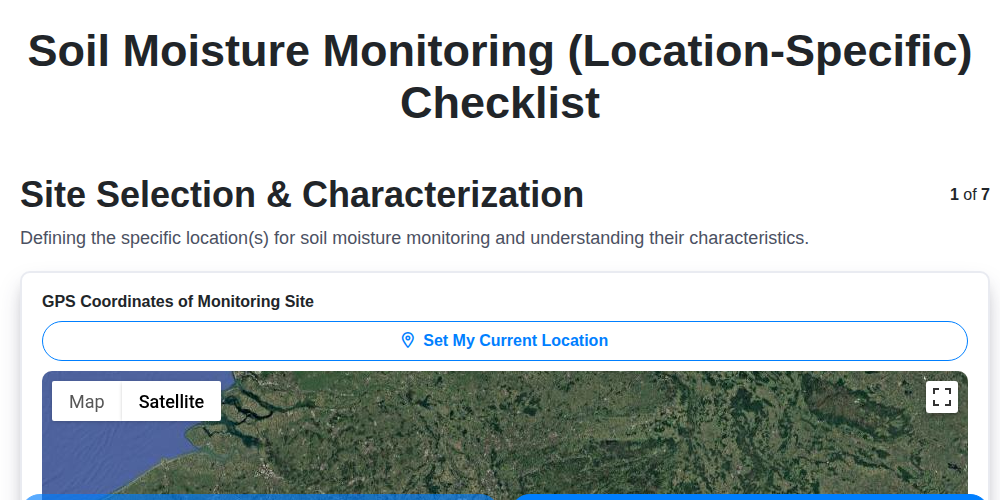
Site Selection & Stratification
Identifying representative areas and defining strata for mapping.
Number of Sites Selected
Selection Criteria Used (e.g., crop type, field history)
Justification for Site Selection
Stratification Factors Considered
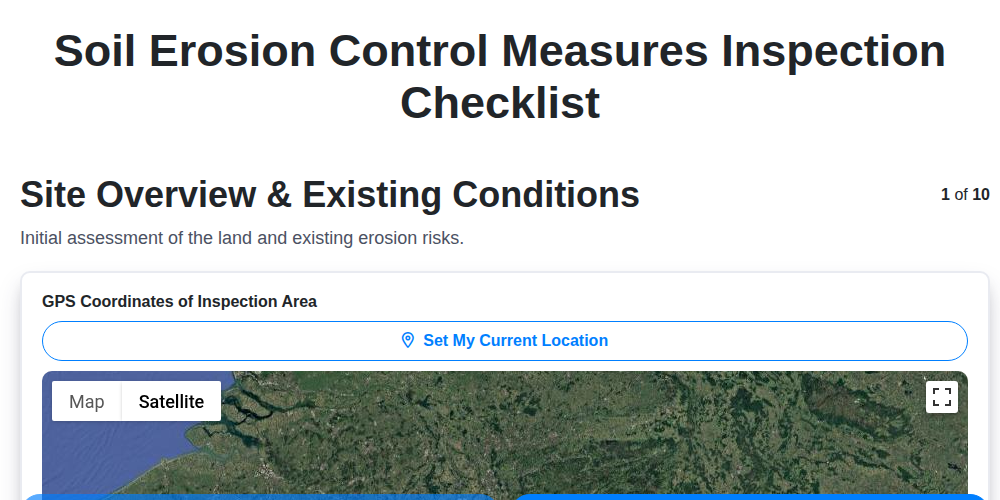
GPS Coordinates of Selected Sites
Number of Strata Created
Description of Strata Characteristics
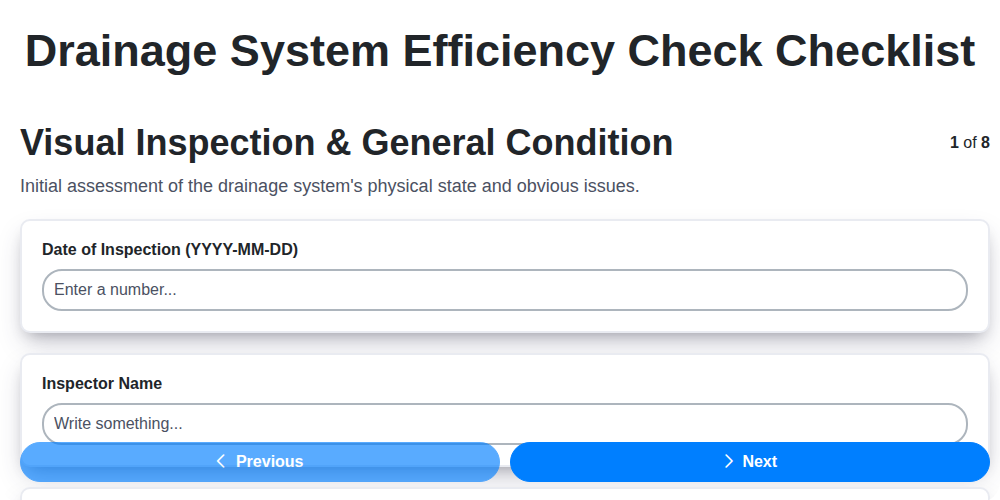
Data Collection - Visual Assessment
On-site observation and documentation of pest/disease symptoms and signs.
Observed Pest(s)
Observed Disease(s)
Percentage of Plants Affected (Estimate)
Description of Symptoms
Severity Level (Visual Estimate)
Photo Documentation
Precise Location of Observation
Data Collection - Environmental Factors
Gathering information on environmental conditions influencing pest and disease development.
Date of Environmental Data Collection
Time of Environmental Data Collection
Air Temperature (°C)
Soil Temperature (°C) - @ 10cm depth
Relative Humidity (%)
Rainfall (mm) - Last 24 Hours
Solar Radiation (W/m²)
Wind Speed (km/h)
Soil Moisture Level
Data Recording & Standardization
Ensuring consistent data recording across different locations and observers.
Plot/Field ID
Date of Observation
Time of Observation
Crop Type
Observed Pests/Diseases
Estimated Infestation/Disease Severity (0-100)
Detailed Description of Symptoms/Signs
GPS Coordinates of Observation
Georeferencing & Mapping
Assigning geographic coordinates to observations and creating spatial representations.
Record GPS Coordinates of Observation Point
Elevation (meters)
Mapping Method Used (e.g., GIS, Hand-drawn)
Attach Map Image/Screenshot
Describe Map Legend and Symbol Key
Coordinate Reference System (CRS)
Scale of Map (e.g., 1:10,000)
Data Analysis & Interpretation
Analyzing collected data to identify patterns and assess pressure levels.
Calculate Disease Incidence (%)
Calculate Pest Severity Index (0-100)
Dominant Pest/Disease Identified
Secondary Pest/Disease Presence (Select All That Apply)
Average Leaf Area Affected (%)
Describe Observed Patterns and Trends
Identify High-Risk Zones (Geolocate)
Overall Pressure Level (Subjective Assessment)
Reporting & Communication
Documenting findings and communicating them to relevant stakeholders.
Executive Summary of Findings
Identified Pests & Diseases (Select all that apply)
Estimated Severity Index (0-100)
Maps and Spatial Data (Shapefile, GeoJSON, etc.)
Recommendations for Control Measures
Recipient of Report (Choose One)
Report Submission Date
Review & Refinement
Evaluating the mapping process and identifying areas for improvement in future iterations.
Summarize overall effectiveness of the mapping methodology.
Estimate the percentage of map accuracy (based on ground truthing or comparison to known infestations).
Which data collection methods proved most effective? (Select all that apply)
What was the biggest challenge encountered during the mapping process?
Date of this review.
Recommendations for improving data recording standardization.
Was the chosen map projection suitable for the area?
Achou este modelo de lista de verificação útil?
Demonstração da Solução de Gestão Agrícola
Gerir uma quinta ou empresa agrícola é uma tarefa complexa. A plataforma Work OS da ChecklistGuro simplifica as suas operações, desde o planeamento das culturas e a gestão da irrigação até ao controlo do gado e à programação das colheitas. Aumente a eficiência, reduza o desperdício e maximize a produção! Descubra como a ChecklistGuro pode revolucionar o seu negócio agrícola.
Modelos de listas de verificação relacionados
Podemos fazer isso juntos.
Precisa de ajuda com o(a) Agriculture?
Tem alguma dúvida? Estamos aqui para ajudar. Envie a sua questão e responderemos o mais breve possível.