Transit Performance KPI Monitoring and Reporting
Optimize your agency's operational efficiency with our Transit Performance KPI Monitoring and Reporting workflow. Streamline real-time tracking of on-time performance, vehicle availability, and passenger load factors to drive data-driven decision-making. Automate complex reporting cycles, identify service bottlenecks, and enhance transit reliability with actionable insights designed for modern public transport management.
Começar
Início do fluxo de trabalho/processo.
1. Fetch Daily Transit Logs
Retrieve all completed trip entries and delay logs from the Transit Logs data model for the specified period.
2. Fetch Target KPI Thresholds
Retrieve the predefined KPI targets (e.g., On-Time Percentage target) from the KPI Configuration data model.
3. Calculate Average Delay Duration
Calculate the average value of the 'delay_minutes' property from the fetched transit logs.
4. Calculate On-Time Trip Percentage
Calculate the percentage of trips where 'status' equals 'On-Time' relative to total trips.
5. Compute Variance from Target
Calculate the difference between the Actual On-Time Percentage and the Target KPI Threshold.
6. Calculate Delay Impact Score
Execute a formula combining average delay duration and frequency of delays to determine a severity score.
7. Create KPI Daily Report Entry
Create a new record in the KPI Reporting data model containing the calculated metrics for the day.
8. Create Alert Task for Critical Deviations
Create a task for the Operations Manager if the Variance from Target exceeds the allowed threshold.
9. Create Routine Review Task
Create a recurring task for the Data Analyst to verify the accuracy of the aggregated data.
10. Update Incident Status
Update the 'last_reviewed' timestamp in the KPI Reporting entry to indicate the monitoring cycle is complete.
11. Generate Weekly Performance Dashboard
Generate a visual report/dashboard summarizing the KPI trends from the KPI Reporting data model.
12. Send KPI Summary to Stakeholders
Send an automated email containing the daily KPI summary and variance results to the management distribution list.
13. Send Emergency Delay Alert
Send an SMS alert to the Fleet Supervisor if the Delay Impact Score exceeds the critical threshold.
Fim
Fim do fluxo de trabalho/processo.
Início do fluxo de trabalho/processo.
Retrieve all completed trip entries and delay logs from the Transit Logs data model for the specified period.
Retrieve the predefined KPI targets (e.g., On-Time Percentage target) from the KPI Configuration data model.
Calculate the average value of the 'delay_minutes' property from the fetched transit logs.
Calculate the percentage of trips where 'status' equals 'On-Time' relative to total trips.
Calculate the difference between the Actual On-Time Percentage and the Target KPI Threshold.
Execute a formula combining average delay duration and frequency of delays to determine a severity score.
Create a new record in the KPI Reporting data model containing the calculated metrics for the day.
Create a task for the Operations Manager if the Variance from Target exceeds the allowed threshold.
Create a recurring task for the Data Analyst to verify the accuracy of the aggregated data.
Update the 'last_reviewed' timestamp in the KPI Reporting entry to indicate the monitoring cycle is complete.
Generate a visual report/dashboard summarizing the KPI trends from the KPI Reporting data model.
Send an automated email containing the daily KPI summary and variance results to the management distribution list.
Send an SMS alert to the Fleet Supervisor if the Delay Impact Score exceeds the critical threshold.
Fim do fluxo de trabalho/processo.
Achou este modelo de fluxo de trabalho útil?
Demonstração da Solução de Gestão de Transportes Públicos
Otimize as operações do transporte público e melhore a experiência dos passageiros! O ChecklistGuro simplifica o planeamento de rotas, a manutenção de veículos e o registo de incidentes. Aumente a eficiência, a segurança e a fiabilidade. Gerencie tudo com o nosso sistema operativo de trabalho.
Modelos de Fluxo de Trabalho Relacionados
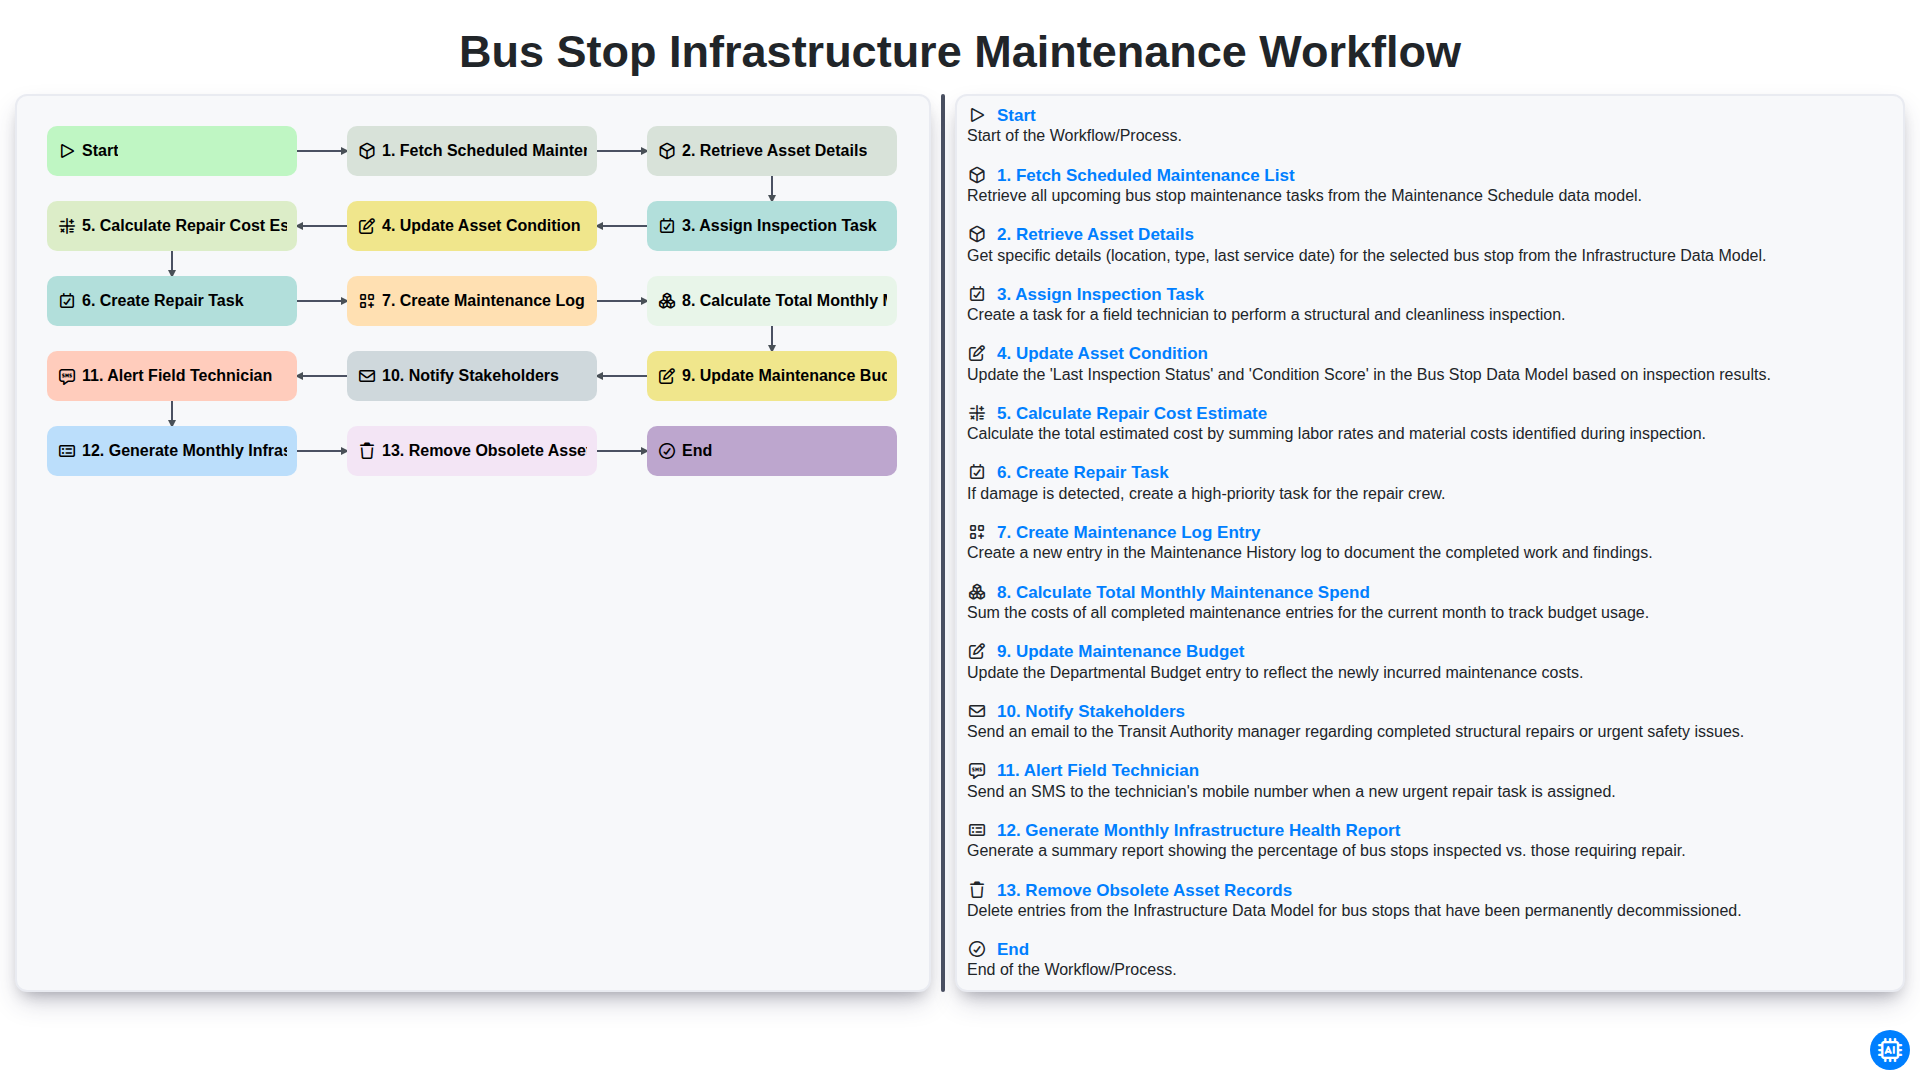
Bus Stop Infrastructure Maintenance Workflow
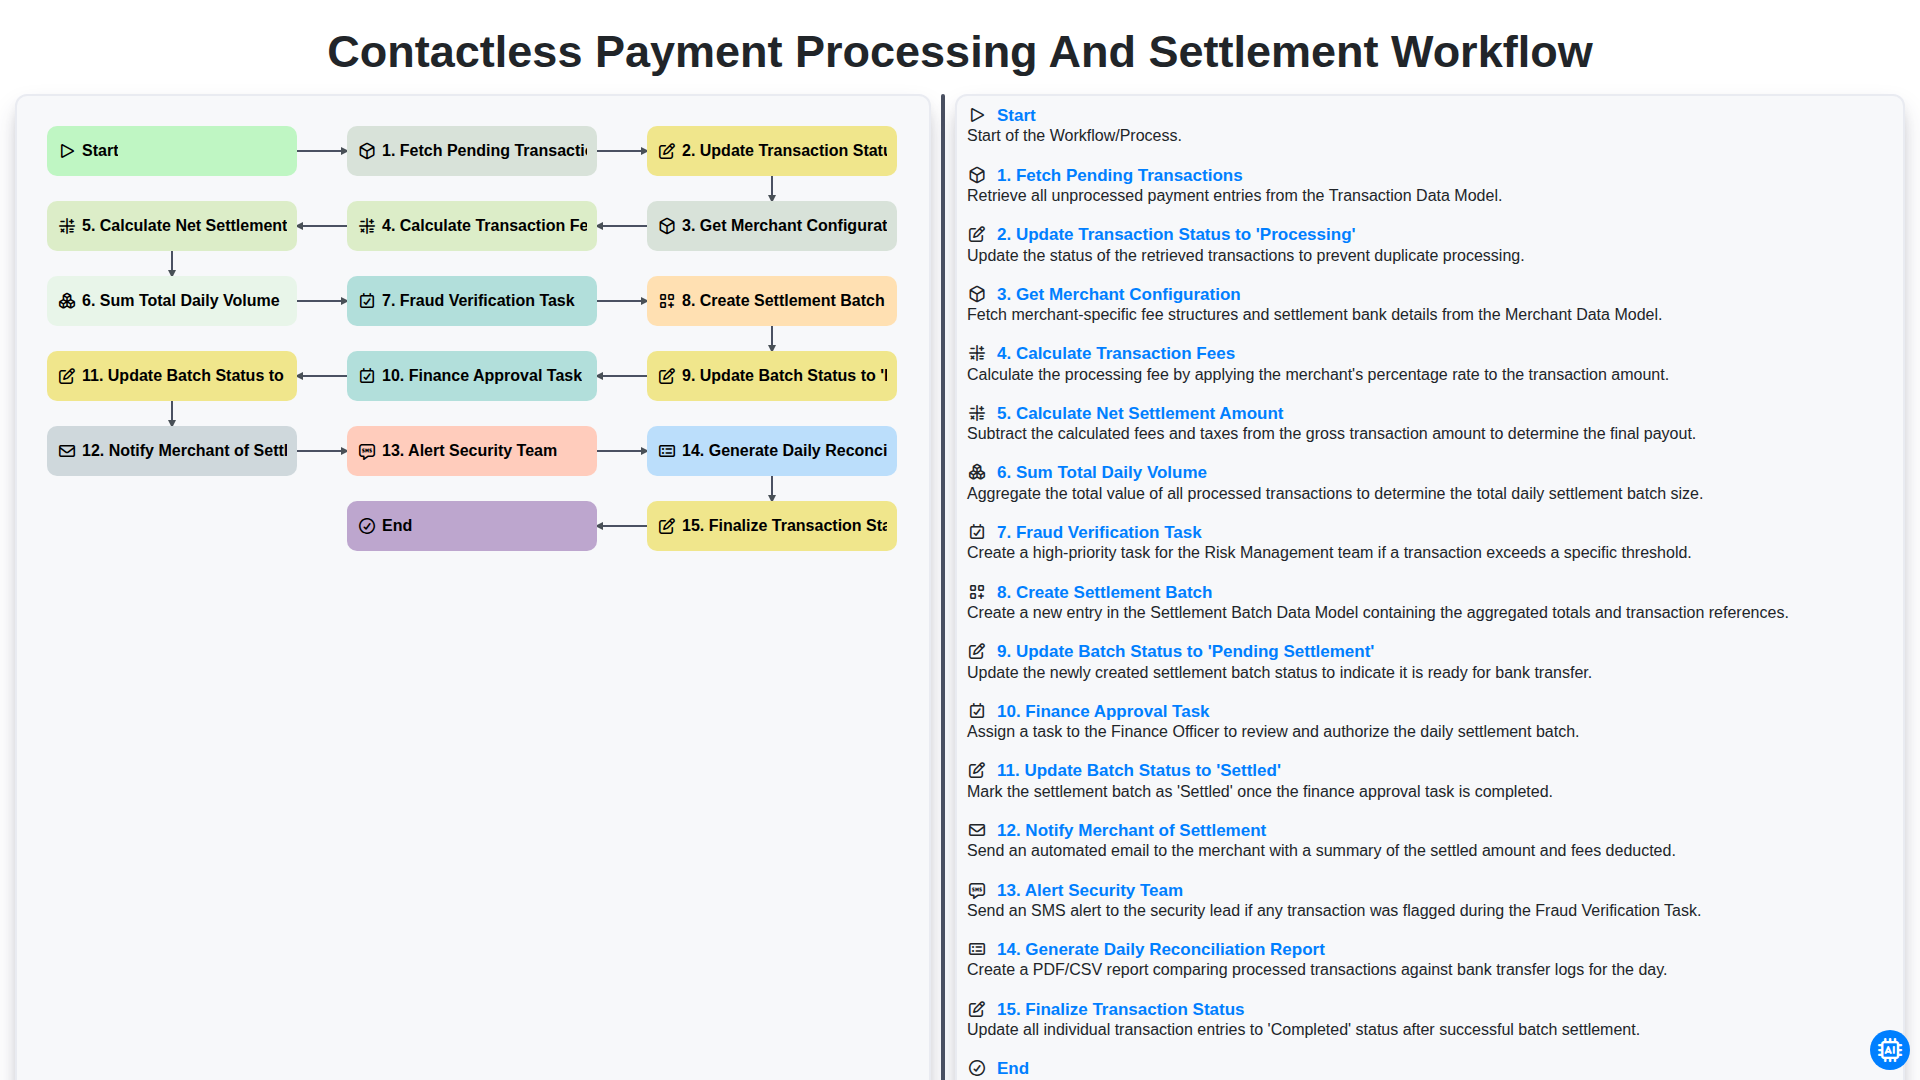
Contactless Payment Processing and Settlement Workflow
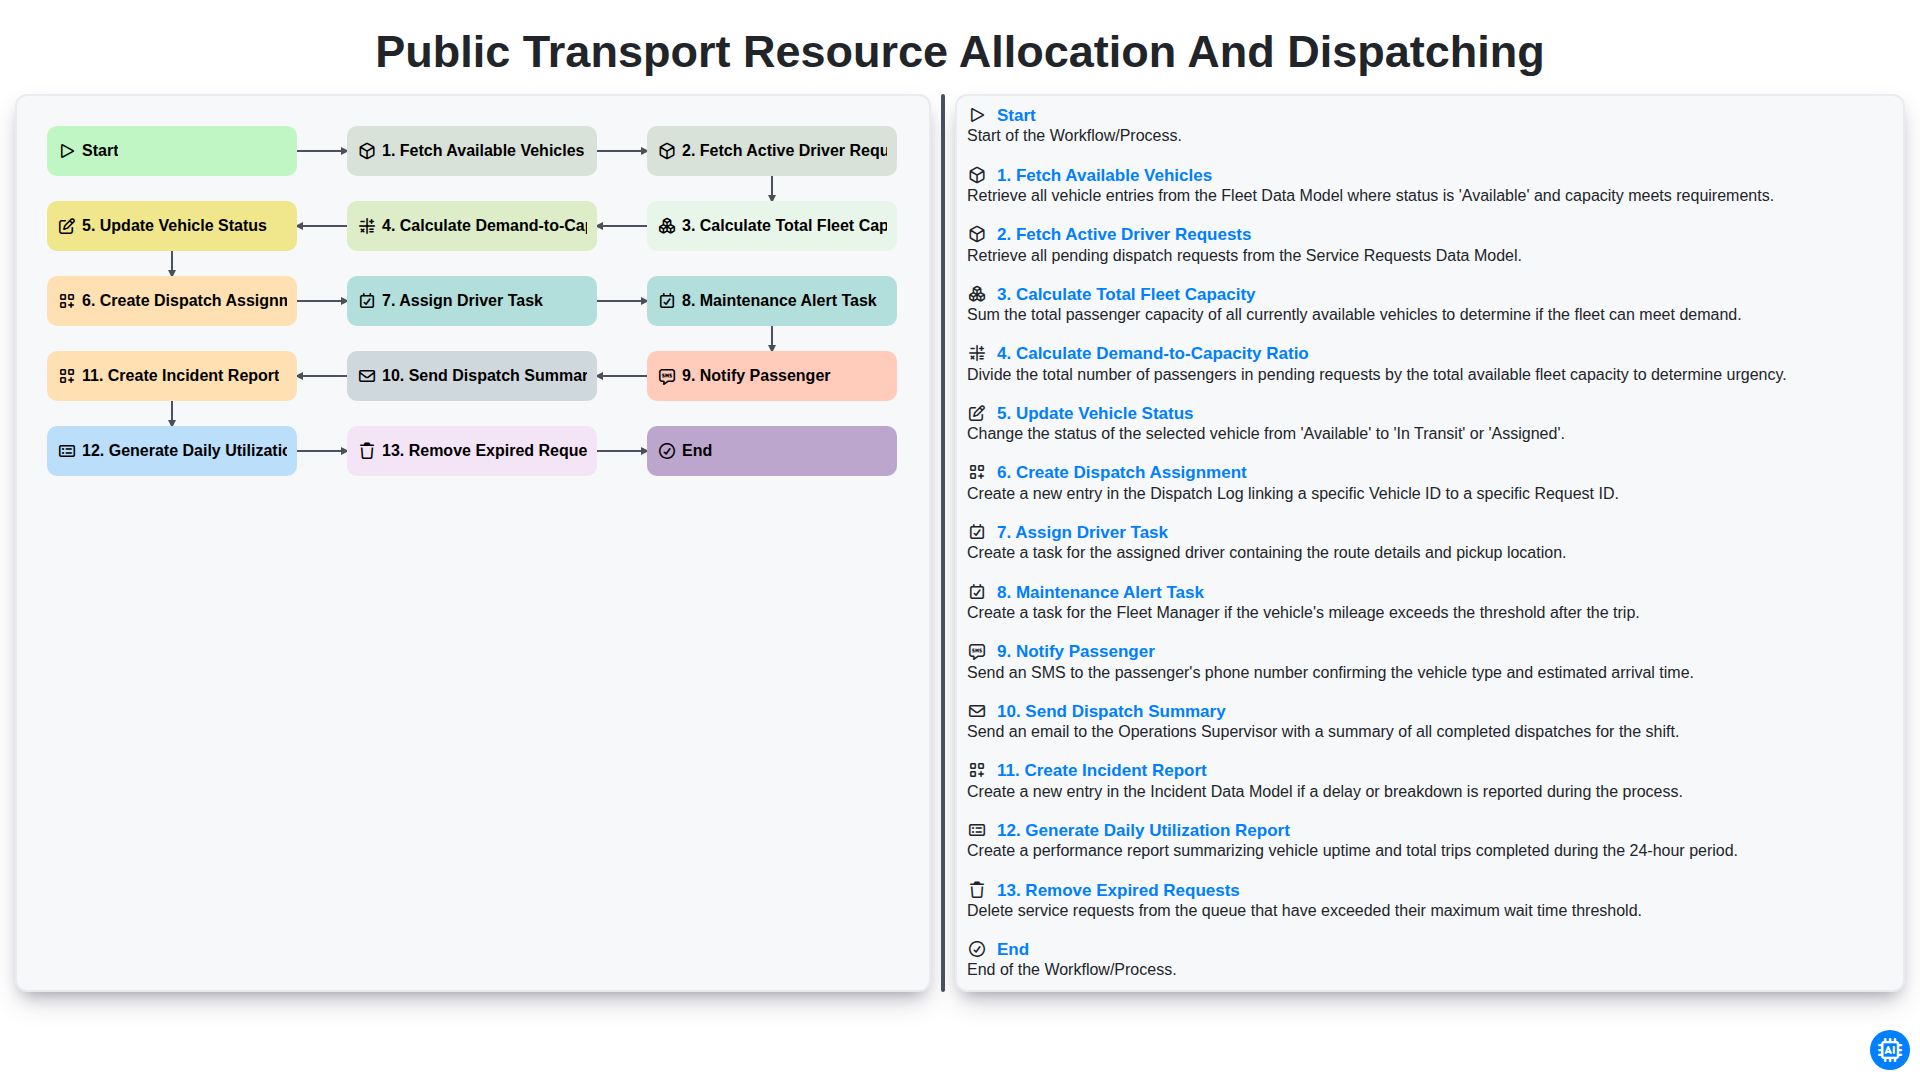
Public Transport Resource Allocation and Dispatching
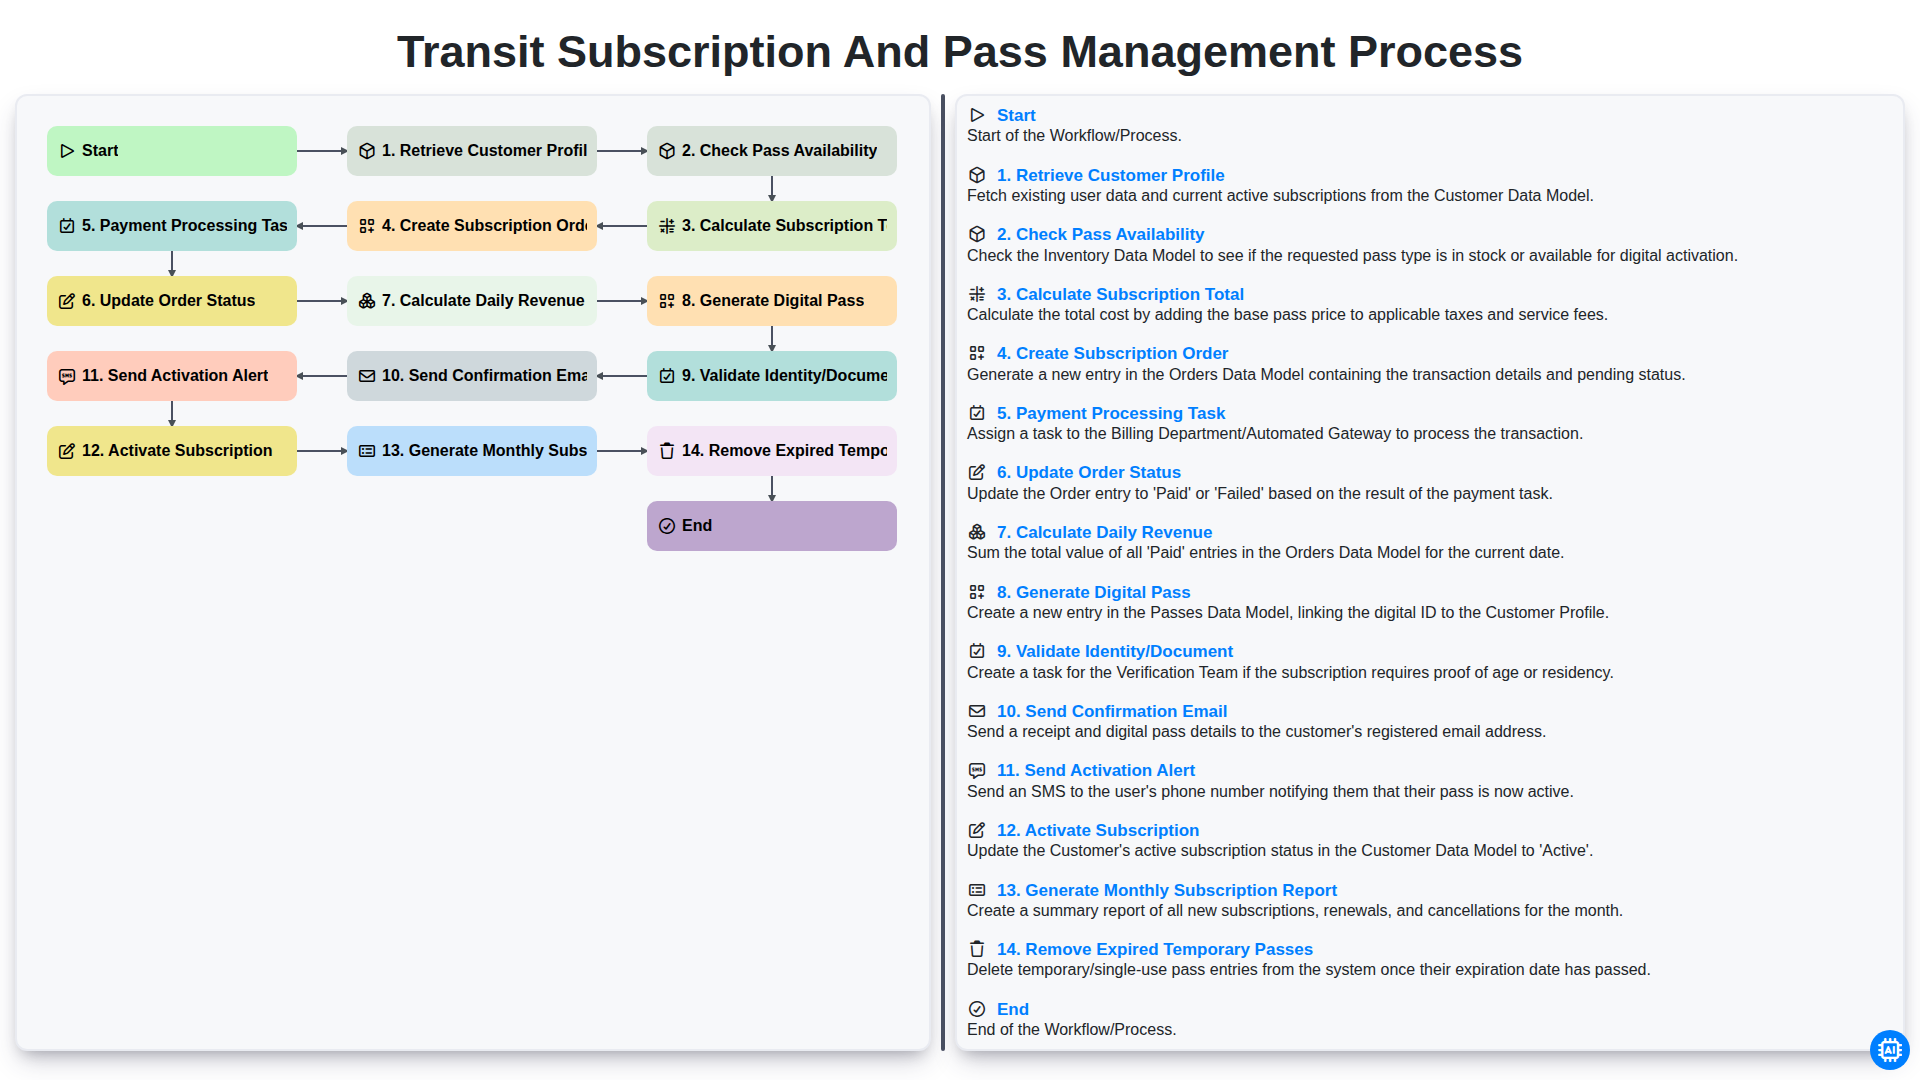
Transit Subscription and Pass Management Process
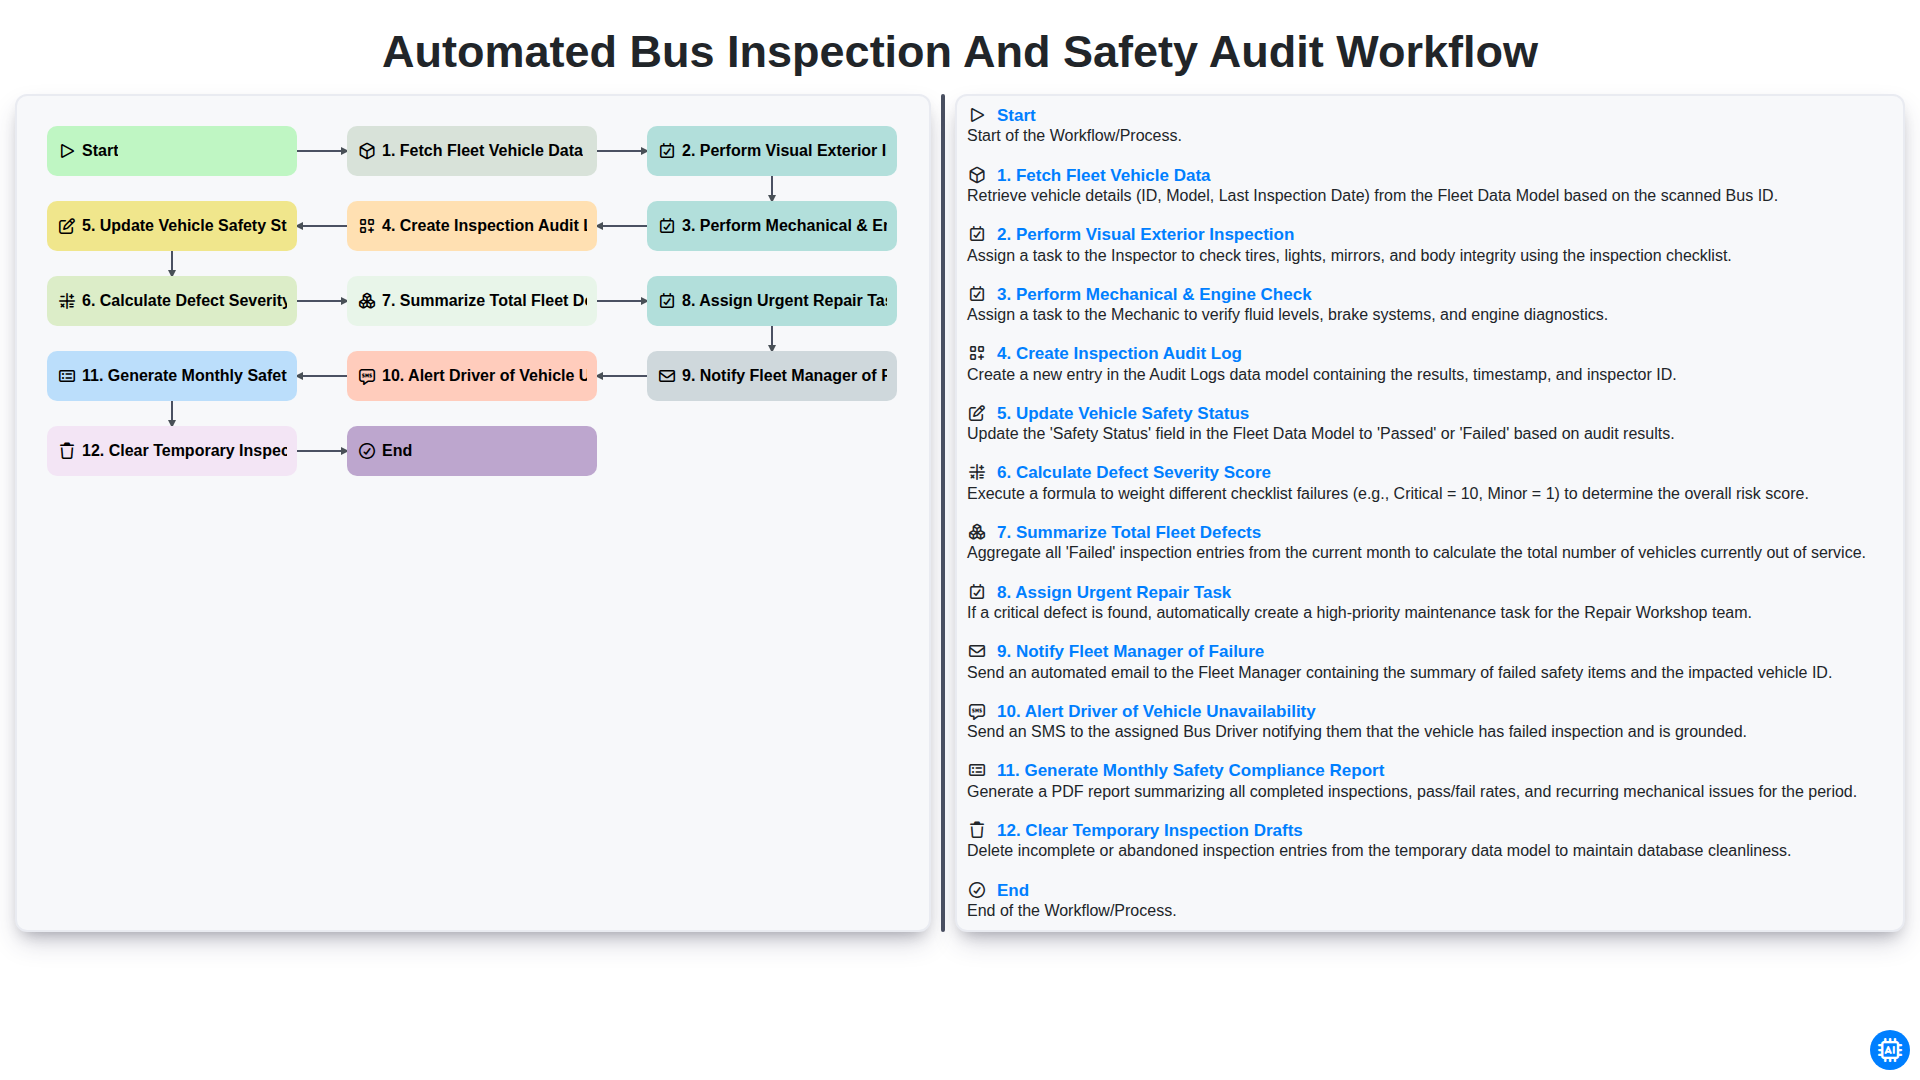
Automated Bus Inspection and Safety Audit Workflow
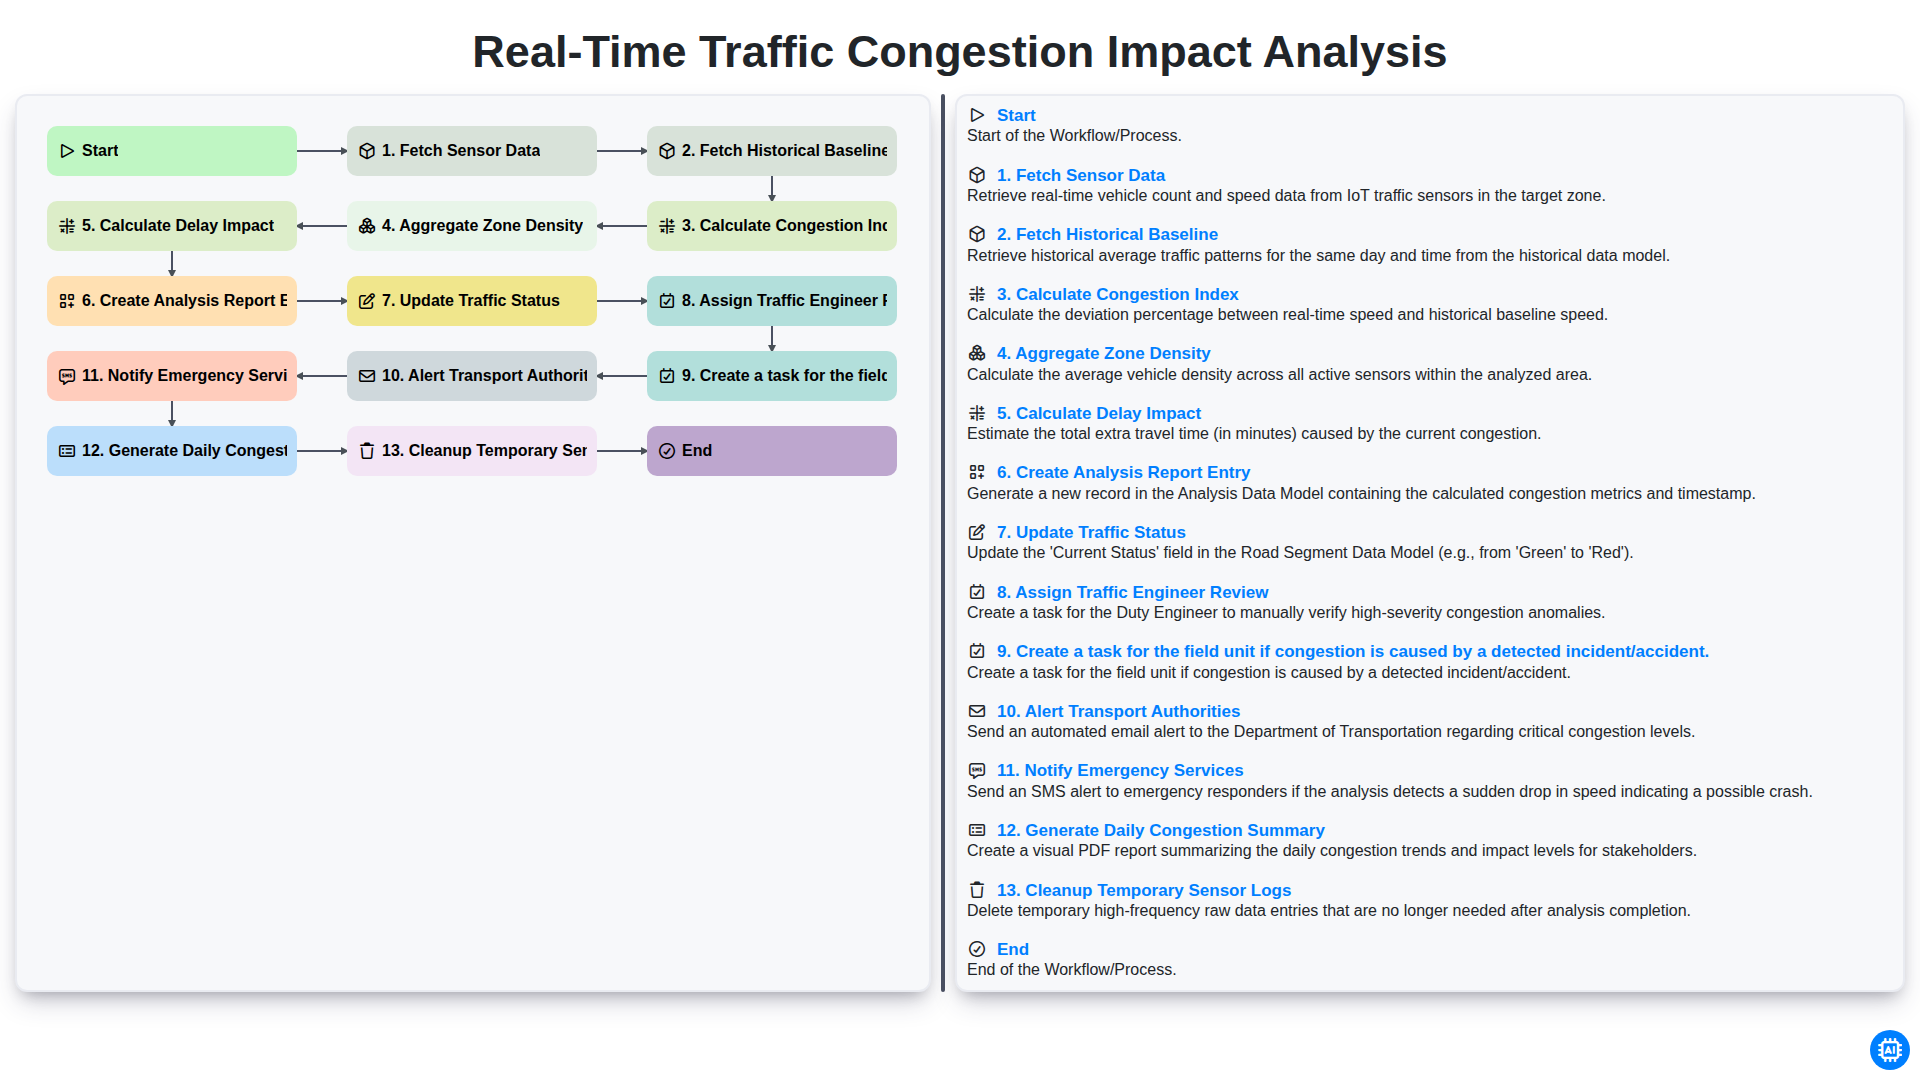
Real-Time Traffic Congestion Impact Analysis
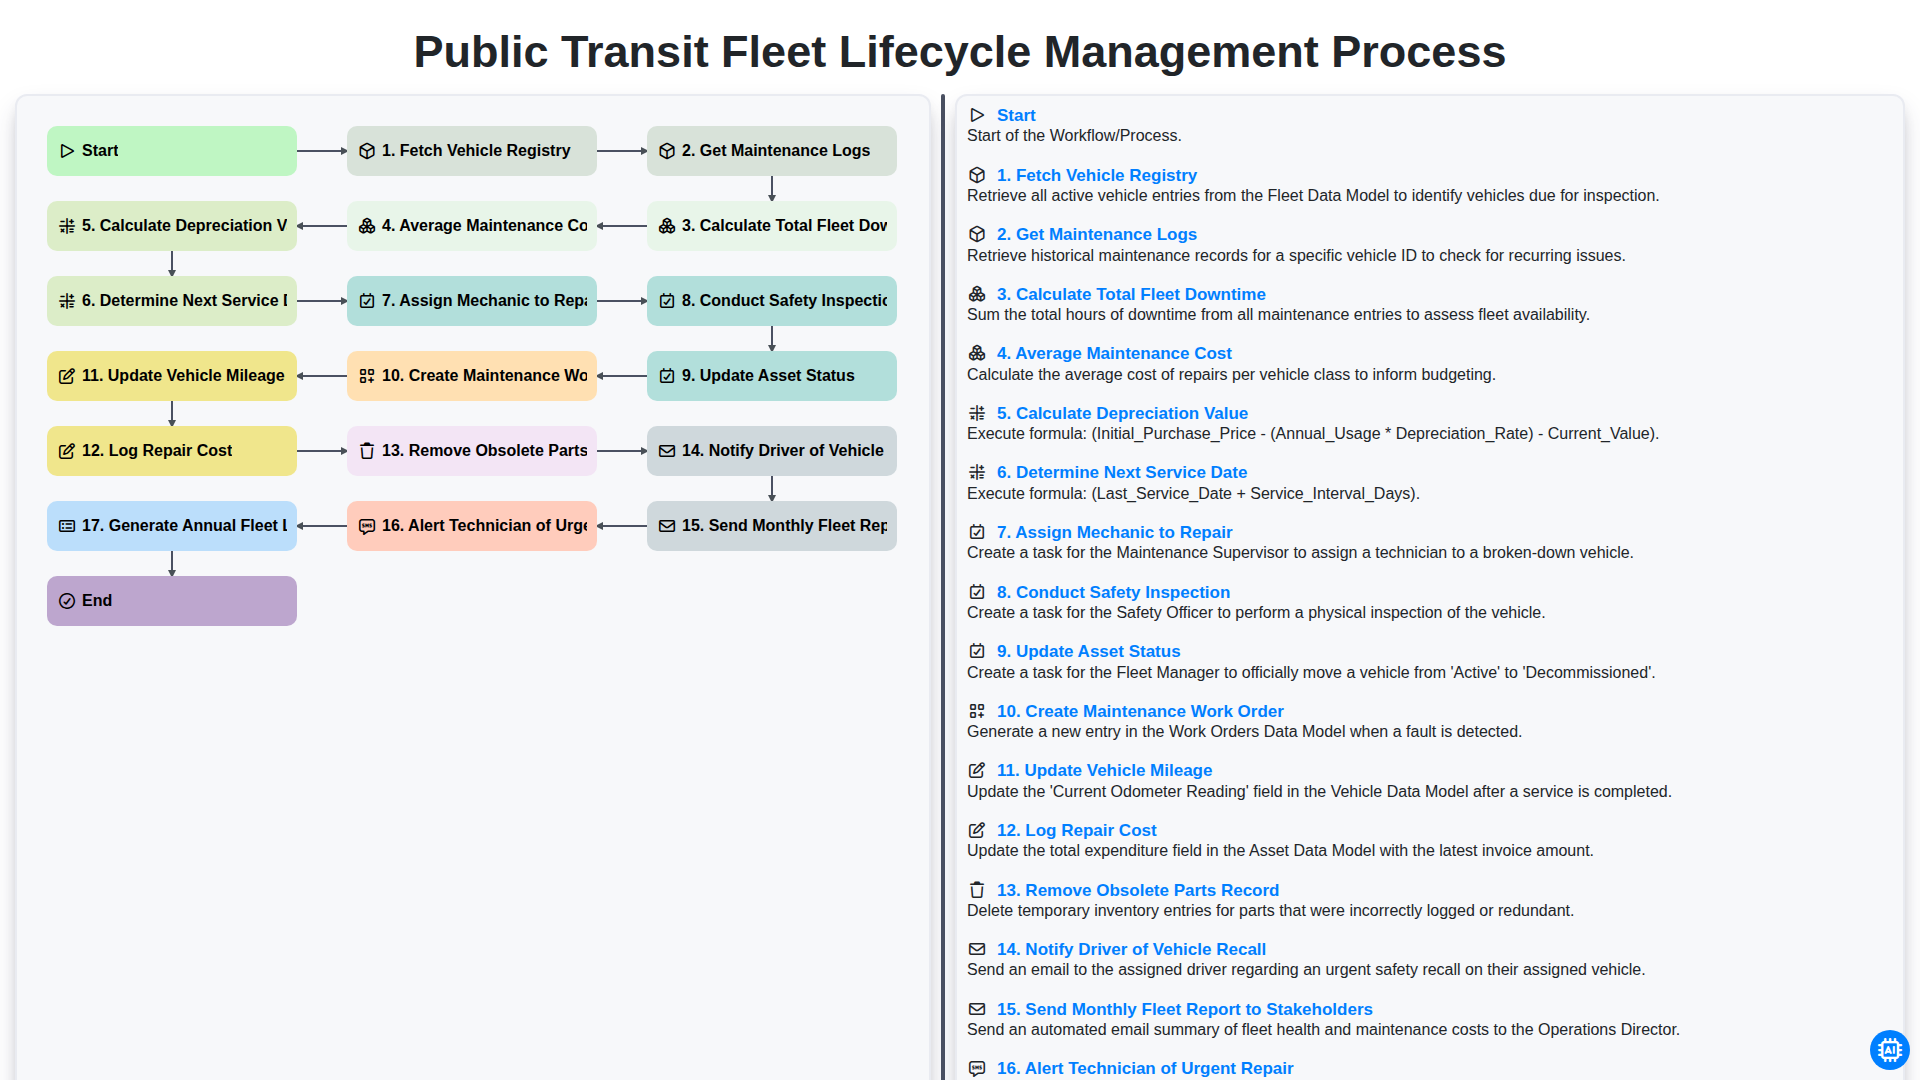
Public Transit Fleet Lifecycle Management Process
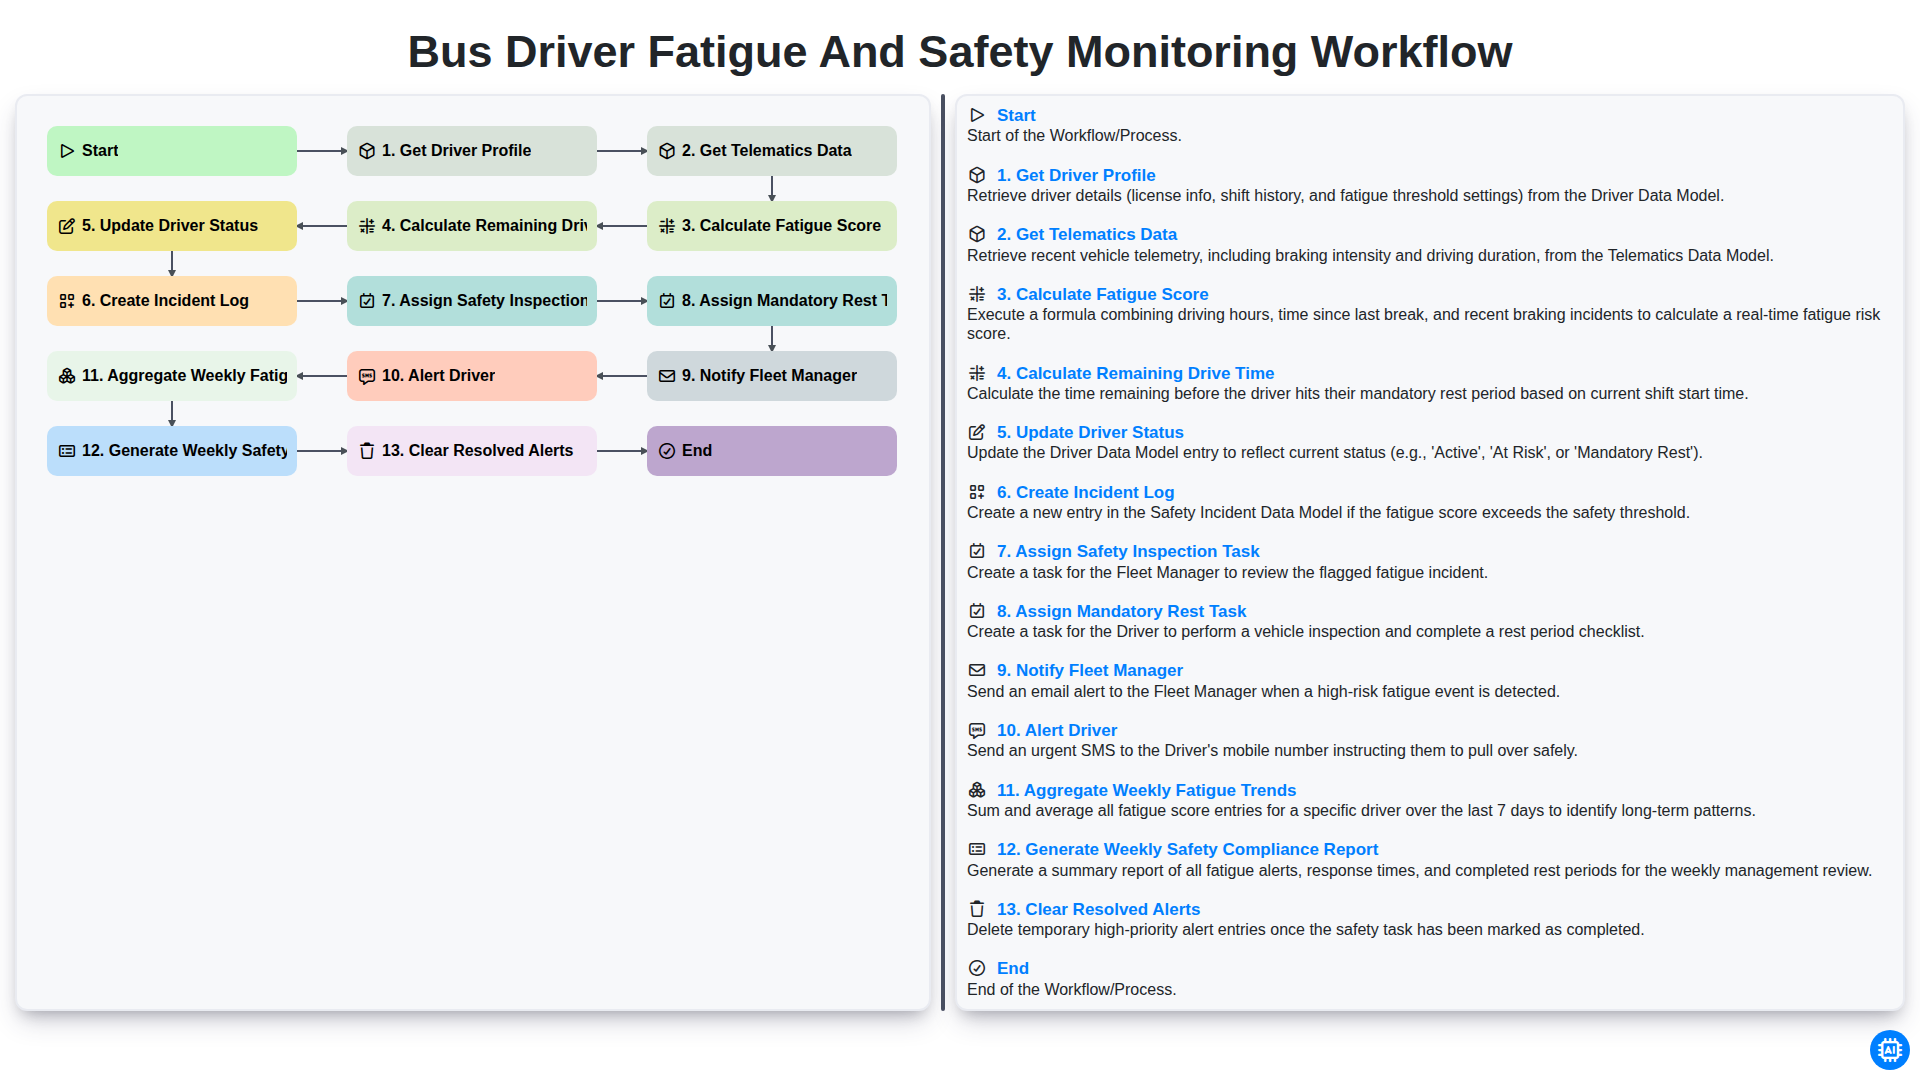
Bus Driver Fatigue and Safety Monitoring Workflow
Podemos fazer isso juntos.
Precisa de ajuda com o(a) Public Transport Management?
Tem alguma dúvida? Estamos aqui para ajudar. Envie a sua questão e responderemos o mais breve possível.