A3 Problem Solving Report Checklist Template: Your Guide to Lean Solutions
Published: 09/02/2025 Updated: 12/13/2025
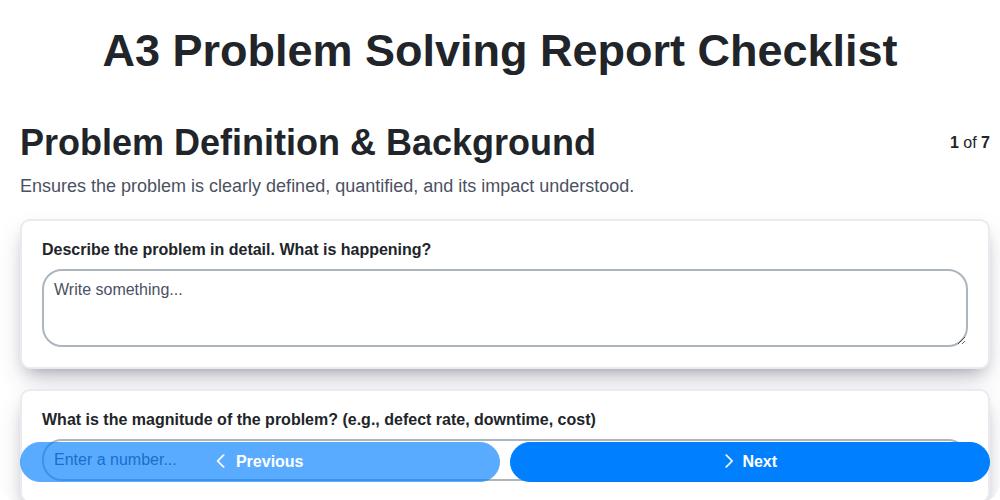
Table of Contents
- Unlocking Lean Solutions: Introducing the A3 Problem Solving Report
- What is an A3 Problem Solving Report? - A Quick Overview
- Why Use an A3 Report Checklist? - Ensuring Quality and Consistency
- The A3 Problem Solving Report Checklist Template - Your Step-by-Step Guide
- 1. Defining the Problem & Background - Setting the Stage
- 2. Analyzing the Current State: Root Cause Identification
- 3. Developing Proposed Countermeasures - Brainstorming Solutions
- 4. Crafting an Implementation Plan - Actionable Steps
- 5. Measuring Results & Verifying Effectiveness - Data-Driven Decisions
- 6. Documenting Lessons Learned & Standardizing Improvements
- 7. Ensuring Report Format & Clarity - A Visual Guide
- Common Pitfalls to Avoid When Using the A3 Template
- Leveraging the A3 Report for Continuous Improvement
- Downloadable A3 Problem Solving Report Checklist Template
- Resources & Links
TLDR: Struggling to tackle problems effectively? This checklist template breaks down the A3 problem-solving process into manageable steps, from defining the issue and finding the root cause to implementing solutions and standardizing best practices. Use it to create clear, visual reports that drive Lean improvements and keep everyone on track for success.
Unlocking Lean Solutions: Introducing the A3 Problem Solving Report
The A3 problem-solving report isn't just a document; it's a mindset. Rooted in Lean principles, it provides a structured, visual approach to tackling challenges and driving continuous improvement. Think of it as a condensed roadmap of your problem-solving journey, easily shared and understood across teams, regardless of their technical expertise.
Where traditional reports often bury critical details in dense paragraphs, the A3 report utilizes a single page (typically A3 size, roughly 11x17 inches) to distill the problem, analysis, proposed solutions, implementation plan, results, and lessons learned. This concise format encourages focused thinking, fosters collaboration, and ensures transparency throughout the entire process. It's a powerful tool for not just solving problems, but for learning from them and embedding those learnings into standard operating procedures. Ultimately, the A3 report helps organizations move beyond reactive problem-solving and cultivate a proactive, continuous improvement culture.
What is an A3 Problem Solving Report? - A Quick Overview
The A3 isn't just about the paper size-although the standardized A3 format (roughly 11x17 inches) certainly helps with visual organization. Think of it as a visual narrative of your problem-solving journey. It's a concise, one-page report that walks readers through the entire process, from identifying the problem to standardizing the solution.
At its core, an A3 aims to foster collaboration and transparency. It's designed to be easily understood by everyone involved, regardless of their technical expertise. This ensures everyone is on the same page, understands the challenges, the proposed solutions, and the results achieved. It's a powerful tool for driving continuous improvement, preventing recurring issues, and sharing knowledge across the organization - all within a single, manageable document.
Why Use an A3 Report Checklist? - Ensuring Quality and Consistency
An A3 report isn't just about following a template; it's about embedding a structured problem-solving approach. Without a checklist, reports can easily become inconsistent, missing crucial information, or lacking a clear narrative. This inconsistency hinders collaboration - imagine trying to learn from a report that glosses over the root cause analysis or lacks a defined implementation plan!
Using a checklist ensures that every A3 report, regardless of who creates it, follows a standardized process, covering all vital elements. This leads to:
- Improved Quality: Minimizes the risk of overlooking critical steps and data.
- Increased Consistency: Creates a uniform format for easy understanding and comparison across reports.
- Reduced Errors: Acts as a safeguard against common omissions or mistakes.
- Enhanced Learning: Facilitates effective knowledge sharing and continuous improvement by providing a reliable foundation for analysis.
- Streamlined Review Process: Simplifies the review process for managers and stakeholders, ensuring reports are comprehensive and actionable.
Ultimately, an A3 report checklist isn't a constraint-it's a tool for elevating the quality and consistency of your problem-solving efforts and ensuring maximum impact from your A3 initiatives.
The A3 Problem Solving Report Checklist Template - Your Step-by-Step Guide
Creating an A3 report from scratch can feel daunting. That's why we've developed a comprehensive, ready-to-use template designed to streamline your problem-solving process and ensure consistent quality. This template isn't just a static document; it's a dynamic framework that guides your thinking and encourages thoroughness.
Think of it as your personal A3 coach, prompting you with key questions and sections to address at each stage. It breaks down the complex process into manageable steps, providing clear prompts and suggested elements for each section outlined in the checklist (Problem Definition, Root Cause Analysis, Countermeasures, Implementation, Results, and Lessons Learned).
What's Included in the Template?
- Pre-formatted Sections: Professionally designed sections mirroring the standard A3 structure, ready for your data and insights.
- Guided Prompts: Thought-provoking prompts within each section to ensure a complete and insightful analysis. For example, under Root Cause Analysis, you'll find prompts like What are the contributing factors? and Can we use the 5 Whys to dig deeper?
- Visual Aid Suggestions: Notes indicating where graphs, charts, and other visuals will be most impactful.
- Example Data Fields: Placeholder data fields to illustrate how information should be presented.
- Downloadable and Editable: Easily download the template in PDF, EXCEL, CSV customize it to fit your specific needs.
How to Use the Template:
- Download & Open the Template
- Problem Identification: Begin with the Problem Definition section, clearly defining the issue and its impact.
- Root Cause Analysis: Methodically investigate the root cause using techniques like the 5 Whys or Ishikawa diagrams (fishbone diagram).
- Develop & Implement Solutions: Outline proposed countermeasures, assign responsibilities, and establish timelines.
- Measure & Evaluate: Track results, compare data, and assess the effectiveness of your solutions.
- Document & Share: Capture lessons learned, standardize best practices, and share your findings with the team.
Unlock the Power of Structured Problem Solving!
1. Defining the Problem & Background - Setting the Stage
Before diving into solutions, it's crucial to lay a solid foundation. A poorly defined problem can lead to wasted effort and ineffective countermeasures. This section isn't just about stating what went wrong; it's about understanding why it matters.
Start by clearly articulating the problem in a concise and objective statement. Avoid vague language and subjective opinions. Instead of saying "Customer satisfaction is low," try "Customer return rate increased by 15% in Q3, impacting revenue by X amount." Quantifiable data, whenever possible, makes the problem tangible and provides a benchmark for measuring success.
Next, provide context. Briefly describe the background surrounding the problem. What events or circumstances led to this situation? Is this a recurring issue, or a new development? Understanding the history can reveal underlying causes and prevent similar problems in the future. For example, a sudden increase in returns might be linked to a recent change in product packaging or a new competitor entering the market.
Finally, explain why solving this problem is important. What impact is it having on the organization, customers, or stakeholders? Highlighting the consequences emphasizes the urgency and motivates the team to find a resolution. This isn't just about fixing a defect; it's about protecting revenue, maintaining customer loyalty, or safeguarding the company's reputation. A clear problem definition, coupled with a thorough understanding of the background and consequences, sets the stage for a successful problem-solving journey.
2. Analyzing the Current State: Root Cause Identification
Simply addressing the surface-level effects of a problem is like applying a bandage to a broken leg - it might temporarily mask the discomfort, but it won't heal the underlying injury. Identifying the root cause is the key to sustainable solutions. This is where diligent analysis becomes essential.
Don't settle for simply understanding what is happening; strive to understand why it's happening. Common pitfalls include focusing on symptoms rather than digging deeper, or jumping to conclusions without sufficient data.
Several established methodologies can guide your root cause analysis. The 5 Whys technique involves repeatedly asking Why? to progressively uncover the fundamental reason behind a problem. For instance, Why are orders delayed? - Because the packaging process is slow - Why is the packaging process slow? - and so on.
Another valuable tool is the Fishbone Diagram (also known as Ishikawa Diagram or Cause-and-Effect Diagram). This visual framework helps you brainstorm and categorize potential causes across various categories, like People, Process, Equipment, Materials, Environment, and Management. It provides a structured way to explore all possible contributing factors.
Finally, the 5 Gen Why technique will help the team to determine the real causes.
Regardless of the method you choose, remember to validate your findings with data. Don't rely solely on anecdotal evidence; seek concrete evidence to support your conclusions. The goal is to pinpoint the one or two critical root causes that, if addressed, will eliminate the problem permanently.
3. Developing Proposed Countermeasures - Brainstorming Solutions
Generating effective countermeasures starts with a robust brainstorming session. The goal here isn't to immediately identify the perfect solution, but to generate a wide range of possibilities - even those that initially seem unconventional. Don't self-censor! The more ideas you have, the greater the chance of finding a truly innovative and impactful approach.
Here are a few techniques to fuel your brainstorming:
- Quantity over Quality (Initially): Encourage everyone to contribute, no matter how outlandish the idea might seem. Focus on generating a high volume of suggestions first.
- Yes, and... Approach: Build on each other's ideas. Instead of dismissing suggestions, acknowledge them and add to them. This fosters a positive and collaborative environment.
- Reverse Brainstorming: Focus on how you could worsen the problem. This surprisingly often highlights potential solutions by showing what not to do.
- SCAMPER: A checklist that prompts you to Substitute, Combine, Adapt, Modify, Put to other uses, Eliminate, and Reverse aspects of the current process or solution.
- Five Whys: Repeatedly asking Why? to drill down to the root causes, which can spark new solution ideas.
Remember to document all ideas, even those that are initially rejected. They might prove useful later or inspire a more refined solution. A truly effective countermeasure often emerges from a combination of seemingly disparate ideas.
4. Crafting an Implementation Plan - Actionable Steps
The proposed countermeasures are fantastic on paper, but their true value lies in effective implementation. A well-crafted implementation plan transforms ideas into tangible results. This isn't just about listing tasks; it's about creating a roadmap for success. Here's how to build an implementation plan that actually works:
1. Break Down the Countermeasures: Don't treat each countermeasure as a single, monolithic task. Deconstruct them into smaller, manageable steps. For example, if a countermeasure is "Implement new employee training," break it down into: "Develop training materials," "Schedule training sessions," "Train trainers," "Deliver training to employees," and Gather feedback on training effectiveness.
2. Assign Ownership & Accountability: Crucially, every action needs a responsible party. Clearly assign ownership of each step to a specific individual or team. This isn't just about delegation; it's about accountability. Use phrases like John will be responsible for... or The Marketing team will own... to make ownership explicit.
3. Establish Realistic Timelines: Overly ambitious timelines doom projects to failure. Engage with the individuals responsible for each task to estimate the time required. Build in buffer time to account for unexpected delays. Use a project management tool or a simple spreadsheet to track progress and deadlines.
4. Define Required Resources: What resources will be needed to execute the plan? This includes personnel, budget, equipment, training, and any external support. Identifying resource needs upfront prevents bottlenecks and delays later on.
5. Prioritize Tasks: Not all steps are created equal. Prioritize tasks based on their impact and urgency. Consider using a prioritization matrix (like an Eisenhower Matrix: Urgent/Important) to guide your decisions.
6. Communication is Key: Keep stakeholders informed of progress, challenges, and any necessary adjustments to the plan. Regular communication builds buy-in and prevents misunderstandings. Consider weekly brief update meetings or a shared online dashboard.
7. Track Progress and Adapt: Regularly monitor progress against the plan. Use key performance indicators (KPIs) to measure success. Be prepared to adapt the plan as needed based on feedback and evolving circumstances. Don't be afraid to pivot if something isn't working.
5. Measuring Results & Verifying Effectiveness - Data-Driven Decisions
Verifying the effectiveness of your countermeasures isn't about guesswork; it's about solid, measurable data. Before implementing your solutions, establish a clear baseline - a snapshot of the 'before' situation. This could be a specific metric like customer satisfaction scores, defect rates, or process cycle time. Document this baseline data meticulously; it's your point of comparison.
Following implementation, consistently collect data using the same methods and timeframe. Don't cherry-pick results; honesty and transparency are critical for true verification. Create visualizations - graphs, charts, Pareto diagrams - to clearly demonstrate the changes. Compare the 'after' data directly with the baseline. Did the data move in the direction you expected? Was the change statistically significant?
It's not enough to simply observe a positive trend. Rigorously analyze the data. Use appropriate statistical tools if possible (e.g., control charts, t-tests) to determine if the observed change is attributable to your countermeasures, or simply due to random variation. Document your analysis and any limitations. A robust verification process builds confidence in your solutions and provides valuable insights for future improvement efforts. Remember, data isn't just about proving your solution worked; it's about learning what worked and why.
6. Documenting Lessons Learned & Standardizing Improvements
The true power of an A3 report isn've just in solving the immediate problem; it lies in the lasting impact. Documenting what you learned - both successes and failures - transforms a reactive fix into a proactive improvement. This isn't about assigning blame; it's about honest reflection and continuous growth.
Begin by summarizing the key takeaways from the entire problem-solving journey. What worked exceptionally well? What aspects could have been handled differently? Were there unexpected challenges or opportunities? Be specific - "communication improved" isn't helpful; "daily stand-up meetings significantly enhanced team collaboration and reduced misunderstandings" is.
Next, translate those learnings into standardized practices. If a particular root cause analysis technique proved invaluable, incorporate it into your team's toolkit. If a revised process demonstrably reduced errors, update your standard operating procedures (SOPs) to reflect those changes. Clearly outline the new procedures, assigning responsibility for their implementation and ongoing adherence.
Finally, share these documented lessons and standardized practices across the organization. A central knowledge repository, team presentations, or even brief training sessions can ensure that everyone benefits from your hard-earned experience. By openly sharing what you've learned, you foster a culture of continuous improvement and prevent similar problems from recurring in other areas of the business. Remember, an A3 isn't just a report; it's a stepping stone to a more efficient and effective future.
7. Ensuring Report Format & Clarity - A Visual Guide
An A3 report isn't just about the what of the problem and solution; it's about how effectively that information is conveyed. A cluttered or confusing report defeats the purpose - it's meant to be a shared understanding, not a source of frustration. Here's how to ensure your A3 report is visually clear and impactful:
- Strategic Use of White Space: Don't be afraid of blank space! It allows the eye to rest and highlights key information. Avoid cramming elements together.
- Clear Headings and Subheadings: Use a consistent hierarchy to guide the reader through the report. Bold font or larger font sizes can help emphasize key sections.
- Visual Aids - Charts & Graphs: Replace dense blocks of text with visual representations of data whenever possible. Line graphs, bar charts, and pie charts are powerful tools for illustrating trends and comparisons. Always include clear labels and legends.
- Color Palette: Use a limited and consistent color palette to create a professional and cohesive look. Avoid overly bright or distracting colors. Use color strategically to highlight important data or action items.
- Arrows & Flowcharts: When outlining processes or demonstrating cause-and-effect relationships, use arrows and flowcharts to create a logical visual flow.
- Font Choice: Select a readable font (or two) and stick with it throughout the report. Avoid overly decorative or script fonts.
- Consistency is King: Ensure consistency in font sizes, spacing, and visual styling throughout the entire report. This creates a polished and professional appearance.
Remember, the goal is to make the information accessible and understandable at a glance. A well-formatted A3 report should tell a story - and that story should be clear, concise, and compelling.
Common Pitfalls to Avoid When Using the A3 Template
The A3 template is a powerful tool, but it's not a magic bullet. Even with the best intentions, several common pitfalls can derail your problem-solving efforts. Recognizing and avoiding these is key to harnessing the full potential of the A3.
1. Jumping to Solutions Too Quickly: The urge to immediately fix the problem is understandable, but skipping the thorough analysis phase (particularly root cause identification) is a frequent error. A hasty solution often addresses only the symptom, leading to recurring issues. Take the time to truly understand the "why" behind the problem.
2. Lack of Visuals: A wall of text is a surefire way to lose your audience. A3 reports thrive on clear, impactful visuals. Don't underestimate the power of graphs, charts, and simple diagrams to communicate data and insights effectively. If a picture tells a thousand words, use plenty of pictures.
3. Blaming Instead of Focusing on Systemic Issues: An A3 should be a blameless investigation. While individuals are responsible for actions, the focus should always be on identifying process failures or systemic issues that contributed to the problem. Look for the process breakdown, not just the person who made a mistake.
4. Ignoring the Lessons Learned Section: This is arguably the most crucial part of the A3. Simply solving the problem isn't enough; you need to capture the learnings to prevent recurrence and improve future problem-solving. Don't let this section be an afterthought - make it a priority.
5. Failing to Assign Ownership & Follow-Up: A beautifully crafted A3 is useless if the action items aren't implemented. Clearly assigning ownership and establishing a timeline for follow-up is essential to ensure accountability and results. Make sure someone is responsible for driving the solution to completion.
6. Getting Lost in Detail: The A3 template is a guide, not a rigid set of rules. Tailor the level of detail to the complexity of the problem and the needs of the audience. Avoid overwhelming readers with unnecessary information. Keep it concise and focused on the essential elements.
Leveraging the A3 Report for Continuous Improvement
The true power of the A3 report isn't just in solving a single problem; it's in establishing a framework for continuous improvement. Think of each report as a building block. By systematically documenting the problem, your analysis, the solutions implemented, and the results achieved, you create a valuable record that can be revisited and leveraged for future initiatives.
Here's how the A3 actively fuels continuous improvement:
- Knowledge Sharing & Training: A3 reports become a readily accessible training resource for new team members, demonstrating effective problem-solving methodologies. They showcase real-world examples of challenges, analyses, and solutions.
- Identifying Systemic Issues: Patterns often emerge when reviewing multiple A3 reports. Recurring problems or weaknesses in processes become apparent, highlighting areas needing broader systemic changes.
- Benchmarking & Best Practices: Comparing different A3 reports allows teams to identify and share best practices, fostering a culture of learning and adaptation across the organization. What worked well for Team A in solving this challenge?
- Preventing Re-emergence: By incorporating preventative measures and standardizing best practices as documented in the Lessons Learned section, you significantly reduce the likelihood of the initial problem resurfacing. This proactive approach strengthens the entire system.
- Data-Driven Decision Making: The rigorous data collection and analysis detailed in the A3 provides concrete evidence to inform future strategic decisions, shifting away from gut feelings and towards informed action.
Essentially, the A3 is more than just a solution document; it's a living artifact of your organization's learning journey.
Downloadable A3 Problem Solving Report Checklist Template
Ready to streamline your A3 problem-solving process? We've created a fully customizable, downloadable checklist template to help you ensure every report is complete, consistent, and actionable.
This template mirrors the comprehensive checklist outlined in this article, providing a handy reference guide to keep you on track from problem definition to lessons learned. Simply download, fill in, and share your findings with confidence.
What's included:
- A structured checklist covering all key sections of an A3 report.
- Space for notes, data, and action items.
- A ready-to-use framework for consistent reporting.
Resources & Links
- Lean Enterprise Institute (LEI) : A leading source for information and training on Lean thinking and the A3 problem-solving approach. They offer articles, case studies, and resources to help implement Lean principles and improve problem-solving processes. Excellent for foundational knowledge.
- Society for Healthcare Improvement (SHM) : While focused on healthcare, SHM provides a wealth of information, examples, and downloadable A3 report templates suitable for adapting to various industries. Demonstrates practical applications and provides structured guidance.
- Kaizen Institute : A global consulting firm specializing in Lean and Six Sigma. Their website provides articles, webinars, and training courses that cover A3 problem-solving in detail, with a focus on practical implementation and continuous improvement.
- American Society for Quality (ASQ) : ASQ provides a wide range of quality resources, including articles, training, and standards related to problem-solving methodologies like A3. They offer a comprehensive view of quality management principles.
- Six Sigma : Although not solely focused on A3, Six Sigma principles often intertwine with A3 problem-solving. This website provides introductory resources and links to concepts useful for root cause analysis and data-driven decision making.
- Visual Management Tools : Provides numerous visual templates and resources, which can greatly assist in creating effective A3 reports. This website is helpful for clarifying steps and presenting information concisely, a critical aspect of an A3.
- MindTools : Offers a collection of management tools and techniques, including problem-solving methodologies. While not exclusively about A3, it covers important concepts like brainstorming and root cause analysis which are integral to the A3 process.
- TPM (Total Productive Maintenance) Institute : While focused on maintenance, TPM incorporates problem-solving and continuous improvement. Understanding TPM principles can enhance the implementation and effectiveness of A3 reports within an operational context.
- The 5S : A guide to understanding and implementing the 5S methodology, which is a key enabler for creating a visually organized and efficient workspace - conducive to A3 reporting and problem-solving.
- Project Management Institute (PMI) : While primarily focused on project management, the fundamental principles of planning, execution, and monitoring are relevant to implementing countermeasures from an A3 report. PMI offers resources and certifications in this area.
Frequently Asked Questions
What is an A3 Problem Solving Report?
An A3 report is a structured, one-page (standard A3 paper size) document used to visually represent a problem-solving process. It's a key tool in Lean methodologies, facilitating clear communication, collaboration, and a systematic approach to identifying root causes and implementing solutions.
Why use an A3 Problem Solving Report Checklist Template?
The checklist template ensures you cover all the necessary steps and sections in a consistent, standardized format. It prevents overlooking crucial details, promotes completeness, and streamlines the problem-solving process, ultimately leading to more effective solutions.
Who should use the A3 Problem Solving Report Checklist Template?
It's suitable for anyone involved in problem-solving, including process engineers, team leaders, quality control specialists, operators, and anyone seeking a structured approach to root cause analysis and improvement.
What are the typical sections included in an A3 Problem Solving Report?
Common sections include: Problem Definition, Current State Analysis (data, charts, graphs), Root Cause Analysis (e.g., 5 Whys, Fishbone Diagram), Proposed Solution, Implementation Plan, Results & Countermeasures, Lessons Learned, and Action Items.
Can I modify the A3 Problem Solving Report Checklist Template?
Yes! The template is designed to be flexible. Feel free to add, remove, or adjust sections based on the specific problem and your organization's needs. The checklist is a guide, not a rigid requirement.
What is 'Lean' and how does the A3 Report relate to it?
Lean is a methodology focused on maximizing value while minimizing waste. A3 reports are a core Lean tool for visually communicating and managing problem-solving initiatives, aligning with Lean principles of continuous improvement and eliminating inefficiencies.
What is a Fishbone Diagram (also known as Ishikawa Diagram)?
A Fishbone Diagram is a visual tool used in root cause analysis. It helps brainstorm potential causes of a problem by categorizing them into major areas (e.g., Manpower, Methods, Materials, Machines, Measurement, Environment). It's often used within the 'Root Cause Analysis' section of an A3 report.
How should I present data in my A3 Report?
Use clear and concise charts, graphs, and tables to visually represent data. Ensure labels are clear and easy to understand. Focus on presenting the data in a way that highlights trends and supports your analysis.
What is the importance of 'Lessons Learned' in an A3 Report?
The 'Lessons Learned' section captures insights gained from the problem-solving process. This is crucial for continuous improvement, preventing similar issues in the future, and sharing knowledge across the team or organization.
Where can I find examples of completed A3 Problem Solving Reports?
Many online resources and Lean/Six Sigma training programs offer examples of A3 reports. Searching online for 'A3 report examples' or consulting with experienced Lean practitioners can provide valuable insights.
Found this Article helpful?
Manufacturing Management Solution Demo
Stop chasing paperwork and wrestling with disconnected systems! Our solution brings clarity and control to your production process. From standard operating procedures (SOPs) and equipment maintenance to quality control and inventory tracking, we simplify every step.
Related Articles
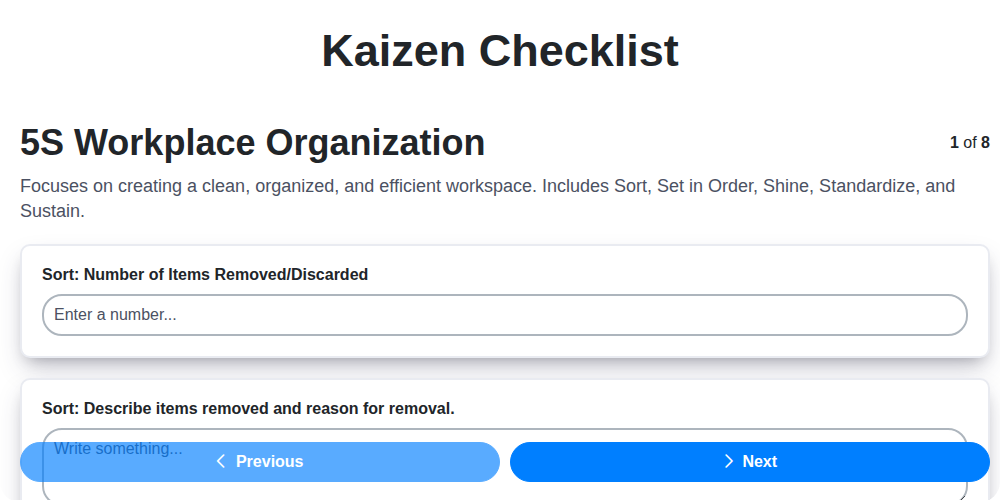
Kaizen Checklist Template: Your Path to Continuous Improvement

Machine Safety Audit Checklist: Your Guide to a Safer Manufacturing Workplace
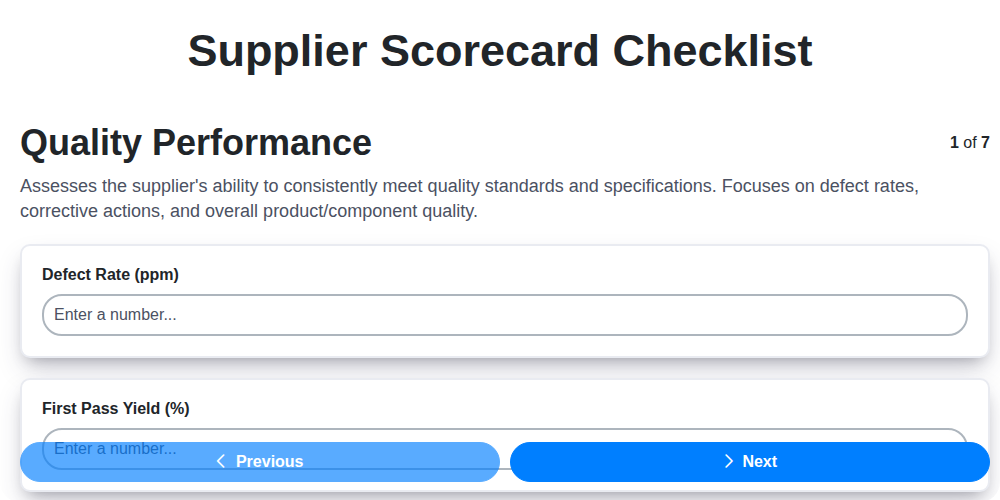
Mastering Supplier Performance: Your Free Supplier Scorecard Checklist Template
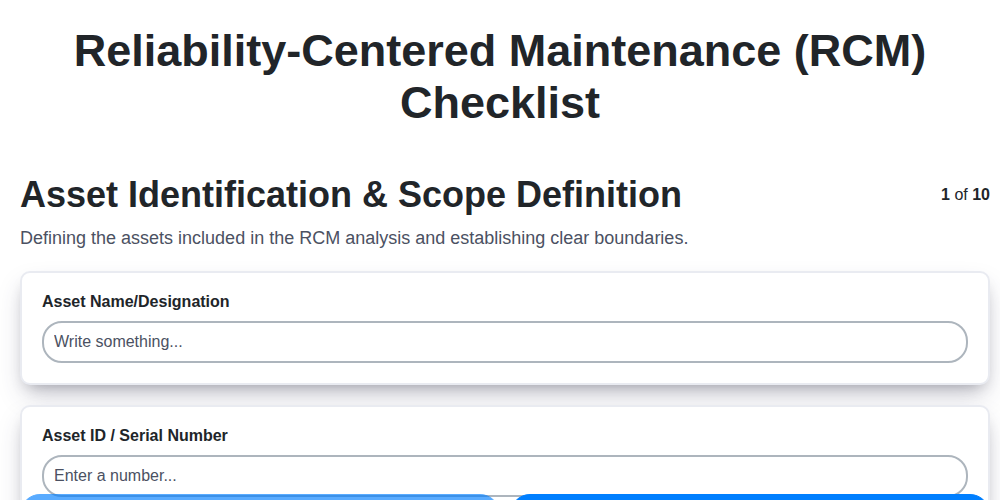
Your Ultimate RCM Checklist Template: A Step-by-Step Guide

LPA Checklist Template: Your Guide to Layered Process Audits

Your Ultimate Lockout/Tagout (LOTO) Checklist Template

Your Ultimate FSC 22000 Checklist Template
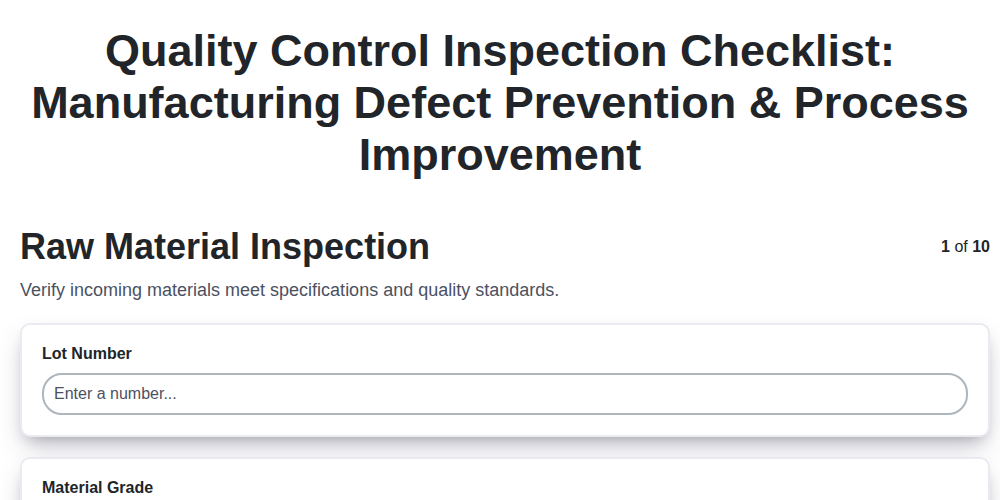
Quality Control Inspection Checklist Template: Prevent Defects & Improve Manufacturing Processes
We can do it Together
Need help with
Manufacturing?
Have a question? We're here to help. Please submit your inquiry, and we'll respond promptly.