The Ultimate EHI Review Checklist Template: A Guide to Asset Health
Published: 09/01/2025 Updated: 12/13/2025

Table of Contents
- Why Your EHI Review Needs a Template
- Understanding the Key Components of an EHI
- Performance & Trending Analysis
- Condition Monitoring Data Review
- Vibration Analysis Checklist
- Oil Analysis Checklist
- Alarm & Maintenance History Verification
- Action Item Tracking & Future Planning
- Resources & Links
TLDR: Struggling to get the most out of your Equipment Health Index (EHI)? This free checklist template guides you through key areas like vibration analysis, oil analysis, and infrared scanning to proactively identify and address asset health issues, preventing costly downtime and maximizing equipment performance. Download the template and start optimizing your maintenance strategy today!
Why Your EHI Review Needs a Template
Creating an EHI review from scratch every time? That's a recipe for inconsistency, missed details, and ultimately, less effective insights. A template provides a structured framework, ensuring that every review covers the essential areas and follows a repeatable process. Think of it as a checklist for your checklist.
Here's why a template isn't just helpful; it's necessary:
- Consistency: Guarantee a standardized review process across all assets, regardless of who's conducting it.
- Efficiency: Save time and effort by eliminating the need to reinvent the wheel each review cycle.
- Reduced Errors: Minimize the risk of overlooking crucial data points or neglecting important analysis steps.
- Training Aid: Provide a clear and concise guide for new team members or those unfamiliar with the EHI review process.
- Improved Documentation: Facilitate thorough and well-organized record-keeping for future reference and audits.
- Continuous Improvement: Provide a baseline to benchmark performance and identify areas for optimization in your condition monitoring program.
A good template shouldn't be rigid, but rather a flexible starting point that can be customized to reflect your specific equipment and operational context.
Understanding the Key Components of an EHI
An Equipment Health Index (EHI) isn't just a single number; it's a carefully constructed composite of data from various condition monitoring techniques. Understanding the individual components that contribute to your EHI is critical for accurate interpretation and effective action. Let's break down the most common and impactful elements:
- Vibration Severity: This component often carries significant weight, as vibration is a leading indicator of mechanical degradation. It's usually derived from vibration analysis data, quantifying the overall severity of vibration patterns (e.g., using RMS velocity or a customized scoring system). Higher values generally indicate more significant issues.
- Lubricant Condition: Represented by parameters such as viscosity, particle count (ferrous density, silica content), and oil oxidation. Deterioration in lubricant quality signifies increased wear and potential damage to internal components.
- Thermographic Signature: An assessment of temperature variations across the asset. Excessive or localized hot spots frequently point to friction, misalignment, or failing electrical connections.
- Ultrasonic Emission Intensity: This component quantifies the level of ultrasonic emissions, which can indicate leaks, friction, and impact events. Increased emissions often signal the onset of failure.
- Process Parameter Deviations: How far are key process variables (pressure, flow, temperature) deviating from their expected range? Significant deviations can impact equipment health.
- Electrical Signature Analysis (for electric motors): Includes parameters like motor current signature analysis (MCSA) and insulation resistance measurements. It's a vital component for electric motor driven equipment.
- Trending Rate of Change: It's not just about the current value, but how quickly a parameter is changing. A rapidly deteriorating trend is a more immediate concern than a consistently high value.
Each of these components can be weighted differently within the overall EHI calculation, based on their relative importance to the specific equipment and the potential consequences of failure.
Performance & Trending Analysis
This section focuses on the "big picture" - understanding the overall health of your equipment and how it's changing over time. It's where you move beyond individual data points and start seeing patterns. Here's a framework for your Performance & Trending analysis:
1. Baseline Establishment & Current Score:
- Record the Current EHI Score: Clearly document the latest EHI value.
- Compare to Baseline: Refer back to the established baseline EHI score (typically set during commissioning or after a period of stable operation). Note the difference - is it within acceptable tolerance levels?
- Define Acceptable Range: If you haven't already, define the acceptable range for your EHI score based on historical data and equipment criticality. This helps flag potential issues before they become critical.
2. Trend Visualization & Interpretation:
- Plot the Trend: Create a simple graph displaying the EHI score over time (weekly, monthly, quarterly - choose the appropriate interval). X-axis: Time; Y-axis: EHI Score.
- Identify Trends: Visually inspect the trend line. Is it:
- Improving: Positive sign! Investigate what's driving the improvement and look for opportunities to replicate those actions.
- Declining: Significant concern! Trigger a deeper dive into the contributing factors (see subsequent sections).
- Stable: Generally positive, but still requires monitoring for subtle shifts.
- Calculate Rate of Change: Determine the rate of change (e.g., EHI score per month) to quantify the trend's severity.
- Note Significant Deviations: Highlight any points on the graph that deviate significantly from the established trend. Document the date, EHI score, and a preliminary explanation for the deviation.
3. Peer Comparison (If Applicable):
- Identify Similar Assets: Select a group of assets considered functionally similar (same model, usage profile, operating conditions).
- Compare EHI Scores: Compare the subject asset's EHI score to the average or median score of the peer group. A score significantly lower than the peer group is a red flag.
- Analyze Discrepancies: If discrepancies exist, investigate the underlying causes. Are there differences in maintenance practices, operating conditions, or equipment age?
Template Checklist for Performance & Trending Analysis:
- Recorded current EHI score.
- Compared current score to baseline.
- Verified score is within acceptable range.
- Plotted EHI trend over time.
- Identified trend (improving, declining, stable).
- Calculated rate of change (if applicable).
- Noted significant deviations from trend.
- Performed peer comparison (if applicable).
Condition Monitoring Data Review
This section focuses on the detailed review of data generated from your condition monitoring techniques. It's not enough to simply collect data; you need a structured process for analyzing it and identifying trends. This template provides a framework for ensuring a thorough and consistent review.
For Each Condition Monitoring Technique (Vibration Analysis, Oil Analysis, Thermography, Ultrasonic Testing, etc.):
- Date and Time of Data Acquisition: Document when the data was collected. This is crucial for correlating data with operational events.
- Equipment ID and Location: Clearly identify the specific asset the data represents.
- Data Collector/Technician: Record who acquired the data. This allows for accountability and provides a point of contact for questions.
- Baseline Comparison: Compare current data to established baseline values. Note any deviations and quantify the difference (e.g., Vibration amplitude 15% higher than baseline).
- Trend Analysis: Plot data over time to identify trends. Use control charts or other statistical tools to highlight significant changes. Look for patterns that might indicate a developing problem.
- Anomaly Detection: Specifically note any anomalies - unusual readings, unexpected patterns, or anything that deviates from the expected behavior.
- Root Cause Assessment (Preliminary): Based on the data, what are the possible root causes of the observed anomalies? Document potential causes, even if they are speculative at this stage.
- Recommended Actions: Outline the next steps to be taken. This might include further investigation, adjustments to maintenance schedules, or escalation to a reliability engineer. Be specific and assign responsibility for the action.
- Reviewer Comments & Signature: The reviewer should add comments summarizing their findings, justifying any recommended actions, and providing their signature to confirm the review.
Example Table Format for Review:
| Date | Equipment ID | Parameter | Baseline Value | Current Value | Trend | Anomaly? | Possible Cause | Recommended Action | Reviewer |
|---|---|---|---|---|---|---|---|---|---|
| 2024-10-27 | Pump-001 | Vibration (Hz) | 2.0 in/s | 2.8 in/s | Increasing | Yes | Bearing wear? | Schedule vibration analysis and inspect bearing | John Smith |
| 2024-10-27 | Motor-002 | Oil Viscosity (cP) | 15 | 16 | Slight increase | No | Normal fluctuation | Monitor next oil sample | Jane Doe |
Vibration Analysis Checklist
This section focuses on the critical steps for a thorough vibration analysis review. Remember, consistent and accurate data collection is paramount.
1. Data Acquisition Verification:
- Sensor Placement: Confirm sensors are positioned correctly according to manufacturer guidelines and asset-specific procedures (e.g., 90-degree phase monitoring, horizontal/vertical axis). Document any deviations.
- Sensor Calibration: Verify sensor calibration dates and ensure sensors are within their calibration window. Record calibration certificates.
- Data Acquisition System (DAS) Settings: Confirm DAS sampling rate, resolution, and trigger settings are appropriate for the frequency range being analyzed. Note any changes made to DAS parameters.
- Units: Validate that data is being recorded in the correct units (e.g., mm/s, in/s, g).
2. Spectral Analysis Review:
- Baseline Comparison: Compare current spectra to historical baselines. Identify any shifts in amplitude or frequency.
- Frequency Identification: Accurately identify the source of dominant frequencies using known machine component speeds and harmonic relationships. Document any discrepancies.
- Amplitude Assessment: Evaluate amplitude levels relative to known limits and industry best practices. Note any exceeding values and potential causes.
- Harmonic Content: Analyze harmonic content to assess balance, alignment, and looseness issues.
- Rub/Impact Detection: Identify characteristic rub or impact frequencies and amplitudes.
3. Time Waveform Analysis:
- Waveform Shape: Examine time waveforms for distortion, spikes, or other abnormalities. Correlate waveform characteristics with spectral findings.
- Envelope Analysis (if applicable): Perform envelope analysis for gear and bearing fault detection. Evaluate envelope frequencies and amplitude patterns.
4. Phase Analysis (for multi-point monitoring):
- Phase Relationships: Verify phase relationships between sensors are consistent with expected behavior. Note any phase shifts indicating misalignment or structural issues.
5. Documentation & Follow-Up:
- Findings: Clearly document all findings, including spectral plots, time waveforms, and phase diagrams.
- Recommendations: Provide clear and actionable recommendations for maintenance or further investigation.
- Trend Data: Add data points to trend charts for long-term monitoring and performance evaluation.
Oil Analysis Checklist
Oil analysis is a cornerstone of any robust condition monitoring program. This checklist ensures comprehensive data collection and interpretation, providing vital insights into lubricant health and potential equipment issues.
I. Sample Acquisition & Preparation
- Sample Point Identification: Verify sample point location and labeling are accurate per equipment documentation.
- Sampling Procedure: Follow documented oil sampling procedure to minimize contamination.
- Sample Volume: Collect sufficient sample volume for all requested tests (typically 50-100ml, confirm with lab).
- Sample Labeling: Clearly label sample with date, equipment ID, location, and operator initials.
- Storage & Transport: Securely store and transport sample to the laboratory following proper handling procedures. Maintain sample integrity (temperature control, prevent leaks).
II. Laboratory Testing & Analysis
- Test Selection: Confirm laboratory performs all required tests:
- Viscosity
- Total Base Number (TBN)
- Total Acid Number (TAN)
- Flash Point
- Water Content
- Particle Count (ISO Code) - with Size Breakdown (e.g., µm)
- Ferrous Density (ppm) - categorized by particle size
- Wear Debris Identification (by microscopy or ferrography)
- Lubricant Chemistry (e.g., additive depletion)
- Data Review: Review laboratory report for completeness and accuracy.
- Baseline Comparison: Compare results to established baseline values and historical data.
- Threshold Evaluation: Assess results against pre-defined alarm thresholds.
III. Interpretation & Action
- Anomaly Identification: Identify any abnormal trends or values.
- Root Cause Analysis: Investigate potential root causes of lubricant degradation or contamination. (e.g., excessive wear, coolant ingress, filtration issues)
- Corrective Action: Define and implement appropriate corrective actions (e.g., lubricant change, filtration upgrade, leak repair).
- Documentation: Record findings, corrective actions, and follow-up actions in maintenance logs.
- Re-sampling Schedule: Adjust re-sampling frequency based on findings and equipment operating conditions.
Alarm & Maintenance History Verification
This section dives into confirming the responsiveness of your system and understanding the context behind EHI fluctuations. It's more than just numbers; it's about validating that your alarm system is effective and that past maintenance actions have been properly documented and understood.
1. Alarm System Validation:
- Threshold Review: Regularly assess the sensitivity of your alarm thresholds. Are they appropriate for the equipment's operating conditions and potential failure modes? Consider adjusting thresholds based on historical data and expert judgment. Avoid overly sensitive thresholds that trigger false alarms, which can lead to alert fatigue and ignored genuine issues.
- Response Time Analysis: Document the time taken to respond to alarms. Are procedures followed promptly and efficiently? Identify and address bottlenecks in the alarm response process.
- Root Cause Analysis of Alarms: When an alarm triggers, perform a thorough root cause analysis to determine the underlying issue. Don't just address the symptom; fix the cause to prevent recurrence.
2. Maintenance History Correlation:
- Review Past Work Orders: Correlate EHI trends with past maintenance activities. For example, did a sudden drop in EHI score coincide with a specific repair? If so, was the repair successful in restoring the asset's health?
- Document Maintenance Effectiveness: Create a system for documenting the effectiveness of maintenance interventions. Did the repair solve the problem? Were there any unexpected consequences? This feedback loop helps optimize future maintenance strategies.
- Identify Recurring Issues: Look for patterns in maintenance history. Recurring problems indicate systemic issues that need to be addressed through design changes, improved operating procedures, or enhanced training.
- Maintenance Task Effectiveness: For specific maintenance tasks (e.g., lubrication, filter replacement), assess their impact on the EHI score. Are these tasks being performed effectively? Should the frequency or method be adjusted?
Action Item Tracking & Future Planning
A thorough EHI review isn't just about identifying problems; it's about ensuring those problems get resolved and that you're proactively planning for future asset health. That's where structured action item tracking and forward-looking planning become essential.
Our template includes a dedicated section for meticulously documenting all identified action items. For each issue flagged during the EHI review, record:
- Issue Description: A concise explanation of the problem.
- Responsible Party: The individual or team accountable for addressing the issue.
- Priority Level: (e.g., High, Medium, Low) based on potential impact and risk.
- Target Completion Date: A realistic deadline for resolution.
- Status: (e.g., Open, In Progress, Completed, On Hold) to track progress.
- Notes: A space for documenting steps taken, challenges encountered, and any relevant observations.
Beyond immediate actions, forward planning is key. Use the review findings to:
- Refine Condition Monitoring Strategies: Are you collecting the right data? Do alarm thresholds need adjustment?
- Update Preventative Maintenance Schedules: Incorporate new insights into your PM routines.
- Identify Opportunities for Improvement: Can process modifications or equipment upgrades enhance asset health?
- Budget for Future Investments: Use trend data to justify investments in new technologies or equipment.
By consistently tracking action items and incorporating future planning into your EHI review process, you transform a reactive exercise into a proactive driver of asset reliability and operational excellence.
Resources & Links
- Reliable Plant : A comprehensive resource for maintenance, reliability, and asset management professionals. Offers articles, courses, and community forums covering a wide range of topics relevant to EHI reviews and condition monitoring.
- Machinery Reliability : Provides focused content and training on machinery reliability, including vibration analysis, oil analysis, and overall equipment health. Useful for deepening understanding of the components discussed.
- FixSensorTec : Offers vibration analysis and condition monitoring solutions. Their site provides technical articles and resources related to vibration analysis, which is a key element of EHI reviews.
- Tribosystems : Specializes in tribology (the study of friction, wear, and lubrication). Provides insights into oil analysis techniques and how they contribute to asset health assessment - a crucial aspect of EHI reviews.
- SKF : A global leader in bearings and related technologies. Their website has extensive technical resources, including guides and articles on condition monitoring and lubrication best practices, relevant to EHI reviews.
- Emerson : A broad industrial automation company. Emerson provides a variety of condition monitoring systems and software. Their website offers product information and application examples that can inform EHI review processes.
- Siemens : Another large industrial automation company. Siemens offers condition monitoring solutions and provides resources related to asset performance and predictive maintenance which would be beneficial for understanding and implementing EHI reviews.
- Banner Engineering : Provides sensors and related technologies often used in condition monitoring applications. Their site contains helpful information on sensor technology and its integration within asset health programs.
- ANSI (American National Standards Institute) : ANSI develops standards related to machinery safety and reliability. Understanding relevant standards is crucial for ensuring thorough and compliant EHI reviews. Although not direct EHI resources, compliance is a vital aspect.
- ISO (International Organization for Standardization) : ISO develops international standards applicable to many industries. Review of relevant ISO standards (e.g., ISO 14001 for environmental management, ISO 44001 for risk management) can provide a broader context for EHI reviews.
Frequently Asked Questions
What is an EHI (Equipment Health Index)?
An Equipment Health Index (EHI) is a standardized score that assesses the overall health and condition of an asset, combining various data points like performance metrics, maintenance records, and diagnostic results to provide a quantifiable indicator of its reliability and potential for failure. It helps in proactive maintenance planning and prevents unexpected downtime.
Why should I use an EHI checklist template?
Using a standardized EHI checklist template ensures consistency in your asset health assessments. It helps eliminate subjectivity, identifies trends over time, enables benchmarking against industry standards, and facilitates better communication about asset condition among different teams.
What kind of data should be included in an EHI assessment?
Data points vary based on the asset type but commonly include: operational performance metrics (e.g., efficiency, throughput), maintenance records (e.g., repairs, inspections), diagnostic data (e.g., vibration analysis, oil analysis), environmental factors, and component-specific health indicators.
What are the key sections typically found in an EHI checklist template?
Most templates include sections for: Asset Identification, Operational Performance, Maintenance History, Diagnostic Testing Results, Risk Assessment, Overall Health Score, and Recommendations/Action Items. Some might have asset-specific sections.
How does the article's template help with scoring the EHI?
The template provides clear guidelines for assigning scores to different data points based on predefined thresholds. It uses a scoring system (often a scale of 1-5 or 1-10) that allows you to quantify the health of each aspect of the asset and calculate an overall EHI score.
Can I customize the EHI checklist template?
Absolutely! The template is designed to be a starting point. You should tailor it to your specific asset types, operational context, and maintenance procedures. Add or remove data points as necessary to accurately reflect the asset's health.
How often should I perform EHI assessments?
The frequency depends on the criticality of the asset and its operating environment. Critical assets might require weekly or monthly assessments, while less critical assets could be assessed quarterly or annually. A risk-based approach is recommended.
What are the benefits of using an EHI to predict failures?
By tracking EHI trends over time, you can identify deteriorating asset health and predict potential failures before they occur. This allows for proactive maintenance interventions, minimizing downtime and costly repairs.
How can I use the EHI score to prioritize maintenance activities?
Assets with lower EHI scores (indicating poorer health) should be prioritized for maintenance. The EHI score provides a clear and objective basis for resource allocation and scheduling maintenance tasks.
Found this Article helpful?
Manufacturing Management Solution Demo
Stop chasing paperwork and wrestling with disconnected systems! Our solution brings clarity and control to your production process. From standard operating procedures (SOPs) and equipment maintenance to quality control and inventory tracking, we simplify every step.
Related Articles
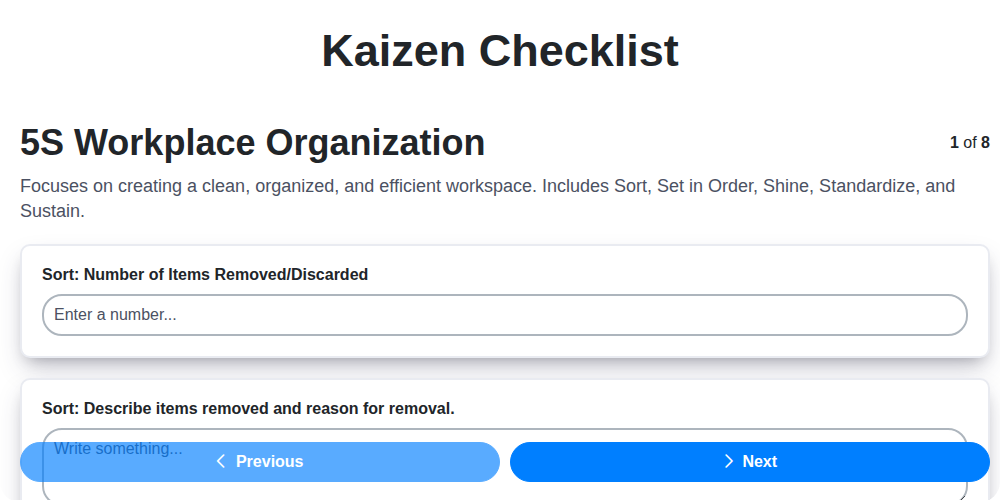
Kaizen Checklist Template: Your Path to Continuous Improvement

Machine Safety Audit Checklist: Your Guide to a Safer Manufacturing Workplace
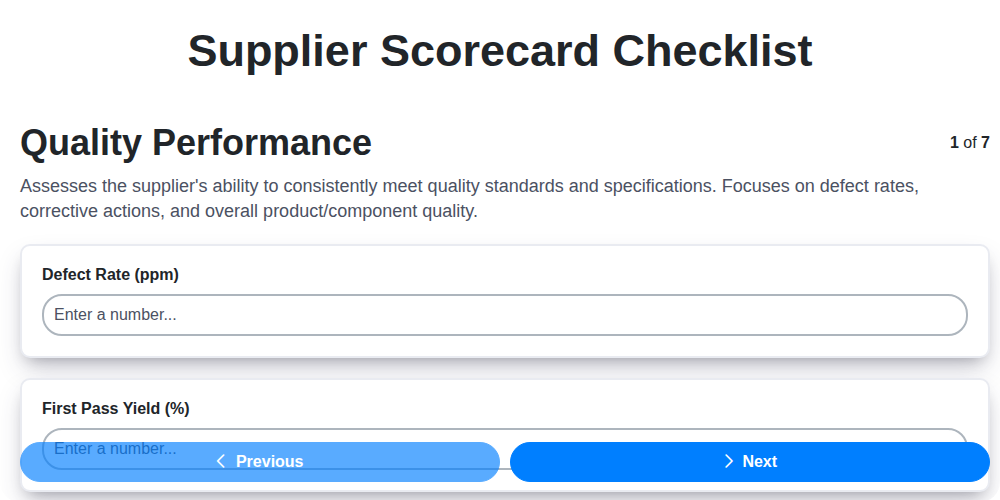
Mastering Supplier Performance: Your Free Supplier Scorecard Checklist Template
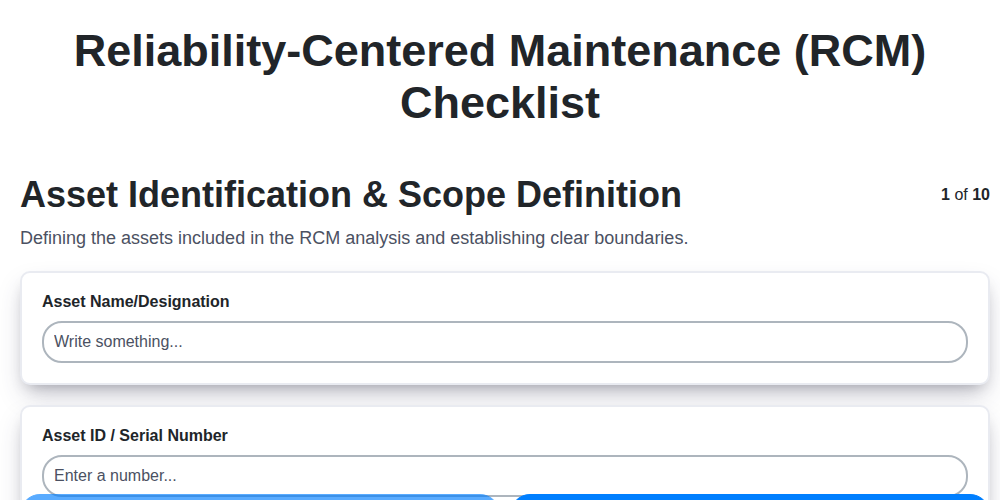
Your Ultimate RCM Checklist Template: A Step-by-Step Guide

LPA Checklist Template: Your Guide to Layered Process Audits

Your Ultimate Lockout/Tagout (LOTO) Checklist Template

Your Ultimate FSC 22000 Checklist Template
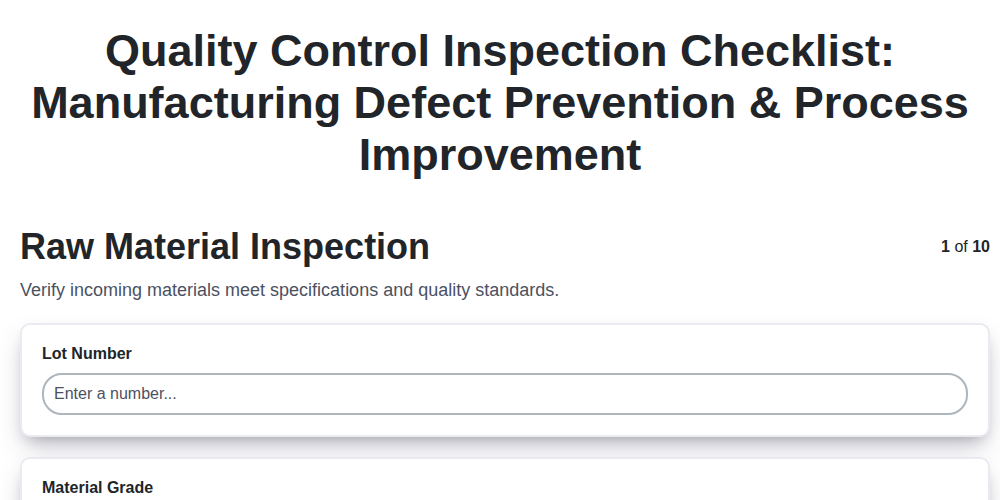
Quality Control Inspection Checklist Template: Prevent Defects & Improve Manufacturing Processes
We can do it Together
Need help with
Manufacturing?
Have a question? We're here to help. Please submit your inquiry, and we'll respond promptly.