The Ultimate Process Capability Study Checklist Template
Published: 09/01/2025 Updated: 05/28/2026
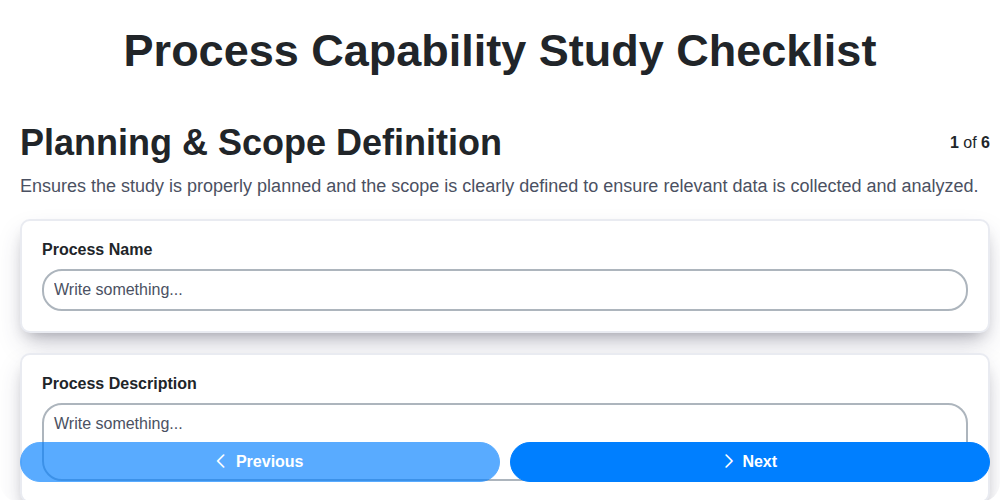
Table of Contents
- Why Use a Process Capability Study Checklist?
- Understanding Process Capability Fundamentals
- Step 1: Defining Your Scope & Objectives
- Step 2: Data Collection & Preparation - Ensuring Accuracy
- Step 3: Statistical Analysis & Key Capability Indices
- Step 4: Interpreting Results & Identifying Improvement Areas
- Step 5: Implementing Corrective Actions & Monitoring Progress
- Template Download & Resources
- Resources & Links
TLDR: Struggling to assess if your process is meeting quality specs? This checklist template guides you step-by-step, from planning and data collection to analysis and corrective actions. It ensures you're accurately measuring capability, identifying improvement areas, and consistently meeting quality goals - saving time and boosting performance.
Why Use a Process Capability Study Checklist?
A process capability study checklist isn't just about ticking boxes; it's your roadmap to reliable, data-driven process improvement. Skipping steps or cutting corners can lead to inaccurate conclusions, wasted resources, and ultimately, a process that appears capable when it's not. Think of it as a quality control measure for your analysis itself.
Using a checklist ensures consistency - every study is conducted using the same rigorous methodology, making comparisons over time meaningful. This consistency is invaluable for tracking progress and demonstrating the impact of improvement efforts. It also minimizes the risk of human error, a common culprit in flawed analyses.
Beyond the technical aspects, a checklist fosters a structured approach, facilitating collaboration among team members and clearly defining roles and responsibilities. This transparency builds confidence in the results and strengthens buy-in for corrective actions. Essentially, it's the foundation for a robust and defensible capability study, driving real, measurable improvements in your processes and contributing directly to your organization's bottom line.
Understanding Process Capability Fundamentals
Before diving into the checklist, it's crucial to grasp the core concepts behind process capability. Simply put, process capability tells us how well a process is meeting its intended specifications - those limits defined by design or customer requirements. It's not just about whether the process works, but how consistently it delivers acceptable output.
Think of it like aiming at a target. A capable process consistently hits close to the bullseye. An incapable process scatters shots all over the place, sometimes hitting the target, but often missing.
Key Terms & Concepts:
- Specification Limits (USL & LSL): These are the acceptable boundaries for your product or service. Anything outside these limits is considered defective.
- Process Variation: All processes exhibit some degree of variation. Understanding the source of that variation is key to improvement. Is it due to random fluctuations, or are there systematic factors at play?
- Process Mean: The average value of your process output. Ideally, this should be centered within the specification limits.
- Process Standard Deviation: This measures the spread or dispersion of your data. A smaller standard deviation indicates less variation.
- Capability Indices (Cp, Cpk, Pp, Ppk): These are the numerical scores that quantify your process capability. We'll explore these in more detail later, but essentially, they compare your process's performance against your specifications. A higher index generally indicates better capability.
- Potential Capability (Cp): This index assumes a process that is perfectly centered between the specification limits. It reflects the potential for capability if centering wasn't an issue.
- Actual Capability (Cpk): This index takes into account both centering and spread, providing a more realistic assessment of your process's ability to meet specifications.
Understanding these fundamentals provides a solid foundation for interpreting the results of your capability study and implementing effective improvement strategies.
Step 1: Defining Your Scope & Objectives
Before diving into data collection and calculations, meticulous planning is the bedrock of a successful process capability study. This initial phase isn't just about outlining the 'what' but also the 'why' and 'how' of your investigation. A poorly defined scope can lead to wasted effort, misleading conclusions, and ultimately, inaction.
First, clearly define the process you're evaluating. Is it the assembly of a specific product, the delivery of a service, or a combination of steps? Specificity here is vital. Next, pinpoint the Critical-to-Quality (CTQ) characteristics - those attributes that directly impact customer satisfaction or product performance. What aspects really matter? These CTQs become the focus of your measurements.
Once you're clear on what to measure, establish the specification limits. These are the agreed-upon boundaries for acceptable performance, often dictated by customer requirements, industry standards, or regulatory guidelines. Understanding where your process should be operating is crucial for assessing its actual capability.
Finally, establish a clear objective. Are you trying to demonstrate current process stability, identify areas for improvement, or validate the impact of a recent process change? A concise and measurable objective will guide your efforts and provide a benchmark against which to assess your success. Without a well-defined scope and objectives, your study risks becoming a time-consuming exercise in collecting data without a clear purpose.
Step 2: Data Collection & Preparation - Ensuring Accuracy
The foundation of any reliable process capability study lies in the quality of your data. Garbage in, garbage out is a critical mantra here - flawed data will lead to misleading conclusions and wasted effort. This stage isn't just about collecting data; it's about meticulously ensuring its accuracy and suitability for analysis.
Planning Your Data Collection:
Before you even begin recording measurements, clearly define your data collection procedures. This includes specifying who will collect the data, what tools and equipment will be used, and how data will be recorded. Standardize these procedures to minimize variability and potential errors.
Minimizing Measurement Errors:
- Gauge Repeatability and Reproducibility (GR&R): Ideally, you'll have already conducted an MSA to validate your measurement system. If not, be acutely aware of potential operator-to-operator and measurement-to-measurement variation.
- Calibration: Ensure all measurement equipment is properly calibrated and within its calibration cycle.
- Operator Training: Provide thorough training to all data collectors to ensure consistency in measurement techniques.
Data Verification & Cleaning:
Once data is collected, a crucial step is to verify its integrity. This involves:
- Outlier Detection: Examine the data for extreme values that may be due to errors or unusual process events. Investigate these outliers to determine if they are genuine or represent a data entry mistake. Use statistical methods (e.g., box plots, scatter plots) to aid in this process.
- Missing Data: Address any missing data points. Consider whether imputation is appropriate, or if the observation should be excluded. Document your approach.
- Data Entry Errors: Double-check all data entries for typographical errors. A simple data entry mistake can significantly skew results.
- Data Transformation: Depending on the process and chosen capability indices, you might need to transform the data (e.g., using logarithms, square roots) to meet assumptions of normality. Document these transformations.
Organization & Format:
Finally, ensure your data is organized in a clear and consistent format that's compatible with your statistical analysis software. Consistent labeling, units of measure, and date/time formats are vital. A well-organized dataset will save you time and reduce the risk of errors in subsequent analysis.
Step 3: Statistical Analysis & Key Capability Indices
This is where the numbers really start to tell a story. After meticulously collecting and preparing your data, it's time to perform statistical analysis and calculate key capability indices. The goal here is to quantify how well your process meets its specified limits.
First, calculate the process statistics: the mean (average) and standard deviation. The mean represents the typical output of your process, while the standard deviation measures the variability or spread of the data around that mean.
Then, we move to the heart of the analysis: the capability indices. Here are some of the most commonly used:
- Cp (Potential Capability): This index assesses the potential capability of your process assuming the process is perfectly centered within the specification limits. It essentially measures how close your specification limits are to the process's natural spread. A higher Cp indicates a greater potential for capability.
- Cpk (Actual Capability): This is arguably the most critical index. Cpk considers both the potential capability (Cp) and the process's centering within the specification limits. It reflects the actual ability of your process to consistently produce output within those limits. A lower Cpk, even with a high Cp, indicates that the process is off-center, increasing the likelihood of producing non-conforming items.
- Pp (Process Performance): Similar to Cp, Pp measures the potential performance, but utilizes the sample standard deviation rather than the process standard deviation used in Cp. This gives a different perspective on potential performance using data.
- Ppk (Process Performance Index): Analogous to Cpk, Ppk considers actual process performance and is significantly impacted by any bias within the process.
Understanding the Numbers: Generally speaking, a Cpk (or Ppk) of 1.33 or higher is often considered a desirable level of capability, indicating a low risk of producing defects. Values below 1.0 signal a serious problem requiring immediate corrective action. Remember that these are guidelines; specific industry standards or customer requirements may dictate more stringent targets.
Normality Check: Before relying heavily on these indices, it's crucial to check if your data follows a normal distribution. Many capability index calculations assume normality, and violations of this assumption can lead to inaccurate results. Statistical software can help you assess data normality.
Finally, always document your calculations and the assumptions made, ensuring the analysis is transparent and reproducible.
Step 4: Interpreting Results & Identifying Improvement Areas
The heart of a process capability study lies in understanding the numbers generated by your statistical analysis. Let's break down how to interpret those key capability indices - Cp, Cpk, Pp, and Ppk - and translate them into clear improvement areas.
Understanding the Indices:
Cp (Potential Capability): This metric represents what your process could achieve if its output were perfectly centered around the mean of the specification limits. A Cp of 1.0 indicates that the process spread equals the specification width. Higher values (e.g., 1.33 or higher) are generally desired, signifying greater potential. However, Cp alone doesn't tell the whole story.
Cpk (Actual Capability): This is the most commonly used metric and reflects the actual capability of your process, considering both centering and spread. It's essentially the smaller of the process's spread (standard deviation) divided by the distance to either the upper or lower specification limit. A Cpk of 1.33 or higher is typically considered acceptable, while values below 1.0 suggest the process is not meeting specifications. Crucially, a high Cp with a low Cpk indicates that the process is well-behaved but significantly off-center.
Pp & Ppk (Process Performance): These indices assess how the process actually performs over a longer period, using the actual distribution of data. They are particularly useful for evaluating the stability of a process. The interpretation is similar to Cp and Cpk - higher values are better. Comparing Pp and Ppk to Cp and Cpk can reveal if the process is consistently performing worse than its potential.
Beyond the Numbers: Identifying Improvement Opportunities
Here's how to pinpoint areas for improvement based on the capability study results:
- Low Cpk (and Pp/Ppk): This is the most common scenario. It means the process isn't consistently meeting specifications. You need to investigate:
- Process Centering: Is the process output consistently biased in one direction? Adjusting process parameters can often correct this.
- Process Variation: Is the spread of the data too wide? This suggests inconsistent inputs, equipment issues, or poor process control.
- High Cp, Low Cpk: This indicates a well-controlled process that is simply off-center. Adjusting the process to center the output is the primary focus.
- Significant Difference Between Pp/Ppk and Cp/Cpk: This suggests that the process isn't stable. You need to identify and eliminate special causes of variation (unpredictable events) affecting the process. Control charts are invaluable here.
- Capability Below Target: Even if the process is capable (meeting specifications), it might not be performing to the level desired. Look for opportunities to reduce variation and improve overall efficiency.
Finally, remember that capability indices are just one piece of the puzzle. Combine them with your knowledge of the process and your understanding of customer requirements to make informed decisions and drive meaningful improvements.
Step 5: Implementing Corrective Actions & Monitoring Progress
Identifying the problem is only half the battle; the real value comes from taking action and verifying its effectiveness. This phase moves beyond statistical analysis and focuses on tangible improvements to your process.
1. Root Cause Analysis - Digging Deeper: Don't just address the symptoms; find the root cause. Utilize techniques like the 5 Whys, Fishbone (Ishikawa) diagrams, or Pareto charts to systematically investigate why the process is falling short of capability. Are there equipment issues, operator errors, material inconsistencies, or design flaws contributing to the problem?
2. Action Planning - Specific, Measurable, Achievable, Relevant, Time-bound (SMART): Develop a detailed action plan outlining specific steps to address the identified root causes. Each action should be SMART - Specific, Measurable, Achievable, Relevant, and Time-bound. For example, instead of improve operator training, specify Provide refresher training on machine setup procedures to all operators within two weeks, focusing on [specific aspect] and measuring comprehension through a post-training quiz. Assign ownership for each action and establish deadlines.
3. Prioritization - Focusing Resources: Corrective actions often require resource allocation. Prioritize actions based on their potential impact on process capability and feasibility of implementation. A simple impact/effort matrix can be helpful for this prioritization.
4. Implementation & Documentation: Execute the action plan meticulously. Thoroughly document all actions taken, including the rationale behind them, the resources used, and any challenges encountered. This documentation is invaluable for future reference and audits.
5. Post-Implementation Monitoring - Tracking the Changes: After implementing corrective actions, continuously monitor the process to assess their impact. This involves collecting data and recalculating the capability indices (Cp, Cpk, etc.). Create control charts to visually track process stability and identify any unexpected shifts or trends. Compare the post-implementation capability metrics to the baseline data to quantify the improvement. Don't be afraid to iterate - if the initial actions don't achieve the desired results, further investigation and adjustments are necessary.
6. Formal Review and Validation: Schedule a formal review meeting with key stakeholders to discuss the results of the corrective actions. Document the review findings and formally validate that the process has achieved the target level of capability.
Template Download & Resources
Getting started with a process capability study can feel overwhelming, but we're here to help! Below you'll find a downloadable template and a curated list of resources to support your journey.
Process Capability Study Template (Excel)
This template provides a structured framework for organizing your data, performing calculations, and documenting your findings. It includes sections for:
- Defining Process Scope & Objectives
- Data Collection & Summary
- Capability Index Calculations (Cp, Cpk, Pp, Ppk)
- Normality Assessment
- Report Generation
Helpful Resources:
- ASQ (American Society for Quality): https://asq.org/ - A wealth of information on quality management, including process capability.
- Minitab Blog: https://blog.minitab.com/ - Articles and tutorials on statistical analysis, including capability studies.
- Six Sigma Tools: https://www.sixsigmatools.net/ - Provides various statistical tools and resources.
- Capability Index Calculator: For quick capability index calculations.
- Understanding Process Capability Plots: A resource to help you interpret capability plots.
Resources & Links
- NIST - Statistical Engineering Laboratory : The National Institute of Standards and Technology (NIST) offers extensive resources, publications, and data related to statistical engineering and process capability. It's a great source for fundamental understanding and best practices.
- ASQ - American Society for Quality : ASQ is a leading global resource for quality professionals. Their website features articles, webinars, training, and certifications related to process capability and statistical process control (SPC).
- Quality America : Quality America provides articles, tools, and training resources covering a wide range of quality topics, including process capability, statistical analysis, and Six Sigma principles. Useful for practical implementation advice.
- Minitab : Minitab is a widely used statistical software package. Their website provides tutorials, example datasets, and guides for performing process capability analysis. Offers demos and trials of the software.
- SAS JMP : SAS JMP is another robust statistical software solution. Similar to Minitab, their website has tutorials, examples and statistical resources applicable to process capability studies. Offers free trials.
- Statworx : Statworx offers statistical training, consulting, and software. Their site has a wealth of information on SPC, process capability and Six Sigma.
- The Lean Enterprise Institute : While focused on Lean principles, understanding the connection between process capability and waste reduction is critical. This site provides resources on lean manufacturing and process improvement.
- Six Sigma Quality : Provides articles, tools and training related to Six Sigma methodologies. Process capability is a core element of Six Sigma, so this resource provides context and practical application.
- iSixSigma : A community site and resource hub dedicated to Six Sigma and Lean methodologies. Features articles, forums, and a directory of professionals.
- MathWorks (MATLAB) : If your organization uses MATLAB for statistical analysis, MathWorks' website offers toolboxes and examples that can be adapted for process capability studies. Powerful but more complex than dedicated SPC software.
Frequently Asked Questions
What is a Process Capability Study?
A Process Capability Study assesses how well a process is meeting specifications. It uses statistical measures like Cp, Cpk, Pp, and Ppk to determine if a process is predictable and capable of consistently producing outputs within acceptable limits.
Why do I need a Process Capability Study?
Understanding process capability helps identify areas for improvement, reduce defects, enhance customer satisfaction, and prevent costly problems. It's crucial for ensuring product quality and process stability.
What is the difference between Cp/Cpk and Pp/Ppk?
Cp and Pp measure the potential capability of a process (assuming it's perfectly centered). Cpk and Ppk account for the actual process centering and reflect its real-world performance. Cpk and Ppk are typically lower than Cp and Pp.
What is included in the 'Ultimate Process Capability Study Checklist Template'?
The template provides a structured approach, including steps for data collection, calculating capability indices, interpreting results, and documenting findings. It covers topics like defining the process, selecting data, performing calculations, and creating reports.
What kind of data do I need for a Process Capability Study?
You'll need a representative sample of data from the process being studied. This usually involves measurements taken over a significant period, enough to capture process variation. The specific data type (e.g., length, weight, diameter) depends on the process and its specifications.
How many data points are needed for a reliable Process Capability Study?
Generally, a minimum of 30 data points per subgroup is recommended for calculating capability indices. More data points (e.g., 50-100 or more) provide greater accuracy and confidence in the results. The template includes guidance on determining the appropriate sample size.
What do the Process Capability indices (Cp, Cpk, Pp, Ppk) actually mean?
* **Cp:** Potential process capability. A value of 1.33 or higher is typically considered acceptable.* **Cpk:** Actual process capability, considering centering. A value of 1.33 or higher is generally desired.* **Pp:** Potential process performance.* **Ppk:** Actual process performance, accounting for centering.
How do I interpret a Process Capability Study result of Cpk = 0.8?
A Cpk of 0.8 indicates the process is not capable. The process is not centered within the specification limits, and outputs are frequently outside those limits. Action is needed to recenter the process and improve its performance.
What actions should I take if my Process Capability Study shows the process is not capable?
Steps may include identifying and eliminating special causes of variation, adjusting process parameters, improving operator training, and implementing process controls.
Where can I find further resources and support for Process Capability Studies?
Several resources are available, including statistical software packages (Minitab, JMP), online tutorials, and consulting services specializing in quality improvement and process capability analysis.
Found this Article helpful?
Manufacturing Management Solution Demo
Stop chasing paperwork and wrestling with disconnected systems! Our solution brings clarity and control to your production process. From standard operating procedures (SOPs) and equipment maintenance to quality control and inventory tracking, we simplify every step.
Related Articles
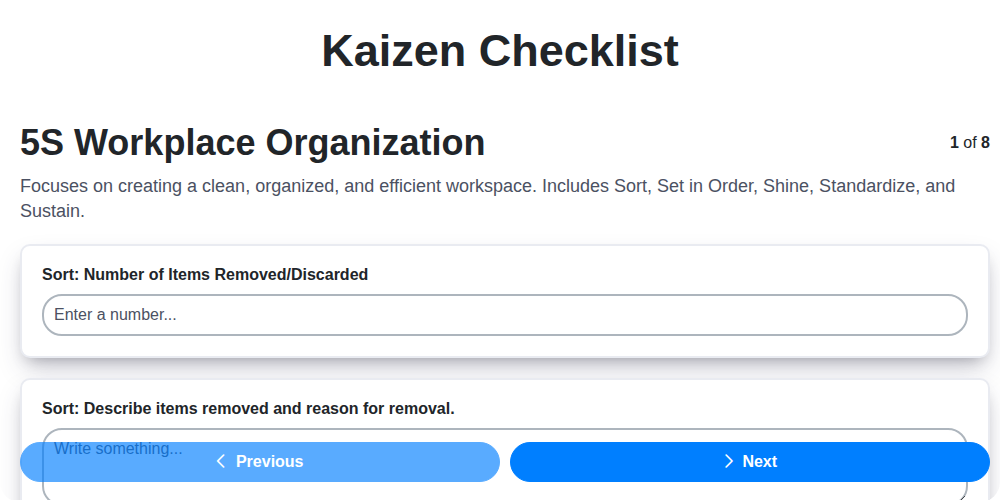
Kaizen Checklist Template: Your Path to Continuous Improvement

Machine Safety Audit Checklist: Your Guide to a Safer Manufacturing Workplace
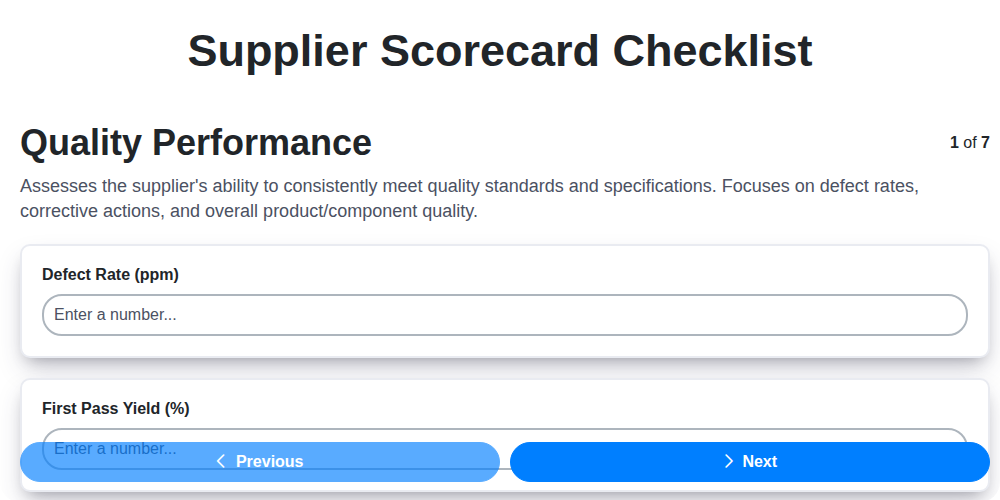
Mastering Supplier Performance: Your Free Supplier Scorecard Checklist Template
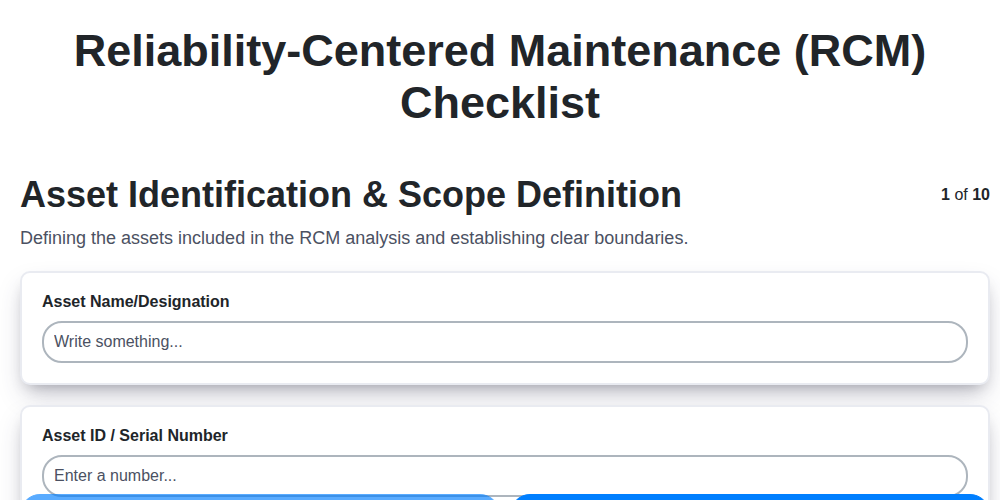
Your Ultimate RCM Checklist Template: A Step-by-Step Guide

LPA Checklist Template: Your Guide to Layered Process Audits

Your Ultimate Lockout/Tagout (LOTO) Checklist Template

Your Ultimate FSC 22000 Checklist Template
Quality Control Inspection Checklist Template: Prevent Defects & Improve Manufacturing Processes
We can do it Together
Need help with
Manufacturing?
Have a question? We're here to help. Please submit your inquiry, and we'll respond promptly.