Your Ultimate SPM Checklist Template: A Step-by-Step Guide
Published: 09/01/2025 Updated: 12/13/2025

Table of Contents
- Introduction: Why SPM Matters
- What's Included in Your SPM Checklist Template?
- Defining Your Process & KPIs
- Data Collection - The Foundation of SPM
- Selecting the Right Control Chart
- Calculating and Validating Control Limits
- Responding to Out-of-Control Signals
- Laying the Foundation: Why Documentation and Training are Essential
- Regularly Reviewing and Improving Your SPM System
- Common SPM Challenges & How to Overcome Them
- Laying the Foundation: Defining Your Process & Identifying Critical Variables
- Conclusion: Taking Control of Your Processes with SPM
- Resources & Links
TLDR: This checklist template gives you a clear, step-by-step guide to implementing Statistical Process Monitoring (SPM). It covers everything from defining your process to responding to out-of-control situations, helping you proactively manage processes, reduce errors, and continuously improve performance-all in one easy-to-use document.
Introduction: Why SPM Matters
In today's competitive landscape, simply reacting to problems isn't a sustainable strategy. Businesses need to be proactive, identifying and addressing potential issues before they escalate into costly errors, delays, and dissatisfied customers. Statistical Process Monitoring (SPM) provides precisely that ability. It's not just about tracking numbers; it's about gaining a deep understanding of how your processes behave, uncovering hidden inefficiencies, and ultimately, driving continuous improvement.
Think of SPM as a vital early warning system for your operations. By leveraging statistical tools to monitor key process variables, you can detect subtle shifts and trends that would otherwise go unnoticed. This allows you to intervene swiftly, preventing defects, minimizing waste, and ensuring consistent product or service quality. Beyond just addressing immediate concerns, a well-implemented SPM system fosters a culture of data-driven decision-making, empowering teams to optimize performance and achieve operational excellence. Ultimately, SPM isn't just about monitoring; it's about empowering your business to thrive.
What's Included in Your SPM Checklist Template?
Our SPM Checklist Template isn't just a static list; it's a dynamic tool to guide your process monitoring journey. Here's a breakdown of what you're getting:
- Process Definition Worksheet: A guided worksheet to help you clearly define the process you're monitoring, identify critical variables, and map out its boundaries. Includes prompts for defining scope and success criteria.
- Data Collection Log: A structured log to record data collection frequency, responsible parties, and any deviations from the planned schedule. Ensures data integrity and accountability.
- Control Chart Selection Guide: A decision tree to assist in choosing the appropriate control chart type based on your data characteristics (variable vs. attribute data).
- Control Limit Calculation Sheet: Pre-formatted spreadsheet to easily calculate UCL and LCL, with clear formulas and explanations.
- Out-of-Control Action Response Plan: A template to outline specific actions, responsibilities, and timelines for responding to out-of-control conditions. Includes a section for root cause analysis.
- Training Matrix: A simple matrix to track training completion and ensure all personnel are proficient in SPM procedures.
- Review & Improvement Log: A log to document periodic review findings, proposed improvements, and action items for continuous optimization of your SPM system.
- Checklist Summary: A consolidated, printable checklist summarizing all key steps for quick reference and audit readiness.
Defining Your Process & KPIs
Before you can start monitoring, you need a clear understanding of what you're monitoring and why. This isn't just about identifying a process; it's about defining its boundaries and pinpointing the critical factors that influence its success.
Defining the Process: Start by clearly outlining the process you want to monitor. Document its inputs, outputs, and the key steps involved. A simple flowchart can be incredibly helpful here. Ask yourself: Where does the process begin? Where does it end? What are the critical transformations happening within those boundaries?
Identifying Your KPIs (Key Performance Indicators): Not all variables are created equal. Focus on the vital few that have the most significant impact on the process's desired outcomes. These are your KPIs. Examples include:
- Manufacturing: Defect rate, cycle time, throughput, overall equipment effectiveness (OEE).
- Service: Customer satisfaction score, average handle time, first-call resolution rate.
- Administrative: Invoice processing time, error rate in data entry.
Prioritization is Key: Don't try to monitor everything. Start with 2-3 critical KPIs that are demonstrably impacting performance or are frequently causing issues. You can always expand your monitoring scope later.
The SMART Approach: Ensure your KPIs are Specific, Measurable, Achievable, Relevant, and Time-bound. This framework helps guarantee you're tracking meaningful data that can drive actionable insights. For example, instead of improve customer satisfaction, a SMART KPI would be: Increase customer satisfaction score from 7.5 to 8.0 within Q3 2024, as measured by our post-service survey.
Data Collection - The Foundation of SPM
Without reliable data, your Statistical Process Monitoring (SPM) efforts are built on a shaky foundation. Garbage in, garbage out - it's a principle that applies directly to SPM. This isn't just about gathering numbers; it's about collecting accurate, consistent, and relevant data that paints a clear picture of your process's performance.
Defining Your Data Needs:
First, pinpoint exactly what data you need. Refer back to your Process Definition (Step 1). What KPIs did you identify as critical? The data you collect must directly relate to those KPIs. For example, if your KPI is defects per unit, you need a system for accurately counting and recording defects. Don't overcomplicate things - focus on the data that truly drives insight.
Frequency is Key:
How often should you collect this data? There's no one-size-fits-all answer. More volatile processes require more frequent data collection. A process with large swings in performance might need data collected hourly, while a stable process can be monitored daily or even weekly. Consider the cost of data collection versus the potential benefit of early detection.
Automation vs. Manual Collection:
While manual data collection can be a starting point, automation is almost always preferable. Automated systems minimize human error, reduce the workload on operators, and provide real-time data availability. Think about integrating data collection directly into your manufacturing equipment or using sensors to monitor process variables. If manual collection is unavoidable, implement rigorous checks and balances to ensure data accuracy - double-checking entries, using standardized forms, and providing thorough training.
Standardization is Your Friend:
Establish clear, standardized procedures for data collection. This includes defining measurement units, recording methods, and documenting any deviations from the standard protocol. A well-defined procedure minimizes ambiguity and ensures that everyone is collecting data in the same way.
Data Integrity is Paramount:
Implement checks and balances to maintain data integrity. This could involve range checks (ensuring values fall within expected limits), duplicate entries, or reconciliation with other systems. Regularly review data for anomalies and investigate any discrepancies. Remember, the value of your SPM system hinges on the trustworthiness of the data it uses.
Selecting the Right Control Chart
Choosing the correct control chart is the foundation of effective Statistical Process Monitoring. It's not a one-size-fits-all situation - the chart type needs to align with the type of data you're collecting. Misselecting a chart can lead to inaccurate interpretations and ultimately, missed opportunities for improvement.
Here's a breakdown of common control chart types and when to use them:
X-bar and R Chart: This pair is your go-to for variable data - data that's measured (e.g., length, weight, temperature). The X-bar chart tracks the average of samples, while the R chart monitors the range within each sample. Use this when you can reliably measure a characteristic.
X-bar and S Chart: Similar to X-bar and R, but the S chart uses the standard deviation instead of the range to assess variation. S charts are often preferred when sample sizes are larger.
Individuals Chart (X Chart): Used when you can only collect one measurement at a time, or when subgrouping isn't practical. Ideal for processes where sampling isn't possible.
p-Chart: Monitors the proportion of defective items in a sample. Use this when you're interested in the percentage of non-conforming units.
np-Chart: Similar to the p-chart, but tracks the number of defective items instead of the proportion.
c-Chart: Tracks the number of defects per unit. Useful for situations where you're counting the total number of flaws within a single item (e.g., scratches on a painted surface).
u-Chart: Tracks the number of defects per unit time or opportunity. Useful for processes where the chances of defects vary (e.g., calls received per hour at a customer service center).
Pro Tip: If you're unsure which chart to choose, start by understanding the scale of measurement of your data - is it ratio, interval, ordinal, or nominal? This can often guide you to the appropriate chart type. Consulting a statistician or process improvement expert can also be incredibly valuable.
Calculating and Validating Control Limits
Calculating control limits is a foundational step in SPM, and getting them right is crucial for accurate monitoring. These limits define the expected range of variation within a process when it's operating correctly. Deviations beyond these limits signal a potential problem.
The formulas you use to calculate these limits depend on the type of data you're collecting and the control chart you're using. Here's a quick overview of common scenarios:
For Variable Data (e.g., measurements like length, weight):
- X-bar and R Chart: These charts monitor both the average (X-bar) and the range (R) of samples. The control limits are calculated using formulas that incorporate the average range (R-bar) and factors based on sample size. You can find these formulas readily available online with a quick search for X-bar R control chart formulas.
- X-bar and S Chart: Similar to X-bar and R, but using standard deviation (S) instead of range. Standard deviation often provides a more precise measure of variation.
For Attribute Data (e.g., counts of defects, pass/fail):
- p-chart: Used to monitor the proportion of defective items. Requires calculating the sample proportion and using a formula based on the sample size and an estimated process proportion.
- c-chart: Used to monitor the number of defects per unit.
Validation is Key:
Calculating the limits is only half the battle. You must validate them. Here's how:
- Initial Data Period: The data used to calculate the initial control limits should represent a period when the process is known to be stable and under control.
- Out-of-Control Signals: Observe the process after establishing the control limits. If you see frequent out-of-control signals (points outside the limits) despite the process being stable, your initial data may have been flawed, or your assumptions were incorrect. Recalculate the limits using more representative data.
- Process Knowledge: Leverage your understanding of the process. Do the calculated limits seem realistic given your knowledge of the process's inherent variability? If they seem unreasonably tight or loose, investigate further.
- Continuous Improvement: Control limits aren't set in stone. As the process improves, you may need to recalculate them periodically to reflect the new, tighter control.
Responding to Out-of-Control Signals
When a point falls outside your control limits, or a pattern emerges that indicates a process shift, it's not a time for panic - it's a call to action. Responding effectively to these "out-of-control" signals is crucial for maintaining process stability and preventing defects. But simply reacting isn't enough; a structured response is key.
First, verify the signal. It sounds obvious, but double-check that the data was recorded accurately and the chart is being read correctly. A simple typo or misinterpretation can trigger unnecessary action. Second, immediately stop the process if the signal suggests a critical failure. For less severe signals, production can continue under heightened monitoring, but never ignore the warning.
Next, assemble a response team. This should include individuals knowledgeable about the process and the SPM system. Their first task is a thorough root cause analysis. Don't jump to conclusions; investigate the underlying reasons for the signal. Was it a faulty machine, a change in raw materials, or an operator error? Use tools like the 5 Whys or a fishbone diagram to systematically uncover the root cause.
Once identified, implement corrective action. This might involve repairing equipment, adjusting process parameters, retraining operators, or modifying raw material specifications. Document the action taken and the rationale behind it.
Finally, reassess the process. After implementing corrective action, monitor the chart to ensure the signal has resolved and the process is stable. It's important to validate that the corrective action has been effective. If the signal persists, revisit the root cause analysis and consider alternative solutions. A single corrective action isn't always enough - continuous improvement is essential.
Laying the Foundation: Why Documentation and Training are Essential
Statistical Process Monitoring (SPM) isn't just about charts and numbers; it's about embedding a new way of thinking and working within your organization. Without clear documentation and thorough training, your SPM system is vulnerable to inconsistencies, errors, and ultimately, failure. Even the most perfectly designed control charts are useless if data isn't collected correctly or out-of-control signals are ignored.
Documenting Your SPM Process: Your Roadmap to Consistency
Your SPM documentation shouldn't be a dusty binder tucked away somewhere. It's a living document that outlines exactly how your SPM system operates. Consider including:
- Process Maps: Visually illustrate the entire SPM workflow, from data collection to response actions.
- Data Collection Standard Operating Procedures (SOPs): Define what data is collected, when, by whom, and using what methods. Detail any required software or tools.
- Control Chart Guidelines: Provide clear instructions on how to interpret control charts, recognize out-of-control signals, and escalate issues.
- Response Protocols: Clearly outline the steps to be taken when a process goes out of control, including escalation procedures and assigned responsibilities.
- Control Limit Recalculation Procedures: Document how and when control limits should be reviewed and updated.
Training: Empowering Your Team
Training isn't a one-time event; it's an ongoing investment. Your team needs to understand why SPM is important, how it works, and their role in its success.
- Initial Training: Cover the fundamentals of SPM, the purpose of the system, and the team's individual responsibilities.
- Hands-On Practice: Provide opportunities for practical application of the principles learned. This could involve simulated scenarios or real-world case studies.
- Refresher Courses: Regularly schedule refresher courses to reinforce knowledge and address any new developments in the SPM process.
- Documentation Accessibility: Make all documentation easily accessible to all team members - consider a shared online platform.
- Champion Identification: Identify and cultivate champions within each team who can provide ongoing support and mentorship to their colleagues.
Without robust documentation and comprehensive training, your SPM system is at risk. Invest in these critical elements, and lay a solid foundation for lasting process improvement.
Regularly Reviewing and Improving Your SPM System
Your Statistical Process Monitoring (SPM) system isn't a set it and forget it solution. Just like any process, it needs regular review and continuous improvement to remain effective. Over time, processes change, data patterns shift, and new challenges arise. What worked brilliantly a year ago might be providing inaccurate or misleading information today.
This step is about ensuring your SPM system evolves alongside your operations. Here's how to approach it:
- Schedule Regular Reviews: Establish a recurring schedule - quarterly, bi-annually, or annually - to formally review your SPM system's performance. Don't let it slip!
- Analyze Chart Performance: Beyond just glancing at control charts, dig deeper. Are control limits still appropriate? Are there consistent patterns you haven't addressed? Are there shifts in the process that necessitate recalculation?
- Assess Data Collection Effectiveness: Are your data collection methods still accurate and reliable? Have new data sources become available that could provide valuable insights? Are there opportunities to automate data collection to reduce errors?
- Seek Feedback from Operators: Operators are on the front lines. Solicit their feedback on the usefulness of the SPM system and any suggestions for improvement. Their practical experience is invaluable.
- Document Changes & Rationale: Whenever you make changes to the SPM system - recalculating control limits, adjusting data collection methods, or implementing new charts - meticulously document the changes and the rationale behind them. This provides a record for future reference and helps maintain consistency.
- Stay Informed About Best Practices: The field of statistical process monitoring is constantly evolving. Stay informed about new techniques, software tools, and best practices to ensure your system remains cutting-edge.
Common SPM Challenges & How to Overcome Them
Embarking on a Statistical Process Monitoring (SPM) journey is a fantastic investment in your operational efficiency, but it's not without its potential pitfalls. Many organizations encounter similar challenges during the initial implementation phase. Understanding these common hurdles and having strategies to overcome them will set you up for SPM success.
1. Data Availability & Quality: Let's face it, SPM is only as good as the data it's built upon. A lack of readily available data, or data riddled with inaccuracies, is a frequent roadblock. Solution: Start small. Focus on a process with existing data collection. If data is missing or unreliable, invest in improving your data collection infrastructure and implement data validation checks. Clean, reliable data is the foundation.
2. Resistance to Change: Introducing a new system like SPM can be met with resistance, especially from those accustomed to more traditional methods. Solution: Communication is key. Clearly explain the benefits of SPM to everyone involved. Involve stakeholders in the planning and implementation process to foster buy-in. Emphasize how SPM can help them, not hinder their work.
3. Overwhelming Complexity: The statistical concepts behind SPM can seem daunting at first. Selecting the right control charts, calculating limits, and interpreting results can feel overwhelming. Solution: Start with the basics. Focus on understanding the fundamental principles before diving into complex calculations. Leverage available resources like online tutorials, training courses, and expert consultations. Many software solutions also simplify the process.
4. Lack of Resources & Expertise: Implementing and maintaining an SPM system requires time, personnel, and potentially software. Limited resources can quickly derail the effort. Solution: Prioritize your efforts. Start with a pilot project on a critical process. Look for opportunities to cross-train existing employees. Consider outsourcing certain aspects of SPM to external consultants.
5. Difficulty Interpreting Results & Taking Action: Generating charts is only half the battle. The real value comes from interpreting the results and translating them into meaningful actions. Solution: Establish clear escalation procedures. Define roles and responsibilities for investigating out-of-control signals. Train personnel on how to identify root causes and implement corrective actions. Don't just chart the data - use it!
Laying the Foundation: Defining Your Process & Identifying Critical Variables
Before diving into data and charts, it's crucial to lay a solid foundation. This begins with a crystal-clear understanding of the process you intend to monitor and precisely what you're trying to achieve. Simply put, you need to know what you're measuring and why.
Process Mapping - Visualize Your Workflow:
Start by creating a detailed process map. This isn't just a flowchart; it should outline every step, input, output, and potential interaction within the process. Don't assume anything - even seemingly minor steps can impact overall performance. Involve the people who actually perform the process. Their firsthand knowledge is invaluable and fosters buy-in from the start.
Identifying Your Vital Few - The KPIs:
Not all variables are created equal. You need to identify the Key Performance Indicators (KPIs) - those few critical variables that truly drive the process's success. Overwhelming yourself with unnecessary data is a recipe for inaction. Use the Pareto Principle (the 80/20 rule) as a guide: typically, 20% of your variables contribute to 80% of the problems. Focus on those.
Examples of KPIs:
- Manufacturing: Defect rate, cycle time, machine utilization, throughput.
- Service: Average handle time, customer satisfaction scores, first call resolution rate.
- Software Development: Bug density, sprint velocity, code coverage.
Defining Process Boundaries - Knowing Your Scope:
Clearly define where your process begins and ends. This prevents scope creep and ensures your SPM efforts remain focused. A well-defined boundary provides context for data interpretation and simplifies troubleshooting.
Documenting Assumptions - Transparency is Key:
Document any assumptions made during process definition and KPI selection. This provides a historical record and facilitates future reviews. Assumptions should be revisited periodically, especially when process changes occur.
Gaining Buy-In - A Collaborative Effort:
Successful SPM requires buy-in from all stakeholders. Involve process owners, operators, and management in the definition and KPI selection phases. Their insights and commitment are essential for long-term sustainability. A process map should be presented and discussed with all relevant personnel to gain consensus and ensure everyone understands the scope of the SPM initiative.
Conclusion: Taking Control of Your Processes with SPM
Statistical Process Monitoring isn't a one-time project; it's a commitment to continuous improvement. By diligently following this checklist - from defining your processes to regularly reviewing and adapting your approach - you're not just reacting to problems; you're proactively shaping your operational success. The insights gained from your SPM system become a powerful foundation for data-driven decisions, leading to increased efficiency, reduced waste, and enhanced product or service quality. Embrace the journey, leverage the power of data, and transform your processes from guesswork to precision. Your team and your bottom line will thank you for it.
Resources & Links
- National Institute of Standards and Technology (NIST) : NIST provides numerous resources on measurement science, statistical process control, and quality management, often foundational to SPM implementation. Explore their publications, guides, and datasets.
- American Society for Quality (ASQ) : ASQ is a leading professional organization for quality professionals. They offer training, certifications, standards, and publications related to statistical process control and process management.
- SAS JMP : JMP is a statistical software package frequently used for SPM analysis, including control charting and data visualization. Offers free trials and resources.
- Minitab : Another popular statistical software package geared toward process improvement and SPM. Similar functionality to JMP, with various tutorials and examples.
- Quality Digest : A website providing news, articles, and resources related to quality management, SPC, and SPM. Good source for industry trends and best practices.
- Statgraphics : Statistical software that supports SPC and process monitoring. Includes control chart examples and tutorials.
- Six Sigma Quality : A website dedicated to Six Sigma principles. Although broader than just SPM, it has related content on process improvement and data analysis.
- Institute for Enterprise Excellence (formerly IQNet) : Offers resources, training, and certifications related to process excellence and performance management. Useful for understanding broader process frameworks.
- Lean Enterprise Institute : Focuses on Lean principles, which often complement SPM. Understanding Lean can help identify processes to monitor.
- iSixSigma : A community and resource hub for Six Sigma and Lean professionals. Has articles and forums on SPM-related topics.
- Process.com : Resource for business process management and improvement. Contains articles and tools for process modeling and monitoring.
- Tableau : Data visualization tool that can be used to create dashboards for SPM. Visualizing control charts and process performance is crucial.
- Microsoft Power BI : Similar to Tableau, Power BI is a data visualization tool that can be used for SPM dashboards and monitoring.
- IBM - Statistical Process Control : IBM offers insights and resources on Statistical Process Control, highlighting its importance for quality and efficiency.
- dummies - Quality Management Introduction : A helpful and straightforward introduction to quality management concepts that underpin SPM. Good for beginners.
- ReliablePlant.com : Focuses on asset reliability and maintenance. SPM principles are applicable to equipment and machinery performance.
Frequently Asked Questions
What is an SPM checklist and why do I need one?
An SPM checklist (Sales Performance Management) is a comprehensive guide outlining the essential steps and tasks to ensure your sales team is performing optimally. It helps you track progress, identify areas for improvement, and maintain consistency across your sales process. It prevents things from falling through the cracks and promotes accountability.
Who is this checklist template for?
This checklist is designed for sales managers, sales leaders, and anyone responsible for overseeing sales performance. It's beneficial for both established sales teams and those just starting out.
Is the checklist template customizable?
Yes! The checklist is a template, meaning it's designed to be adapted to your specific business needs and sales processes. Feel free to add, remove, or modify tasks to fit your unique situation.
Can I share this checklist with my team?
Absolutely! Sharing the checklist fosters transparency and promotes accountability among your sales team.
What does 'KPI' mean in the checklist?
KPI stands for Key Performance Indicator. These are measurable values that demonstrate how effectively you're achieving key business objectives. The checklist uses KPIs to track sales performance and identify areas for improvement.
How often should I review and update the checklist?
We recommend reviewing the checklist at least quarterly, or more frequently if your business or sales processes are undergoing significant changes.
Found this Article helpful?
Manufacturing Management Solution Demo
Stop chasing paperwork and wrestling with disconnected systems! Our solution brings clarity and control to your production process. From standard operating procedures (SOPs) and equipment maintenance to quality control and inventory tracking, we simplify every step.
Related Articles
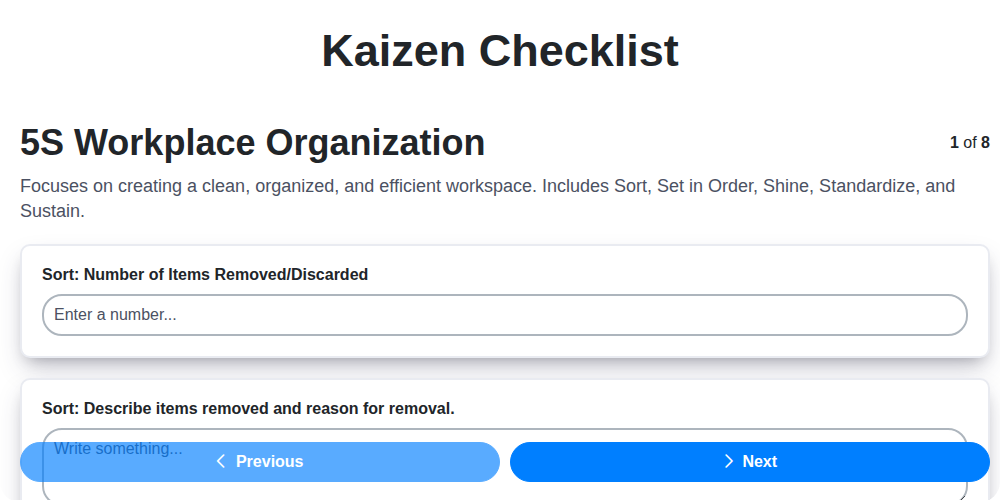
Kaizen Checklist Template: Your Path to Continuous Improvement

Machine Safety Audit Checklist: Your Guide to a Safer Manufacturing Workplace
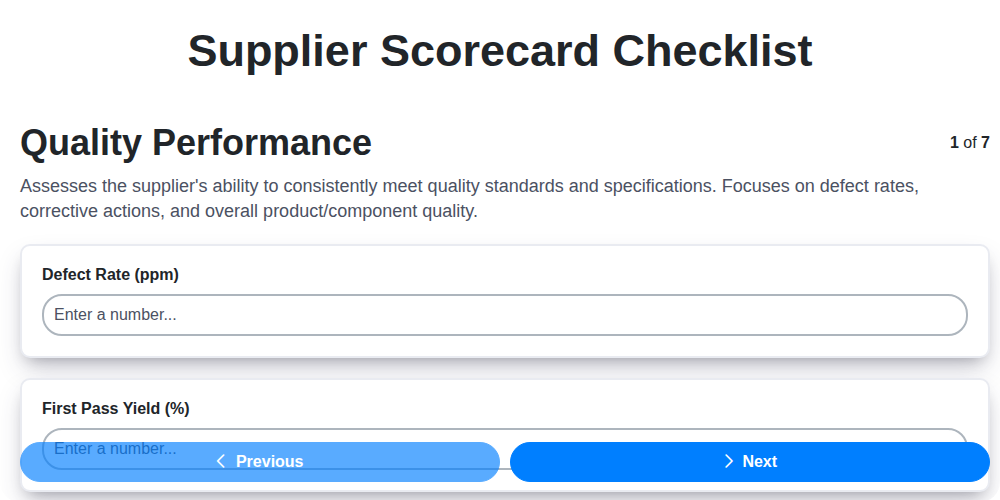
Mastering Supplier Performance: Your Free Supplier Scorecard Checklist Template
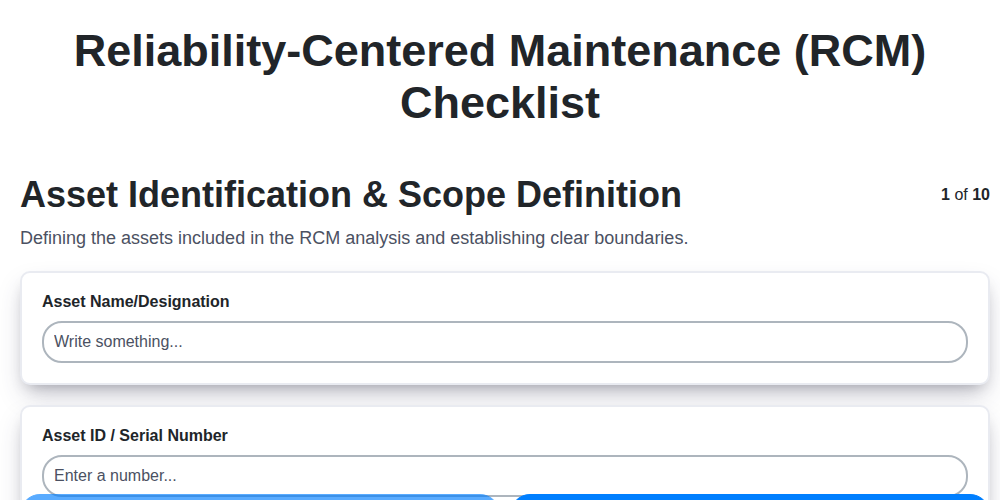
Your Ultimate RCM Checklist Template: A Step-by-Step Guide

LPA Checklist Template: Your Guide to Layered Process Audits

Your Ultimate Lockout/Tagout (LOTO) Checklist Template

Your Ultimate FSC 22000 Checklist Template
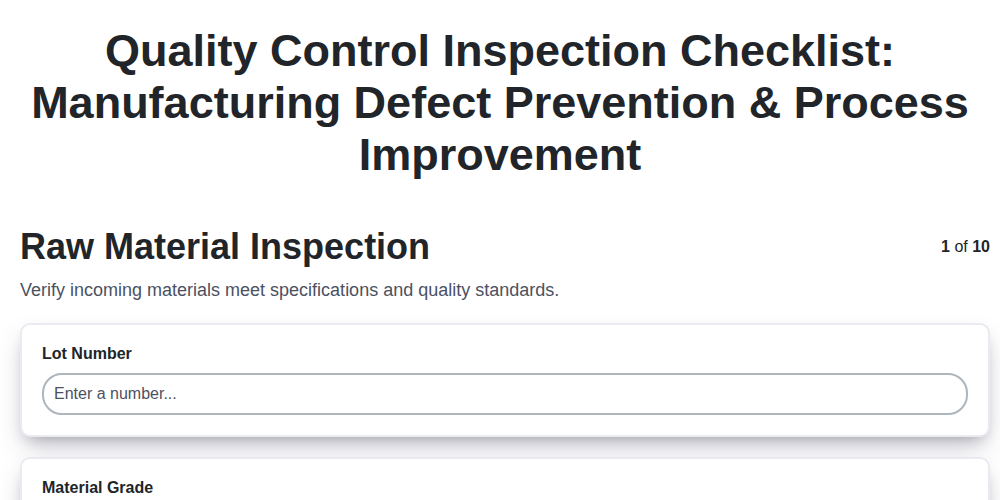
Quality Control Inspection Checklist Template: Prevent Defects & Improve Manufacturing Processes
We can do it Together
Need help with
Manufacturing?
Have a question? We're here to help. Please submit your inquiry, and we'll respond promptly.