Demand Forecasting Accuracy Review: Your Checklist Template
Published: 09/02/2025 Updated: 12/13/2025
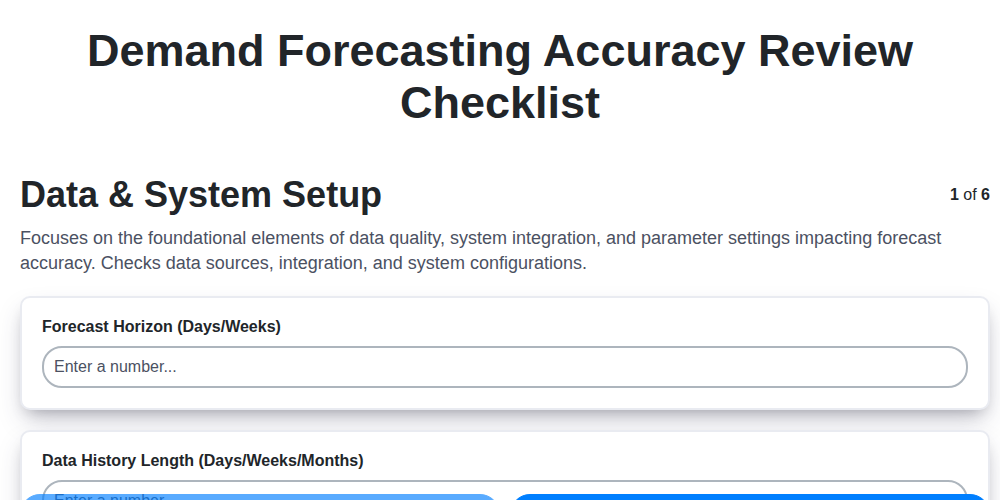
Table of Contents
- Why a Demand Forecasting Accuracy Review Matters
- Step 1: Data Foundation & System Assessment
- Step 2: Evaluating Forecasting Methodologies
- Step 3: Measuring Forecast Error - Key Metrics
- Step 4: Logistics & External Factors to Consider
- Step 5: Fostering Collaboration & Communication
- Step 6: Continuous Improvement & Documentation
- Putting It All Together: Your Action Plan
- Resources & Links
TLDR: Struggling with inaccurate forecasts? This free checklist template guides you through a comprehensive review of your demand forecasting process. From data quality to collaboration and continuous improvement, it helps identify weaknesses, optimize accuracy, and boost your supply chain's performance - download it now and start forecasting smarter!
Why a Demand Forecasting Accuracy Review Matters
Accurate demand forecasting isn't just about numbers; it's about business health. A poorly performing forecast directly impacts your bottom line and operational efficiency. Think about it: consistently overestimating demand leads to excess inventory, storage costs, and potential obsolescence. Conversely, underestimating demand triggers stockouts, lost sales, and frustrated customers.
Beyond the immediate financial implications, a reliable forecasting process fosters agility and resilience. It empowers you to proactively manage supply chain disruptions, optimize resource allocation, and make informed decisions across departments - from production planning to marketing campaigns. Regularly reviewing your forecast accuracy isn't a tedious exercise; it's an investment in a more responsive, profitable, and customer-centric operation. It's about moving from reactive firefighting to proactive planning.
Step 1: Data Foundation & System Assessment
Before you even think about algorithms and sophisticated models, you need to critically examine the bedrock of your forecasting: your data and the systems supporting it. A flawed foundation will crumble under the weight of even the most advanced techniques.
Let's be brutally honest - how clean and complete is your historical data? Are you consistently capturing all relevant data points? It's surprising how often crucial information gets missed or is inconsistent across different systems. Begin with a thorough data audit. This isn't just about identifying missing values; it's about understanding the reasons for those gaps. Was a data source unavailable for a period? Was there a change in reporting methodology?
Next, evaluate the integrity of your data. Outliers can significantly skew forecasts. Establish a clear process for identifying and handling outliers, whether through statistical methods or domain expertise. Don't simply delete them - understand why they occurred. Perhaps they highlight a previously unaddressed issue in production or a sudden shift in customer behavior.
Your systems also need scrutiny. Are you using spreadsheets, a dedicated forecasting software, or a combination? Consider these questions:
- Scalability: Can your system handle increasing data volumes and forecast complexity as your business grows?
- Integration: Can your system integrate with other critical systems (e.g., ERP, CRM, POS)? Data silos lead to inaccurate forecasts.
- Accessibility: Is your data readily accessible to the people who need it, and in a format that's usable?
- Data Governance: Do you have clear data governance policies in place to ensure data quality, security, and compliance?
This initial assessment, however time-consuming, is absolutely essential. Addressing data quality and system limitations upfront will save you countless hours and significantly improve the accuracy of your demand forecasts. Remember, garbage in, garbage out!
Step 2: Evaluating Forecasting Methodologies
Choosing the right forecasting methodology is crucial, but "right" isn't a one-size-fits-all answer. It depends heavily on the product, the data available, and the desired level of accuracy. Let's break down common approaches and when they shine.
Time Series Methods (The Baseline): These are your workhorses - Moving Averages and Exponential Smoothing. They're fantastic for products with stable, predictable demand and historical data stretching back a reasonable period (at least two years is ideal). However, they struggle to incorporate external factors or react to sudden shifts in demand. Use them for: Mature products with consistent sales patterns. Considerations: Simple to implement, but can be slow to adapt.
Causal Forecasting (The Connector): This is where you weave external factors into the equation. Regression models can incorporate price, promotions, competitor activity, economic indicators, and even weather data. They're powerful for capturing demand drivers beyond just past sales. Use them for: Products significantly impacted by marketing campaigns, pricing changes, or seasonal events. Considerations: Requires identifying relevant causal variables and can be more complex to build and maintain. Correlation isn't causation - ensure the relationships are meaningful.
Machine Learning (The Advanced): Algorithms like Random Forests, Gradient Boosting, and Neural Networks can unearth complex, non-linear relationships in your data. They can adapt to changing patterns and handle a high volume of variables. Use them for: Products with volatile demand, numerous influencing factors, or a desire to push accuracy to the absolute limit. Considerations: Requires substantial data, specialized expertise, and potentially significant computational resources. Interpretability can be a challenge - understanding why the model makes certain predictions is vital.
Hybrid Approaches (The Best of Both Worlds): Don't be afraid to combine methods! A common tactic is to use a Time Series model for the baseline forecast and then adjust it based on a Causal model's predictions for promotional events. This leverages the strengths of both.
Benchmarking & Backtesting: Always backtest any new methodology against historical data. How would the model have performed in the past? Compare its accuracy to your existing methods using metrics like Mean Absolute Error (MAE) and Mean Squared Error (MSE) to determine if the investment in a new method is worthwhile.
Step 3: Measuring Forecast Error - Key Metrics
Knowing how wrong your forecast is is just as crucial as creating it. Simply generating numbers isn't enough; you need to quantify the accuracy (or lack thereof) and understand why errors occur. Here's a breakdown of essential metrics to track, along with what they tell you:
1. Mean Absolute Error (MAE): This metric calculates the average of the absolute differences between your forecasted values and the actual demand. It's straightforward to understand and provides a general sense of forecast error magnitude. A lower MAE indicates better accuracy. However, it treats all errors equally, regardless of size.
2. Mean Squared Error (MSE): MSE calculates the average of the squared differences between forecast and actual values. Squaring the errors significantly penalizes larger errors, making it more sensitive to outliers. It's useful when you want to minimize the impact of significant forecast misses. The resulting value can be large and difficult to interpret directly, often requiring comparison with other MSE values.
3. Mean Absolute Percentage Error (MAPE): Perhaps the most widely used metric, MAPE expresses the average absolute error as a percentage of actual demand. This makes it easier to compare forecast accuracy across different products or time periods with varying demand volumes. However, be cautious! MAPE is heavily influenced by periods of low demand - a single small error during a low-demand period can dramatically inflate the MAPE.
4. Bias (Mean Error): This metric tells you if your forecast is consistently overestimating or underestimating demand. A positive bias indicates a tendency to overestimate, while a negative bias shows a tendency to underestimate. Addressing bias is crucial for optimizing inventory levels and minimizing stockouts or excess inventory.
Beyond the Numbers: While these metrics provide a quantifiable view of forecast error, always combine them with qualitative analysis. Investigate the reasons behind significant errors, and continuously refine your forecasting process to improve accuracy. Don't just chase a lower MAPE; strive for a robust and insightful forecasting system.
Step 4: Logistics & External Factors to Consider
Accurate demand forecasting isn't solely about crunching data; it's about understanding the broader landscape your products navigate to reach the customer. Logistics and external factors introduce a layer of complexity that, if ignored, can render even the most sophisticated forecasting models inaccurate. Let's delve into critical considerations:
Lead Times and Supply Chain Reliability: Beyond just calculating demand, you must factor in lead times. Longer lead times necessitate larger safety stocks to buffer against fluctuations. Are those lead times stable? A sudden supplier delay due to unforeseen circumstances, material shortages, or even geopolitical events can dramatically impact your ability to meet demand, and needs to be accounted for during forecast adjustments. Regularly assess supplier performance and proactively address potential vulnerabilities.
Transportation Disruptions: Transportation isn't always predictable. Increased fuel costs, port congestion, driver shortages, and natural disasters can all create bottlenecks that delay shipments and impact availability. Factor potential transportation disruptions into your forecasts and have contingency plans in place.
Seasonality and Promotional Impacts: While seasonality is often incorporated into forecasting models, consider the amplification of these effects through promotions. A heavily promoted item during peak season can experience demand surges that exceed standard seasonality patterns.
External Economic Conditions: Broader economic trends - inflation, interest rates, consumer confidence - significantly influence purchasing behavior. While predicting the economy is notoriously difficult, staying informed about these trends and their potential impact on your products is crucial.
Geopolitical Instability: Events in one region of the world can have ripple effects across global supply chains. Monitor geopolitical developments that could impact sourcing, manufacturing, or distribution.
Weather Patterns: For many industries (agriculture, apparel, outdoor recreation), weather plays a significant role in demand. Account for seasonal weather patterns and potential for extreme events.
Regulatory Changes: New regulations or tariffs can impact pricing, sourcing, and distribution, affecting demand patterns. Stay abreast of relevant regulatory updates.
Ultimately, integrating these logistical and external factors requires a holistic view of your supply chain and a willingness to adapt your forecasts based on real-world events.
Step 5: Fostering Collaboration & Communication
Effective demand forecasting isn't a solitary endeavor; it thrives on open communication and seamless collaboration. Siloed departments often lead to inaccurate forecasts and reactive decision-making. Here's how to foster a collaborative forecasting environment:
Break Down Departmental Walls: Schedule regular meetings (weekly or bi-weekly are often beneficial) between the forecasting team, sales, marketing, and relevant members of the supply chain and finance departments. These aren't just status updates; they're forums for sharing insights, addressing concerns, and building a shared understanding of the factors influencing demand.
Sales & Marketing Alignment is Key: Sales teams possess invaluable insights into customer behavior, upcoming promotions, and potential market shifts. Marketing understands the impact of campaigns and brand initiatives. Make sure forecasts are informed by this ground-level intelligence. Proactively solicit their input, not just reactively receiving it.
Forecast Consensus - A Shared Responsibility: Consider implementing a formal forecast consensus process. This could involve multiple team members developing independent forecasts and then reconciling them to arrive at a final, more robust projection. This process highlights differing perspectives and fosters a sense of ownership.
Transparent Communication - A Foundation of Trust: Clearly and consistently communicate forecast assumptions, methodologies, and potential risks to all relevant stakeholders. Explain why a forecast is what it is, not just present the numbers. This transparency builds trust and encourages valuable feedback.
Feedback Loops - Continuous Improvement: Establish a structured mechanism for stakeholders to provide feedback on forecast accuracy. Actively solicit their opinions and incorporate their insights into future forecasting cycles. Don't just ask if the forecast was accurate; ask why and what could be done better.
Step 6: Continuous Improvement & Documentation
Forecasting isn't a "set it and forget it" activity. The business landscape is constantly shifting - new products launch, customer preferences evolve, market conditions fluctuate, and unforeseen disruptions (like pandemics!) can throw even the most sophisticated models off course. To maintain accuracy and maximize efficiency, your forecasting process needs to be a living, breathing system, continuously improving and well-documented.
Establishing a Review Cycle: Schedule regular, recurring reviews-ideally quarterly, but annually at a minimum-to assess forecast performance. These reviews should involve key stakeholders from sales, marketing, supply chain, and finance. Use the error metrics tracked in Step 3 as the foundation for these discussions. Don't just look at the numbers; actively investigate significant deviations and identify root causes.
Feedback is Gold: Create a formal feedback loop. Encourage your sales and marketing teams to provide insights into upcoming promotions, anticipated market shifts, or competitive pressures. Supply chain partners can contribute valuable information about potential disruptions or capacity constraints. A simple suggestion box or a regular meeting dedicated to forecast feedback can yield surprising and valuable insights.
Model Maintenance & Retraining: Data decays. Relationships change. Your forecasting models need to be regularly retrained with fresh data to remain relevant. Establish a process for automating this retraining, if possible. When introducing new products or entering new markets, build in flexibility to quickly adapt and adjust your methodology.
Documentation is Your Safety Net: Thorough documentation is absolutely critical. Clearly outline all assumptions, data sources, methodologies, and model parameters. This documentation serves multiple purposes: it facilitates knowledge transfer when team members change, it provides a baseline for comparison during review cycles, and it helps troubleshoot errors when things go wrong. Think of it as your forecasting "recipe book" - essential for consistency and repeatability.
Lessons Learned Repository: Don't let those hard-earned lessons disappear! Create a central repository to capture key takeaways from each review cycle. This repository should include descriptions of errors, root causes, corrective actions taken, and the impact of those actions on future forecast accuracy. Sharing these lessons across the organization fosters a culture of continuous learning and helps prevent repeating past mistakes.
Putting It All Together: Your Action Plan
Implementing these review points isn't about a single, massive overhaul. It's about building a culture of continuous improvement. Here's a phased approach to get you started:
Phase 1: Quick Wins (1-2 Weeks)
- Data Audit: Spend a week focused solely on data quality. Identify and correct the most glaring errors. Even a small improvement here can have a significant impact.
- Stakeholder Interviews: Conduct brief interviews with sales, marketing, and operations teams. Understand their current perception of forecast accuracy and identify pain points.
- Metric Baseline: Establish a baseline for your key forecast error metrics. This gives you a clear starting point to measure progress.
Phase 2: Targeted Improvements (4-6 Weeks)
- Method Experimentation: Select 2-3 product categories or regions and experiment with alternative forecasting methods. Track and compare results.
- Collaboration Bridge: Implement a simple communication channel (e.g., weekly brief meetings) between sales, marketing, and forecasting teams.
- Documentation Kickstart: Begin documenting your current forecasting processes - even if it's just a high-level overview.
Phase 3: Optimization & Automation (Ongoing)
- Model Retraining Schedule: Establish a regular schedule for retraining your forecasting models (e.g., monthly, quarterly).
- Process Automation: Explore opportunities to automate repetitive tasks, such as data cleansing and report generation.
- Continuous Feedback Loop: Formalize a process for gathering feedback from stakeholders and incorporating it into your forecasting process.
Remember, this is a journey, not a destination. Regularly revisit these steps and adapt your approach based on your evolving business needs.
Resources & Links
- Tableau : Data visualization and analytics platform. Useful for visually assessing forecast accuracy, identifying trends, and building dashboards to track performance. Offers features to integrate with forecasting models and data sources.
- SAS : Provides advanced analytics, machine learning, and statistical modeling tools. SAS can be used to build and evaluate sophisticated demand forecasting models, especially when dealing with large datasets and complex factors.
- Oracle : Offers a suite of business applications, including supply chain management and planning tools. Useful for integrating forecasting into broader business processes and leveraging advanced planning capabilities.
- Anaplan : Connected Planning platform - often used for demand planning, sales performance management, and financial planning. Provides collaborative features for better forecasting.
- Microsoft Dynamics 365 : Suite of business applications including supply chain management and forecasting modules. Can integrate forecasts with other business functions like sales and finance.
- IBM : Provides a range of data science and AI tools including forecasting solutions. Useful for implementing machine learning models and advanced forecasting techniques.
- McKinsey & Company : Management consulting firm with articles and insights on demand planning and supply chain management. Can provide strategic guidance on improving forecasting accuracy.
- Bain & Company : Another management consulting firm with thought leadership on supply chain and forecasting. Look for articles on best practices and common pitfalls.
- Deloitte : Provides consulting services and insights around demand forecasting and supply chain optimization. Valuable for understanding industry trends and potential solutions.
- Statunit : Specializes in inventory optimization and demand forecasting, providing software and consulting services. Useful for more targeted advice on forecasting methodologies and software selection.
- Supply Chain Brain : Online publication covering supply chain management, including demand planning and forecasting. Provides news, articles, and case studies.
- APICS (ASCM) : Professional organization focused on supply chain and operations management. Offers certifications, training, and resources for improving forecasting skills. ASCM is the new name for APICS.
- Forecast Analytics : Offers resources and software focused specifically on demand forecasting and inventory optimization. A resource for those looking to deep dive into forecasting techniques.
- Predictive Analytics Today : Website covering predictive analytics and machine learning. Provides information about forecasting algorithms and implementation strategies.
Frequently Asked Questions
What is demand forecasting and why is accuracy important?
Demand forecasting is the process of predicting future customer demand for products or services. Accurate forecasting is crucial for optimizing inventory levels, reducing waste, improving production planning, and ultimately, maximizing profitability and customer satisfaction. Inaccurate forecasts can lead to stockouts, overstocking, and lost sales.
Who is this checklist template for?
This checklist template is designed for anyone involved in demand forecasting, including supply chain managers, inventory planners, business analysts, and anyone responsible for ensuring forecast accuracy. It's adaptable for various industries and business sizes.
What does the checklist template cover?
The checklist template covers key areas of demand forecasting accuracy, including data assessment, model selection, parameter tuning, error measurement, and continuous improvement processes. It helps evaluate existing processes and identify areas for improvement.
What types of forecasting methods are addressed in the article/checklist?
The article touches upon various forecasting methods, including moving averages, exponential smoothing, regression analysis, and time series decomposition. The checklist provides a framework to evaluate their suitability and performance based on your specific data and business context. It's not a guide on *how* to build each method, but rather a guide on *when* they are appropriate and how to evaluate their accuracy.
How can I customize the checklist template?
The checklist is designed to be adaptable. You can add, remove, or modify items to align with your organization's specific forecasting processes and business needs. Consider adding items relevant to your industry or the specific products you're forecasting.
What is MAPE and why is it mentioned in the checklist?
MAPE (Mean Absolute Percentage Error) is a commonly used metric to evaluate forecasting accuracy. It represents the average percentage difference between the forecasted values and the actual values. The checklist includes it as a key performance indicator to track and benchmark forecasting performance.
The checklist mentions 'seasonality'. What does that refer to?
Seasonality refers to predictable patterns in demand that occur within a specific time period (e.g., higher sales of ice cream in the summer, increased toy sales during the holiday season). Forecasting models need to account for these seasonal fluctuations to improve accuracy.
How often should I review and update my demand forecasts?
The frequency of review and updates depends on the volatility of your demand patterns and the impact of inaccurate forecasts. Generally, it's recommended to review forecasts regularly (e.g., weekly, monthly, quarterly) and update them as new data becomes available or significant changes occur in the market.
Where can I find more resources on demand forecasting?
The article may include links to external resources like industry publications, online courses, and forecasting software vendors. A good starting point is searching for 'demand forecasting best practices' or 'time series analysis' online.
Found this Article helpful?
Logistics Management Solution Demo
Tired of shipping delays, lost packages, and inefficient routes? ChecklistGuro's Work OS platform streamlines your entire logistics operation, from warehouse management and order fulfillment to route optimization and delivery tracking. Gain real-time visibility, reduce costs, and improve customer satisfaction. Learn how ChecklistGuro can transform your logistics business!
Related Articles
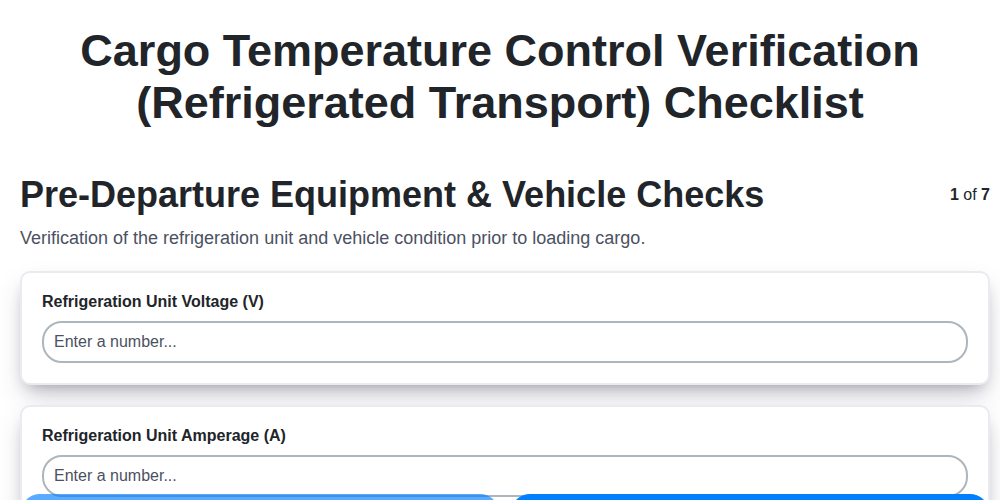
The Ultimate Refrigerated Cargo Temperature Control Checklist Template
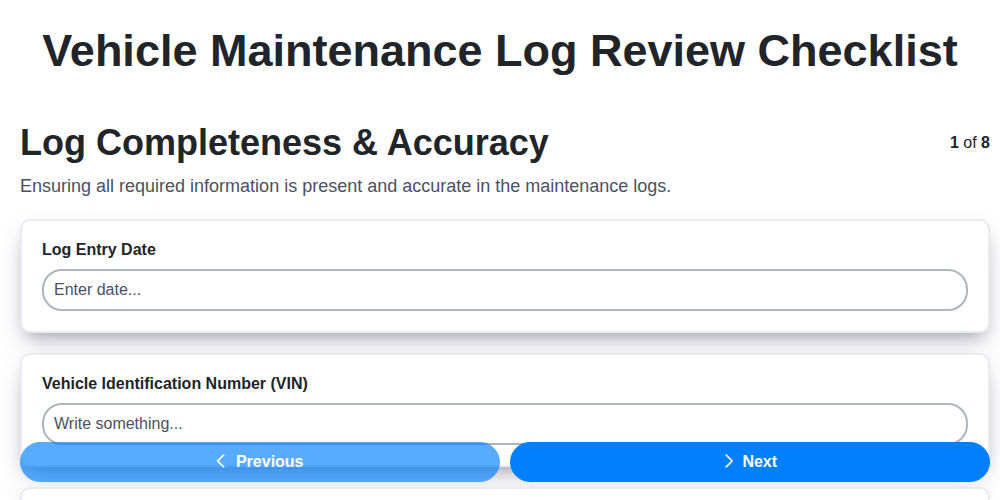
Mastering Your Fleet: A Vehicle Maintenance Log Review Template
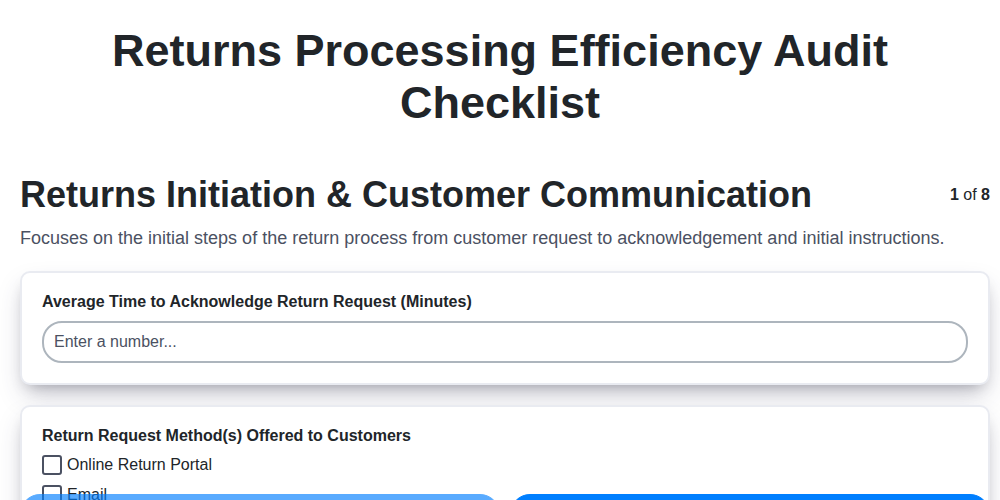
Master Your Returns: The Ultimate Returns Processing Efficiency Audit Checklist
Data Privacy Policy Compliance: Your Essential Checklist Template
Delivery Confirmation Audit: Your Checklist Template for Process Excellence
Your Pallet Inspection & Maintenance Checklist Template
Fuel Efficiency Monitoring: Your Checklist Template for Savings
Supply Chain Risk Assessment: Your Essential Checklist Template
We can do it Together
Need help with
Logistics?
Have a question? We're here to help. Please submit your inquiry, and we'll respond promptly.