Mastering Efficiency: A Step-by-Step Guide to the Inventory Turnover Ratio Analysis Process Workflow
Published: 06/04/2026 Updated: 06/05/2026
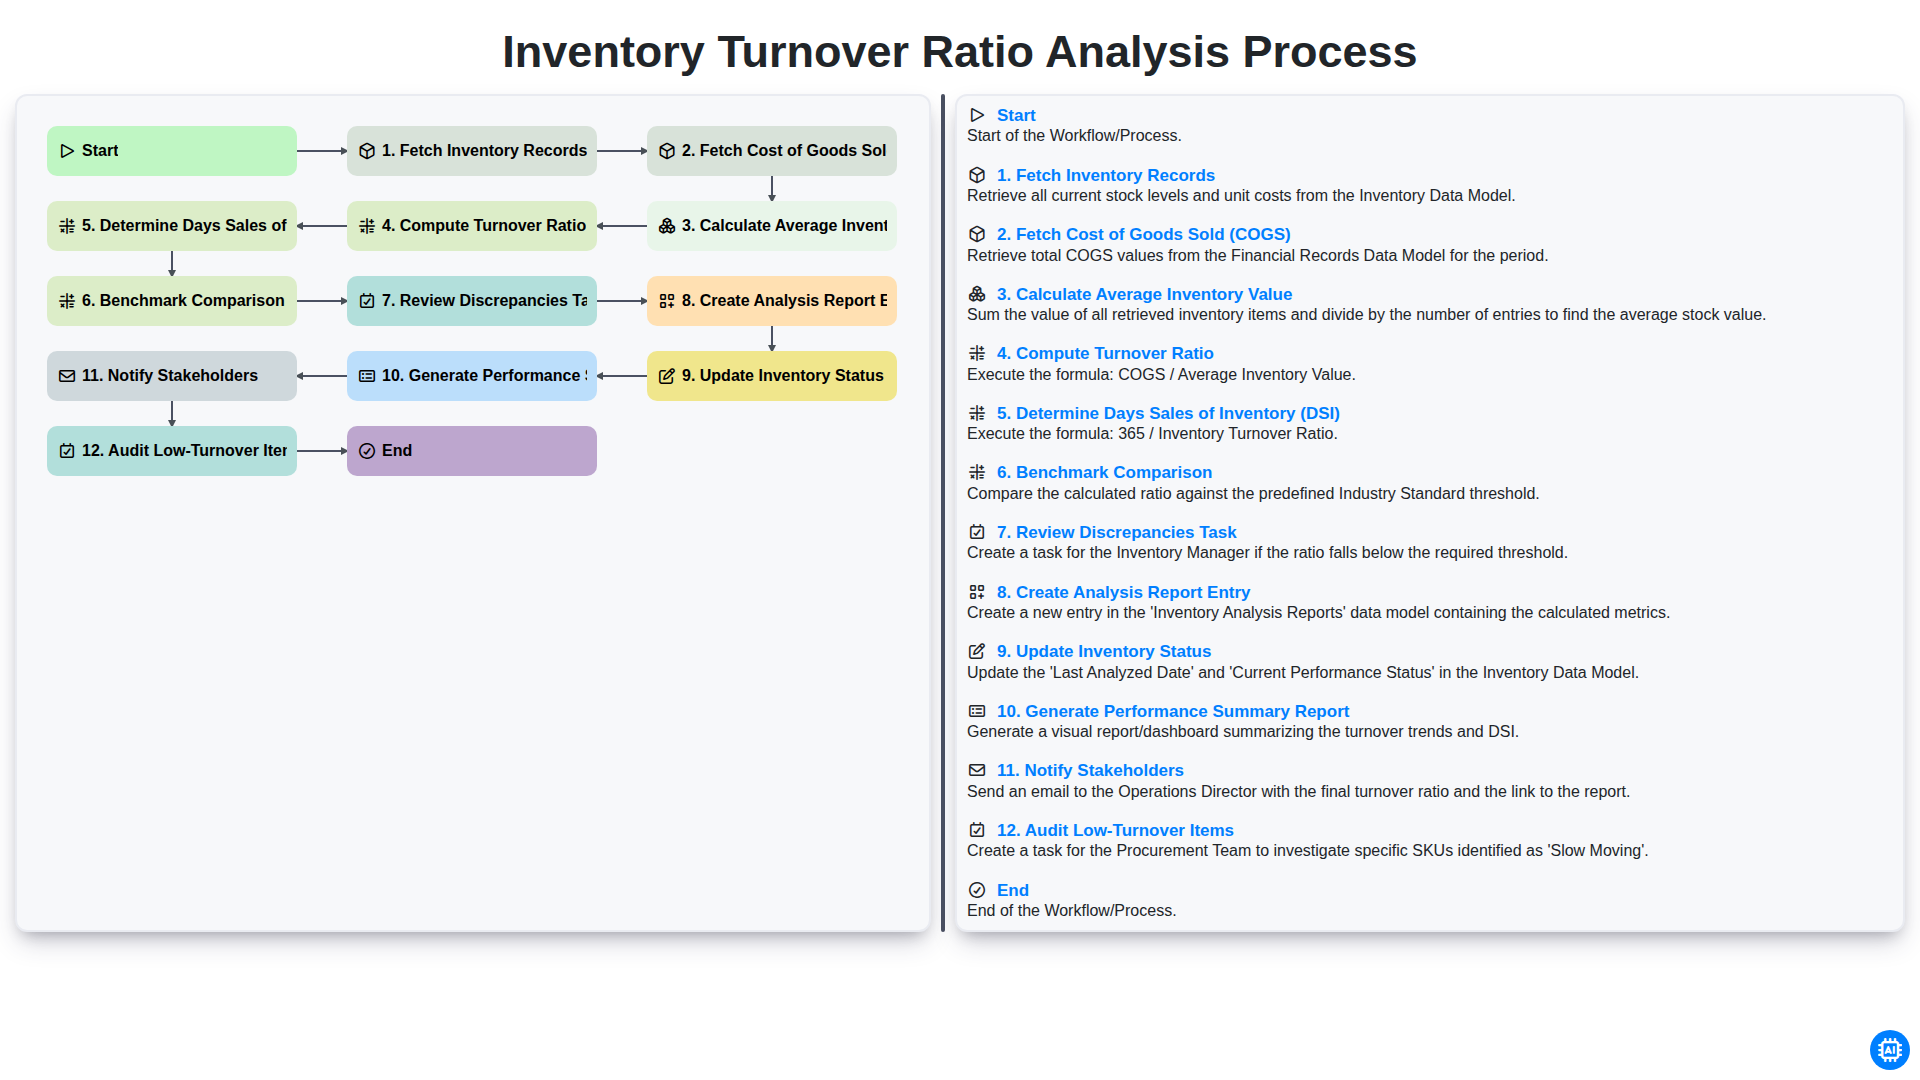
Table of Contents
- Introduction to Inventory Turnover Ratio Analysis
- Phase 1: Data Collection and Foundational Metrics
- Step 1: Fetching Comprehensive Inventory Records
- Step 2: Fetching Cost of Goods Sold (COGS)
- Phase 2: Performing the Core Calculations
- Step 3: Calculating Average Inventory Value
- Step 4: Computing the Inventory Turnover Ratio
- Step 5: Determining Days Sales of Inventory (DSI)
- Phase 3: Evaluation and Comparative Analysis
- Step 6: Benchmark Comparison and Industry Context
- Step 7: Identifying and Reviewing Discrepancies
- Phase 4: Documentation and System Updates
- Step 8: Creating the Analysis Report Entry and Updating Inventory Status
- Phase 5: Reporting and Proactive Inventory Management
- Step 9: Generating Performance Summaries and Notifying Stakeholders
- Step 10: Auditing Low-Turnover Items for Optimization
- Resources & Links
TLDR: Learn how to optimize your supply chain using our streamlined Inventory Turnover Ratio Analysis workflow. This guide breaks down the complete end-to-end process-from fetching COGS and calculating average inventory to benchmarking performance and auditing low-turnover items-to help you identify inefficiencies, reduce carrying costs, and maintain a healthy cash flow.
Introduction to Inventory Turnover Ratio Analysis
In the fast-paced world of supply chain management, efficiency is the difference between profitability and wasted capital. One of the most critical metrics for evaluating this efficiency is the Inventory Turnover Ratio. At its core, this ratio measures how many times a company has sold and replaced its inventory during a specific period. A high ratio typically indicates strong sales and effective inventory management, while a low ratio may signal overstocking, obsolescence, or a decline in product demand.
However, simply knowing the final number isn't enough to drive meaningful business decisions. To truly unlock the value of this metric, businesses must move beyond basic calculation and implement a structured Inventory Turnover Ratio Analysis Process. This involves a systematic workflow-ranging from fetching accurate COGS data to auditing low-turnover items-to ensure that every data point leads to an actionable insight. By following a rigorous analytical framework, organizations can transform raw inventory data into a strategic roadmap for optimizing cash flow, reducing carrying costs, and enhancing overall operational performance.
Phase 1: Data Collection and Foundational Metrics
The initial stage of the Inventory Turnover Ratio Analysis Process is critical, as the accuracy of your final insights depends entirely on the integrity of your underlying data. This phase focuses on gathering the raw inputs and establishing the baseline metrics required to drive the calculation.
The process begins with Fetching Inventory Records to ensure you have a complete and up-to-date snapshot of your current stock levels. Once the physical stock data is gathered, the next vital step is Fetching Cost of Goods Sold (COGS) for the specific period being analyzed. This represents the direct costs attributable to the production or purchase of the goods sold during that timeframe.
With these two primary datasets in hand, the workflow moves into the foundational calculation phase. You will Calculate the Average Inventory Value-typically by averaging the beginning and ending inventory for the period-to smooth out fluctuations caused by seasonal stock changes. Once the average value is established, you can finally Compute the Turnover Ratio by dividing the COGS by the Average Inventory Value. This single figure serves as the cornerstone of the entire analysis, providing the first glimpse into how efficiently capital is moving through your warehouse.
Step 1: Fetching Comprehensive Inventory Records
The foundation of a reliable inventory turnover analysis lies in the accuracy of your initial data. The first step in the workflow is to Fetch Inventory Records, which involves extracting a complete and up-to-date dataset of all stock currently held within your warehouse or retail locations.
To ensure the analysis is meaningful, this process must go beyond simply looking at total quantities. You must pull detailed information including SKU numbers, unit costs, and current stock levels. It is crucial to ensure that this data is pulled from a single, synchronized source-ideally your ERP or Inventory Management System (IMS)-to prevent data siloing, where different departments are looking at conflicting numbers. A thorough fetch at this stage ensures that every item, from high-velocity bestsellers to slow-moving seasonal goods, is accounted for, providing the necessary granularity for the calculations that follow.
Step 2: Fetching Cost of Goods Sold (COGS)
Once the inventory records have been successfully gathered, the next critical step in the workflow is to fetch the Cost of Goods Sold (COGS). While inventory records tell you what is currently sitting in your warehouse, the COGS represents the direct costs attributable to the production or purchase of the goods that were actually sold during a specific period.
To ensure your turnover analysis is accurate, this step requires pulling data from your sales ledger or accounting software. This includes not just the raw purchase price of the items, but also any additional costs necessary to get the products ready for sale, such as freight-in, handling, and manufacturing overhead. Without precise COGS data, your turnover ratio will fail to reflect the true movement of capital, leading to skewed insights. Accurate retrieval of this figure is the foundation upon which the rest of the mathematical calculations in this workflow depend.
Phase 2: Performing the Core Calculations
Once the necessary data has been gathered, the process moves into the analytical engine of the workflow. This phase is where raw data transforms into actionable financial intelligence. To achieve an accurate assessment of how efficiently your capital is being utilized, you must execute a precise sequence of mathematical steps:
- Compute Turnover Ratio: Using the figures gathered in the previous phase, divide the Cost of Goods Sold (COGS) by the Average Inventory Value. This result provides a clear numerical value representing how many times your entire inventory is sold and replaced over a specific period.
- Determine Days Sales of Inventory (DSI): To translate the ratio into a more intuitive metric, calculate the DSI by dividing the number of days in the period by your turnover ratio. This tells you exactly how many days, on average, an item sits in your warehouse before being sold, allowing you to identify potential bottlenecks in your supply chain.
Step 3: Calculating Average Inventory Value
Once you have retrieved your inventory records and identified your Cost of Goods Sold (COGS), the next critical step is to determine the Average Inventory Value.
Calculating the average is far more accurate than using a single point-in-time snapshot, as inventory levels fluctuate constantly due to seasonal demands, supplier lead times, and sales cycles. Using only the ending inventory figure can lead to a skewed ratio that doesn't reflect the true movement of goods throughout the period.
To perform this calculation, use the following formula:
$$\text{Average Inventory Value} = \frac{\text{Beginning Inventory} + \text{Ending Inventory}}{2}$$
By averaging the value of your inventory at the start of the period with the value at the end, you smooth out the noise caused by temporary stockouts or bulk shipments. This provides a stable baseline that represents the typical amount of capital tied up in your warehouse, ensuring that the subsequent turnover ratio reflects a realistic view of your operational efficiency.
Step 4: Computing the Inventory Turnover Ratio
Once you have established your average inventory value, the next critical step in the workflow is to Compute the Turnover Ratio. This calculation serves as the core metric of your analysis, providing a clear numerical value that represents how many times your company has sold and replaced its inventory during a specific period.
To perform this calculation, use the following formula:
$$\text{Inventory Turnover Ratio} = \frac{\text{Cost of Goods Sold (COGS)}}{\text{Average Inventory Value}}$$
By dividing the COGS by your average inventory, you transform raw data into a functional efficiency metric. A high ratio typically indicates strong sales performance and effective inventory management, whereas a low ratio may signal overstocking, obsolescence, or a decline in product demand. This single figure acts as the foundation for all subsequent steps in the workflow, including calculating your Days Sales of Inventory (DSI) and performing benchmark comparisons.
Step 5: Determining Days Sales of Inventory (DSI)
Once you have computed your turnover ratio, the next logical step is to translate that figure into a more intuitive metric: Days Sales of Inventory (DSI). While the turnover ratio tells you how many times your inventory is replaced over a period, DSI tells you exactly how many days, on average, it takes to turn your stock into sales.
To calculate this, you divide the number of days in the period (e.g., 365 days for a year) by your Inventory Turnover Ratio. For example, if your turnover ratio is 12, your DSI would be 30 days. This metric is crucial because it provides a clear, time-based window into your operational efficiency. A rising DSI indicates that products are sitting in the warehouse longer, signaling potential overstocking or slowing demand, whereas a lower DSI suggests a lean, efficient supply chain. By mastering this calculation, you move from simply observing patterns to understanding the specific temporal rhythm of your cash flow.
Phase 3: Evaluation and Comparative Analysis
Once the core mathematical computations are complete, the focus shifts from raw data to actionable intelligence. This phase is where the numbers are transformed into strategic insights through Benchmark Comparison. To understand if your turnover ratio is healthy, you must compare it against industry standards and your company's historical performance; a high ratio might indicate efficiency, but if it is too high, it could signal frequent stockouts and lost sales opportunities.
During this stage, the Review Discrepancies Task is critical. You must scrutinize any anomalies where the calculated ratios deviate significantly from expected trends, ensuring that data errors or seasonal fluctuations are not masking underlying operational issues. Following this validation, the process moves into documentation and communication. Each finding is codified by performing a Create Analysis Report Entry, ensuring a permanent digital trail of the findings.
The final steps of this phase involve closing the loop on the operational cycle by performing an Update Inventory Status to reflect current stock health and executing an Audit Low-Turnover Items task to identify dead stock that requires liquidation or promotional intervention. To ensure the entire organization benefits from these insights, the process concludes by generating a Performance Summary Report and executing the Notify Stakeholders step, ensuring that procurement, finance, and warehouse managers are aligned on the necessary adjustments to the supply chain strategy.
Step 6: Benchmark Comparison and Industry Context
Once you have computed your turnover ratio, the raw number remains incomplete without context. A ratio of 5 might look impressive in isolation, but if your industry average is 12, your inventory management is actually lagging. This step involves comparing your calculated ratio against historical company data and established industry benchmarks.
To perform an effective benchmark comparison, you must evaluate two primary dimensions:
- Internal Benchmarking: Compare your current ratio against your own performance from previous quarters or years. This helps you identify whether your inventory efficiency is improving or deteriorating over time, regardless of market fluctuations.
- External Benchmarking: Align your results with industry standards. For instance, a grocery retailer will naturally have a much higher turnover ratio than a luxury car dealership due to the perishability of goods and sales velocity. Comparing yourself to competitors or industry medians helps you identify if your slow turnover is a result of poor management or simply a characteristic of your specific market niche.
By placing your numbers in this broader context, you transform a simple calculation into a strategic diagnostic tool that reveals whether your supply chain is truly optimized.
Step 7: Identifying and Reviewing Discrepancies
Once the turnover ratio has been computed and the Days Sales of Inventory (DSI) determined, the next critical phase is the Review Discrepancies Task. Data-driven analysis is only as reliable as the integrity of the underlying data. In this stage, the focus shifts from mathematical calculation to investigative verification.
During this step, you must scrutinize the results for any anomalies that could skew your findings. For instance, a sudden spike or drop in the turnover ratio might not indicate a shift in market demand, but rather an error in how inventory levels were recorded or an omission in the COGS data. You should cross-reference the calculated figures against physical stock counts and recent purchase orders to ensure that ghost inventory or unrecorded sales are not bloating your averages.
By proactively identifying discrepancies between the digital records and physical reality, you prevent flawed insights from flowing into your final report. This investigative layer ensures that when you move toward benchmarking and reporting, your conclusions are based on a single source of truth, allowing for confident decision-making.
Phase 4: Documentation and System Updates
Once the analytical computations are complete, the final phase focuses on integrating these insights into your business intelligence ecosystem. This stage is critical to ensure that the data doesn't just live in a static report, but actively drives operational changes.
The process begins with the Creation of an Analysis Report Entry, where the calculated turnover ratio and DSI are logged into your historical database for longitudinal tracking. Following this, you must Update Inventory Status within your ERP or inventory management software; this ensures that items identified as slow-moving are flagged for liquidation or reordering adjustments.
To finalize the workflow, the system must Generate a Performance Summary Report that synthesizes the findings into an actionable format. This report is then used to Notify Stakeholders, ensuring that procurement, finance, and warehouse managers are aligned on the current stock health. Finally, the process concludes with an Audit of Low-Turnover Items, a proactive deep-dive into specific SKUs that may require promotional strategies or disposal to prevent capital from being tied up in stagnant stock.
Step 8: Creating the Analysis Report Entry and Updating Inventory Status
Once the computation is complete and any discrepancies have been addressed, the workflow moves into the documentation and synchronization phase. This stage is critical for ensuring that the insights gained from the turnover analysis are transformed into actionable data within your management system.
First, you will Create an Analysis Report Entry. This involves logging the calculated turnover ratio, the DSI, and the specific period covered into your central database or ERP system. A detailed entry serves as a historical record, allowing you to track trends over months or even years. Without this structured logging, the analysis remains a one-off event rather than a continuous tool for strategic decision-making.
Immediately following the report entry, you must Update Inventory Status. Based on the findings of your analysis, certain inventory items may need status changes. For example, if the ratio indicates a significant slowdown, you might flag specific SKUs as Slow-Moving or At Risk. Conversely, high-turnover items might be flagged for Reorder Review. By updating these statuses in real-time, you ensure that your procurement and warehouse teams are always working with the most accurate, intelligence-driven data, preventing the common pitfall of overstocking stagnant goods.
Phase 5: Reporting and Proactive Inventory Management
Once the core computations are complete, the final phase focuses on transforming raw data into actionable intelligence. The workflow transitions from calculation to communication through the Creation of Analysis Report Entries, where the computed ratios are documented alongside their corresponding time periods. To ensure the data remains a living part of your operations, the Inventory Status is updated immediately, ensuring that your management dashboard reflects the most current turnover health.
The goal of this phase is to move beyond mere numbers and toward strategic oversight. This involves the Generation of a Performance Summary Report, which synthesizes the turnover trends into a high-level overview for management. To ensure transparency and alignment across the organization, the system then triggers a process to Notify Stakeholders, ensuring that procurement, finance, and warehouse teams are all working from the same analytical truth.
However, the process does not end with distribution; it concludes with a critical feedback loop. The workflow initiates a Review of Discrepancies Task to investigate any mathematical or data-entry anomalies, followed by a targeted Audit of Low-Turnover Items. By specifically scrutinizing stagnant stock, the organization can initiate liquidation or markdown strategies, preventing capital from being trapped in obsolete inventory and ensuring the supply chain remains lean and efficient.
Step 9: Generating Performance Summaries and Notifying Stakeholders
Once the analysis is complete and the individual data points have been processed, the workflow moves into its final, most critical phase: Generating Performance Summary Reports and Notifying Stakeholders.
Data analysis is only as valuable as its ability to drive action. At this stage, the system aggregates the computed turnover ratios and DSI metrics into a high-level, digestible summary report. Rather than overwhelming management with raw spreadsheets, this report highlights key performance indicators (KPIs), identifies trends over time, and calls attention to significant deviations from established benchmarks.
The final step in the workflow is the automated Notification of Stakeholders. To ensure the insights lead to real-world inventory adjustments, the system triggers alerts to relevant department heads-such as Procurement, Finance, and Warehouse Operations. By pushing these summaries directly to decision-makers, you ensure that the insights gained from the turnover analysis are integrated into the company's broader operational strategy immediately, closing the loop between data discovery and strategic execution.
Step 10: Auditing Low-Turnover Items for Optimization
Once the analysis is complete, the final and perhaps most critical step is to transition from data review to actionable strategy. Auditing low-turnover items involves deep-diving into the specific SKUs that have been identified as slow-moving or dead stock during the benchmarking phase. This isn't just about identifying what isn't selling, but understanding why.
During this audit, examine the lifecycle of these specific products: Is the low turnover due to seasonal shifts, overstocking errors, or perhaps an outdated product design? Identifying these patterns allows you to implement targeted interventions, such as strategic discounting, bundling slow-moving items with high-demand products, or simply phasing out underperforming stock to free up valuable warehouse space. By proactively auditing these items, you transform your turnover ratio from a mere metric into a powerful tool for continuous inventory optimization and improved cash flow.
Resources & Links
- Investopedia: Inventory Turnover Ratio Guide: A deep dive into the financial formulas and importance of turnover ratios in supply chain management.
- AccountingCoach: COGS and Inventory Valuation: Educational resources explaining the fundamental relationship between Cost of Goods Sold and inventory accounting.
- Shopify: Inventory Management Best Practices: Practical insights on managing stock levels, analyzing turnover, and optimizing warehouse efficiency.
- Forbes Advisor: Business Metric Benchmarking: Strategies for comparing your company's operational KPIs against industry standards and competitors.
- Tableau: Data Visualization for Supply Chain: Tools and techniques for creating visual performance summary reports and tracking inventory trends.
- Gartner: Supply Chain Risk Management: Expert analysis on auditing low-turnover items and managing discrepancies in large-scale inventory workflows.
Found this Article helpful?
Inventory Management Solution Demo
Optimize your inventory & boost profitability! ChecklistGuro streamlines tracking, ordering, & fulfillment. Reduce waste, minimize stockouts, & improve efficiency. Manage it all with our Work OS.
Related Articles
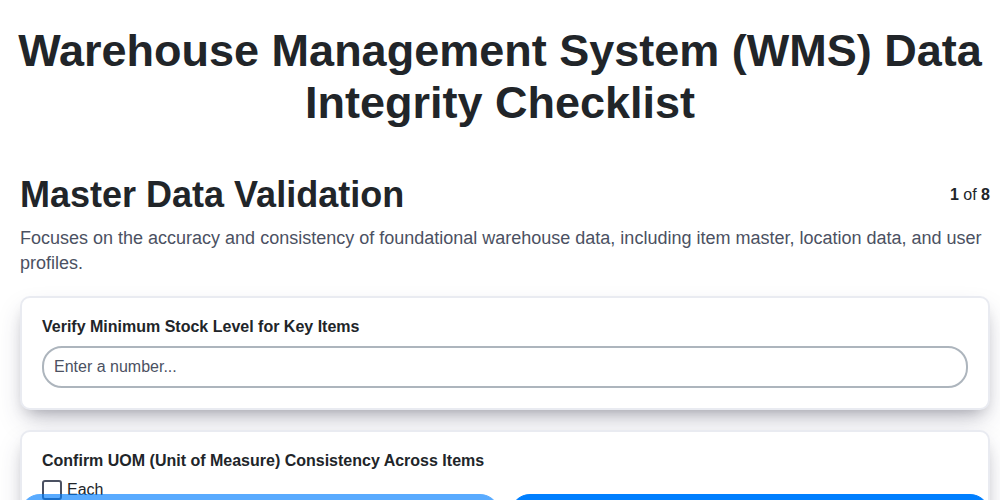
Warehouse Data Integrity: Your WMS Checklist Template

Mastering Inventory Turnover: Your Analysis Checklist Template
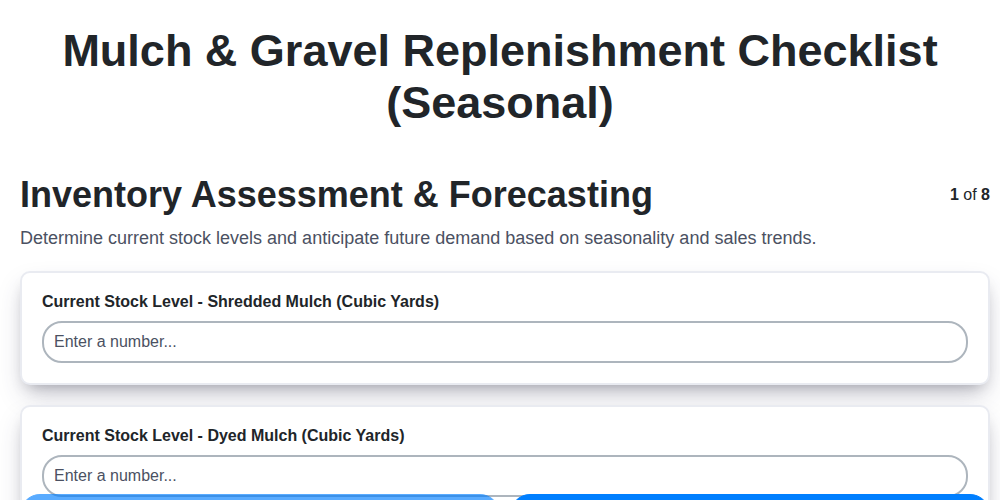
Seasonal Mulch & Gravel Checklist Template: Stay Stocked & Ready
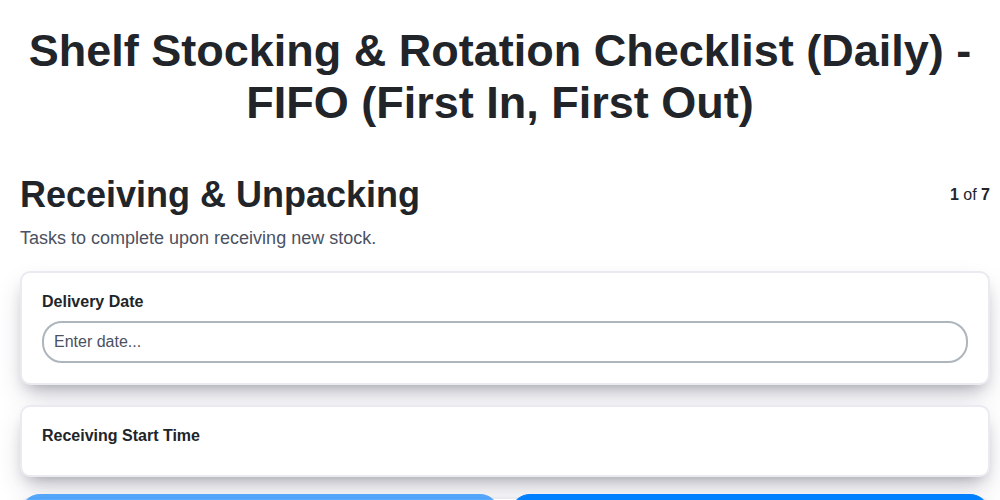
Daily Shelf Stocking & Rotation Checklist: FIFO Made Easy
Order Picking Process Verification: Your Checklist Template
Monthly Stockroom Organization & Safety Checklist Template
Vendor Lead Time Validation: A Checklist Template for Supply Chain Success
Daily Warehouse Walkthrough Inspection Checklist Template
We can do it Together
Need help with
Checklists?
Have a question? We're here to help. Please submit your inquiry, and we'll respond promptly.