Inventory Turnover Ratio Analysis Process
Master your stock efficiency with our comprehensive Inventory Turnover Ratio Analysis Process. Learn how to track, calculate, and optimize your inventory movement to eliminate deadstock, boost liquidity, and maximize profitability through data-driven supply chain insights.
Start
Start of the Workflow/Process.
1. Fetch Inventory Records
Retrieve all current stock levels and unit costs from the Inventory Data Model.
2. Fetch Cost of Goods Sold (COGS)
Retrieve total COGS values from the Financial Records Data Model for the period.
3. Calculate Average Inventory Value
Sum the value of all retrieved inventory items and divide by the number of entries to find the average stock value.
4. Compute Turnover Ratio
Execute the formula: COGS / Average Inventory Value.
5. Determine Days Sales of Inventory (DSI)
Execute the formula: 365 / Inventory Turnover Ratio.
6. Benchmark Comparison
Compare the calculated ratio against the predefined Industry Standard threshold.
7. Review Discrepancies Task
Create a task for the Inventory Manager if the ratio falls below the required threshold.
8. Create Analysis Report Entry
Create a new entry in the 'Inventory Analysis Reports' data model containing the calculated metrics.
9. Update Inventory Status
Update the 'Last Analyzed Date' and 'Current Performance Status' in the Inventory Data Model.
10. Generate Performance Summary Report
Generate a visual report/dashboard summarizing the turnover trends and DSI.
11. Notify Stakeholders
Send an email to the Operations Director with the final turnover ratio and the link to the report.
12. Audit Low-Turnover Items
Create a task for the Procurement Team to investigate specific SKUs identified as 'Slow Moving'.
End
End of the Workflow/Process.
Start of the Workflow/Process.
Retrieve all current stock levels and unit costs from the Inventory Data Model.
Retrieve total COGS values from the Financial Records Data Model for the period.
Sum the value of all retrieved inventory items and divide by the number of entries to find the average stock value.
Execute the formula: COGS / Average Inventory Value.
Execute the formula: 365 / Inventory Turnover Ratio.
Compare the calculated ratio against the predefined Industry Standard threshold.
Create a task for the Inventory Manager if the ratio falls below the required threshold.
Create a new entry in the 'Inventory Analysis Reports' data model containing the calculated metrics.
Update the 'Last Analyzed Date' and 'Current Performance Status' in the Inventory Data Model.
Generate a visual report/dashboard summarizing the turnover trends and DSI.
Send an email to the Operations Director with the final turnover ratio and the link to the report.
Create a task for the Procurement Team to investigate specific SKUs identified as 'Slow Moving'.
End of the Workflow/Process.
Found this Workflow Template helpful?
Inventory Management Solution Demo
Optimize your inventory & boost profitability! ChecklistGuro streamlines tracking, ordering, & fulfillment. Reduce waste, minimize stockouts, & improve efficiency. Manage it all with our Work OS.
Related Workflow Templates
Inventory Movement and Log Tracking Process
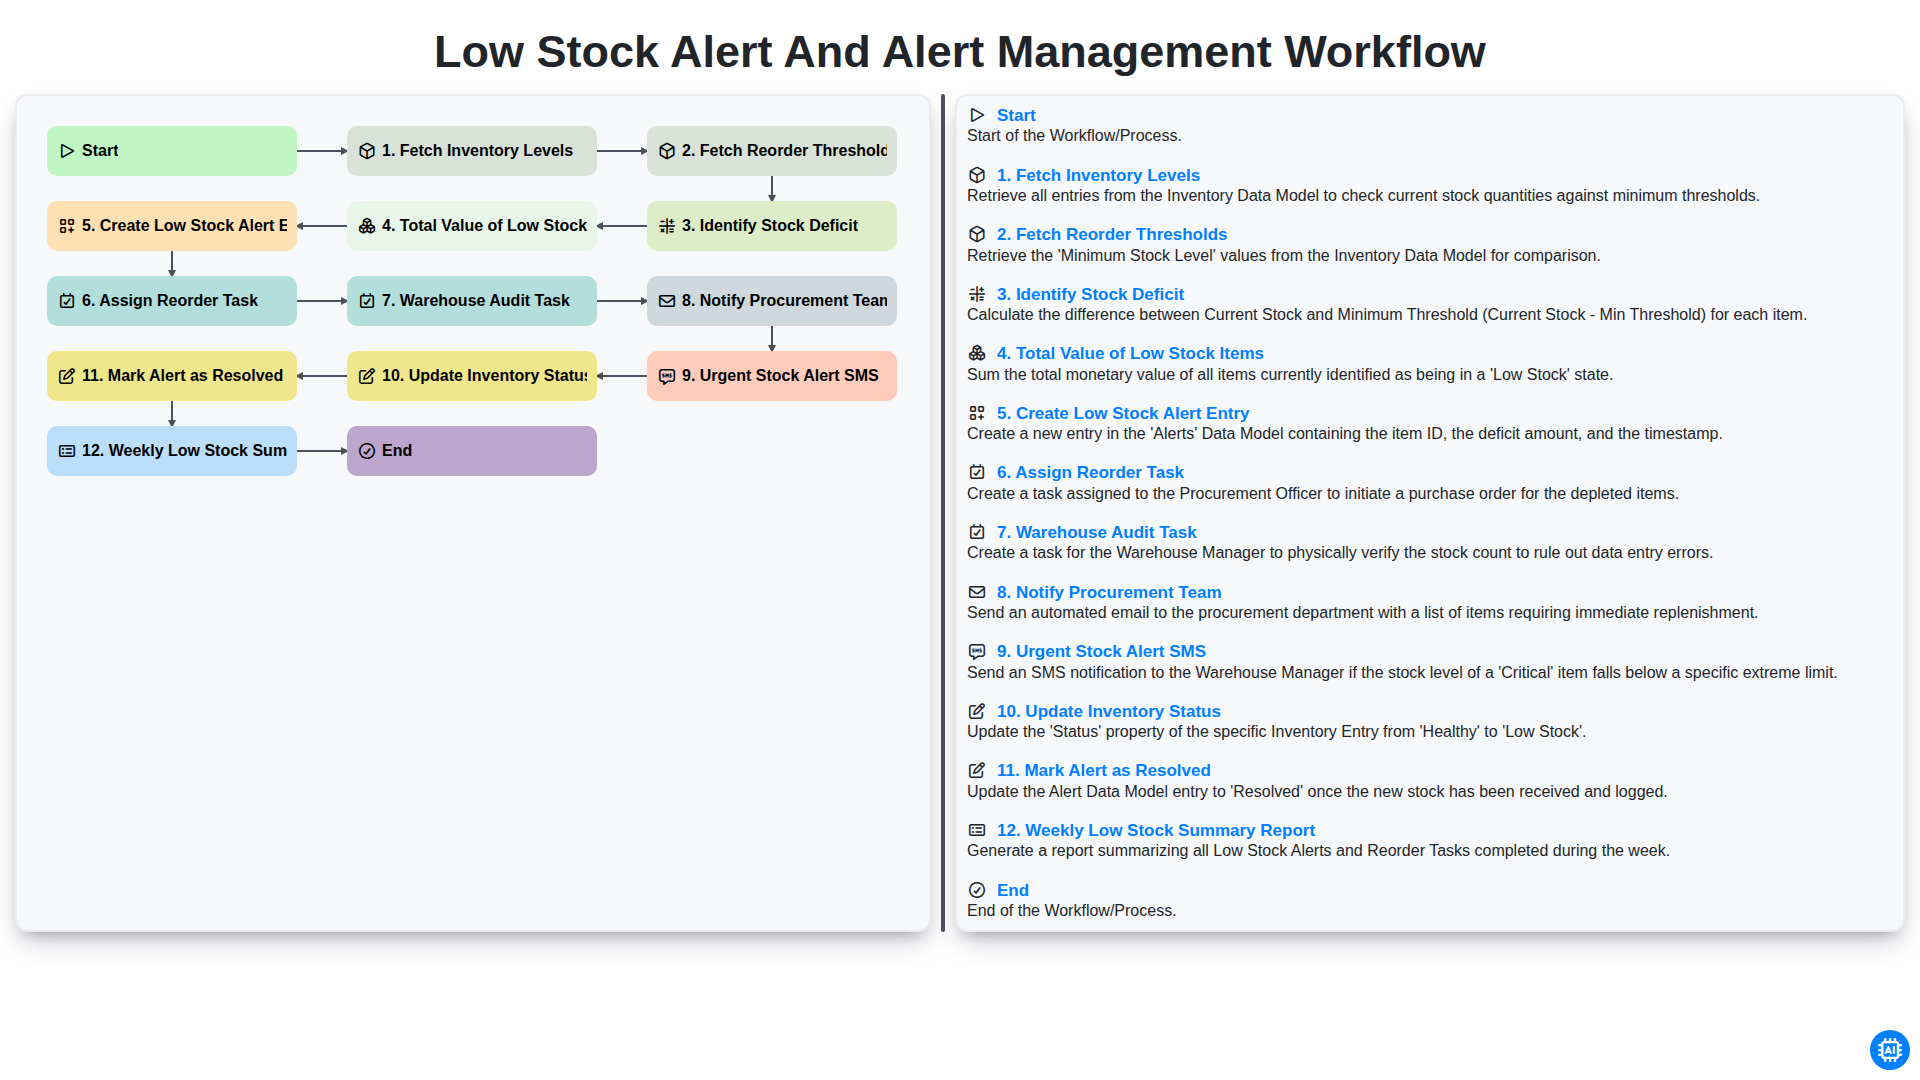
Low Stock Alert and Alert Management Workflow
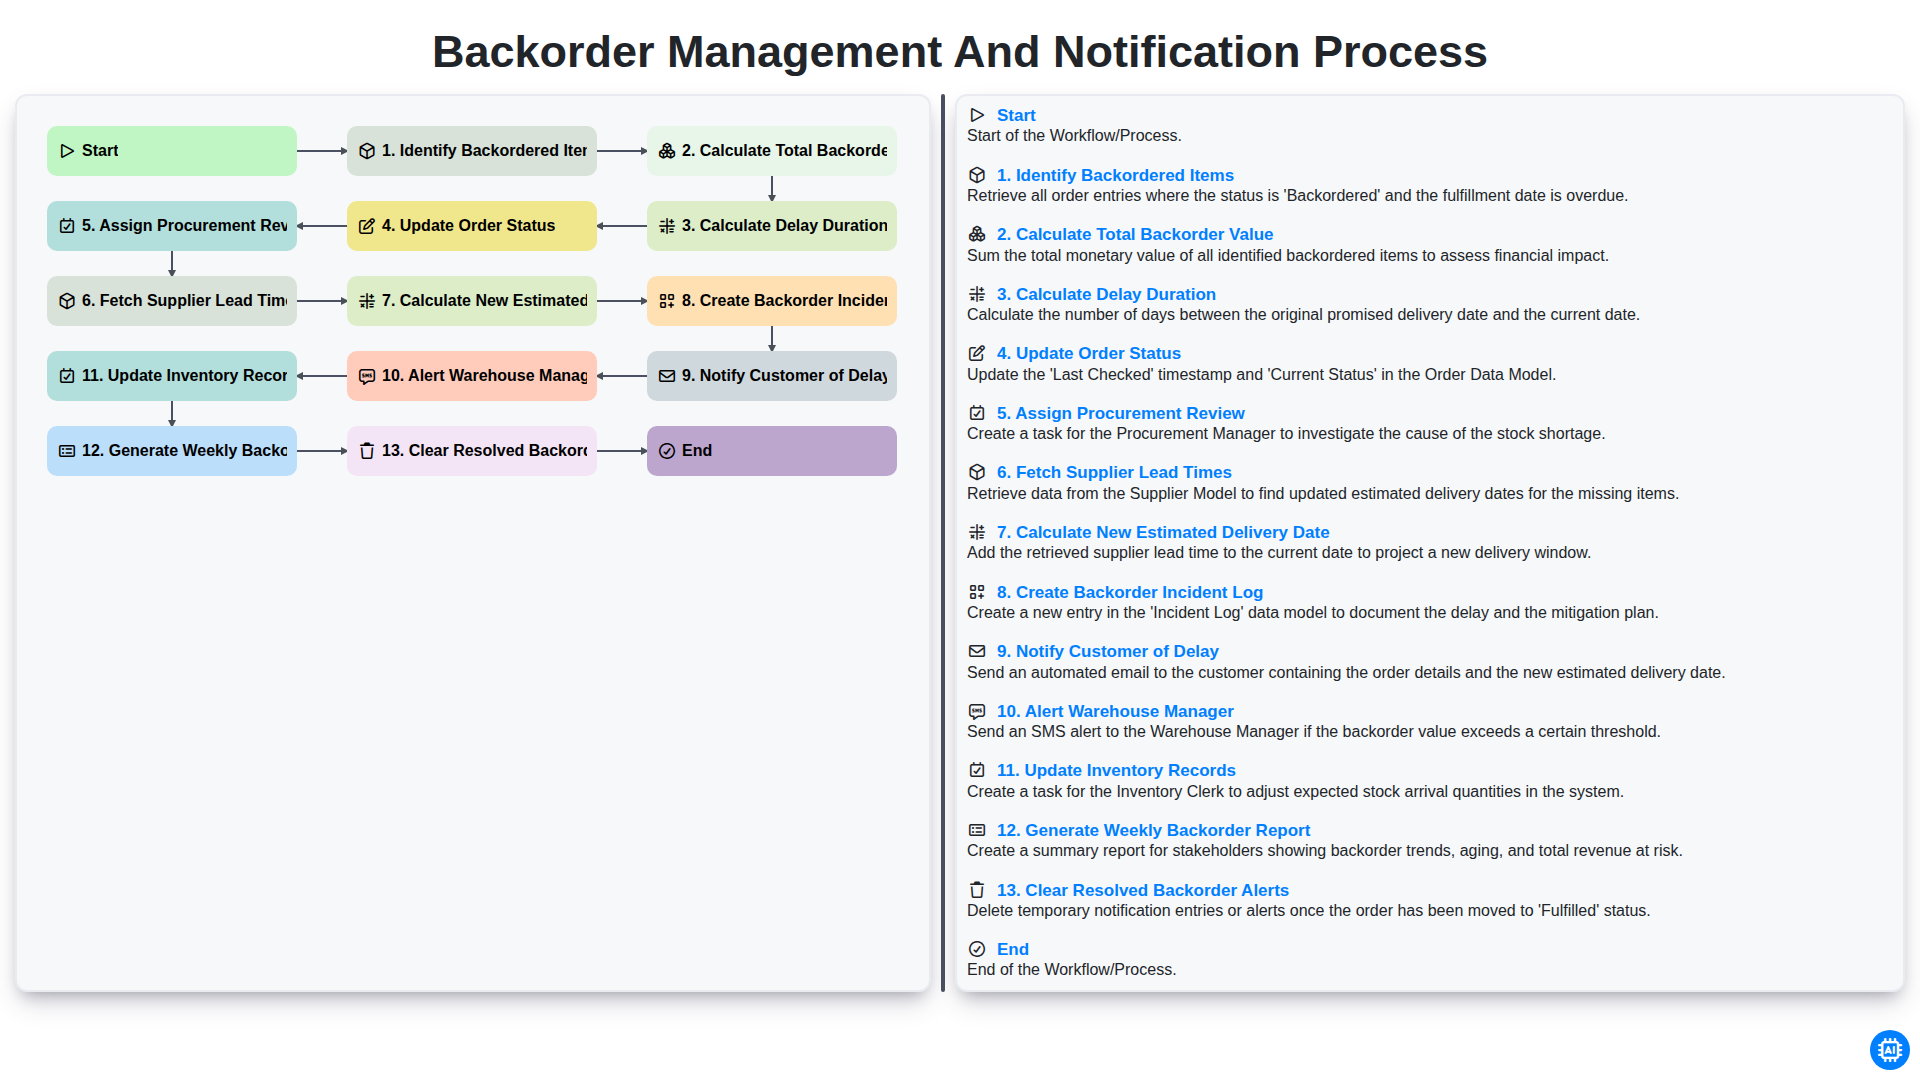
Backorder Management and Notification Process
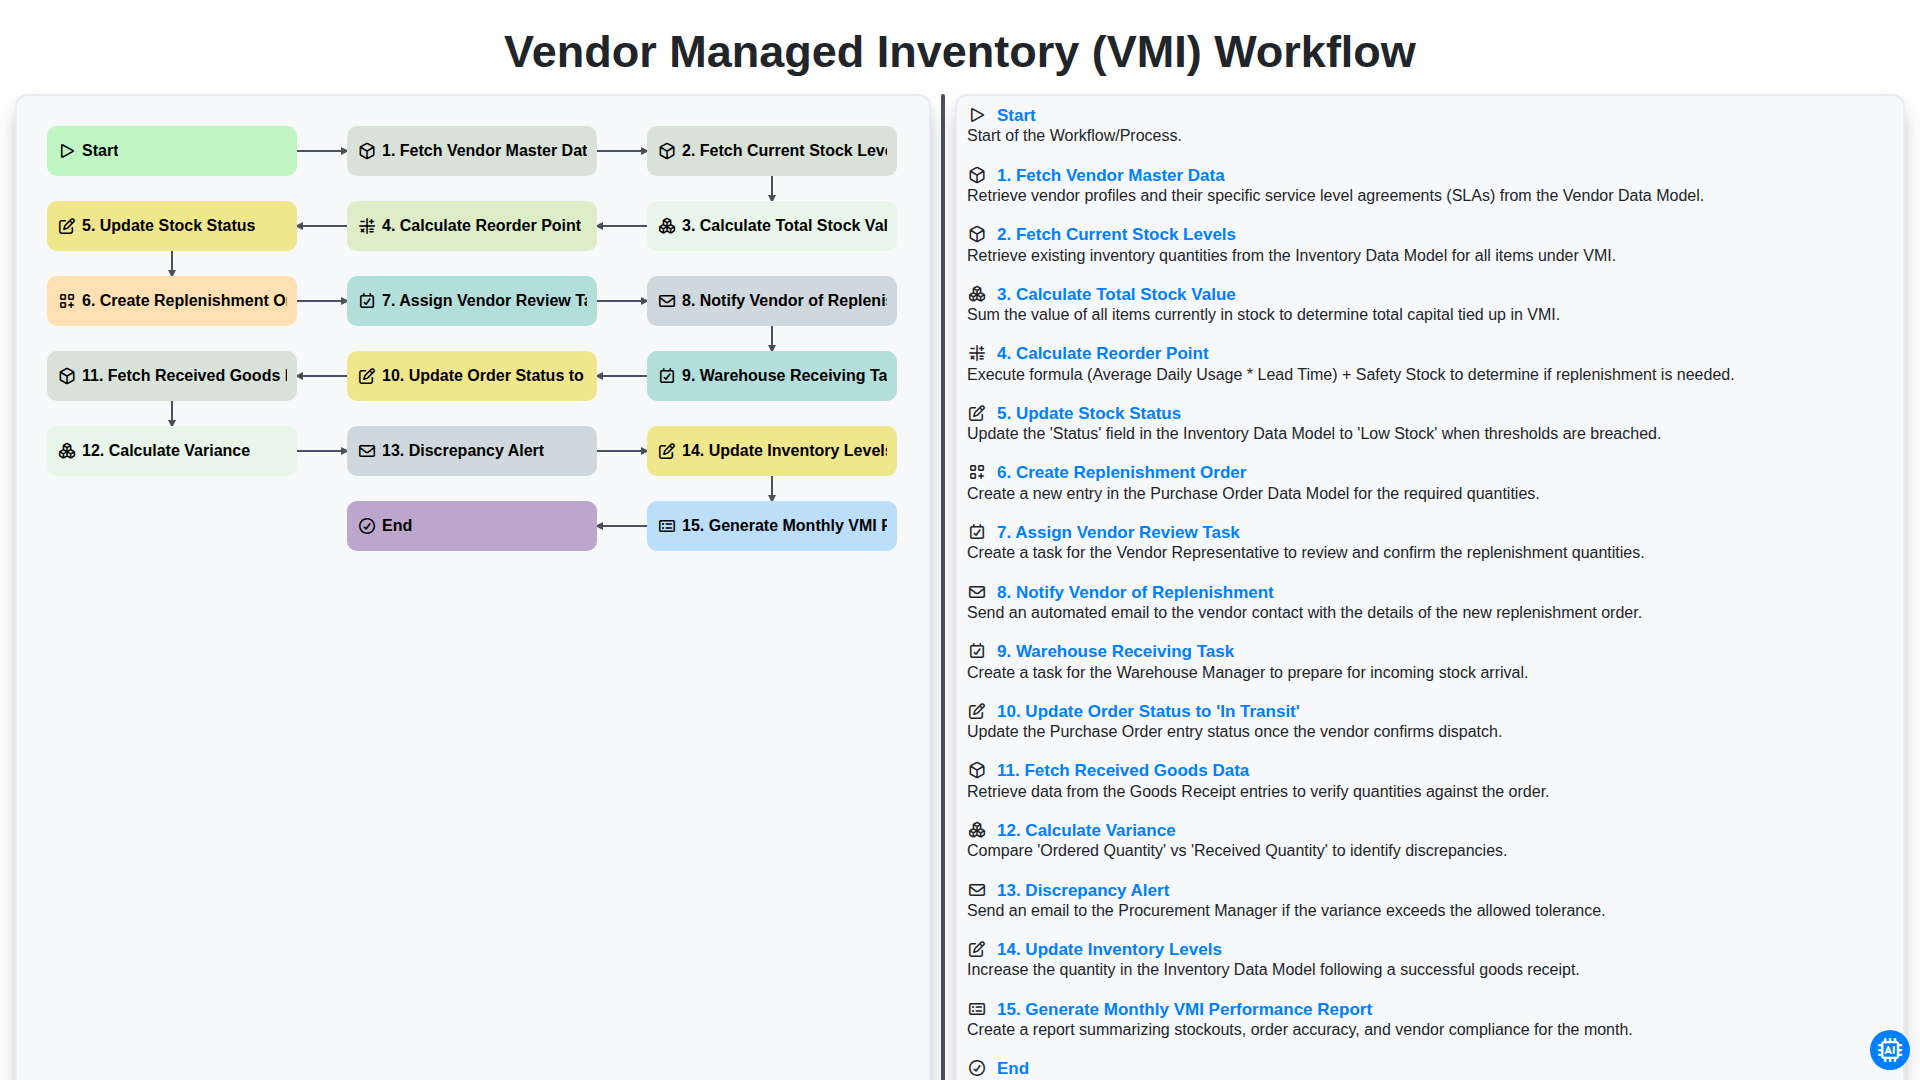
Vendor Managed Inventory (VMI) Workflow
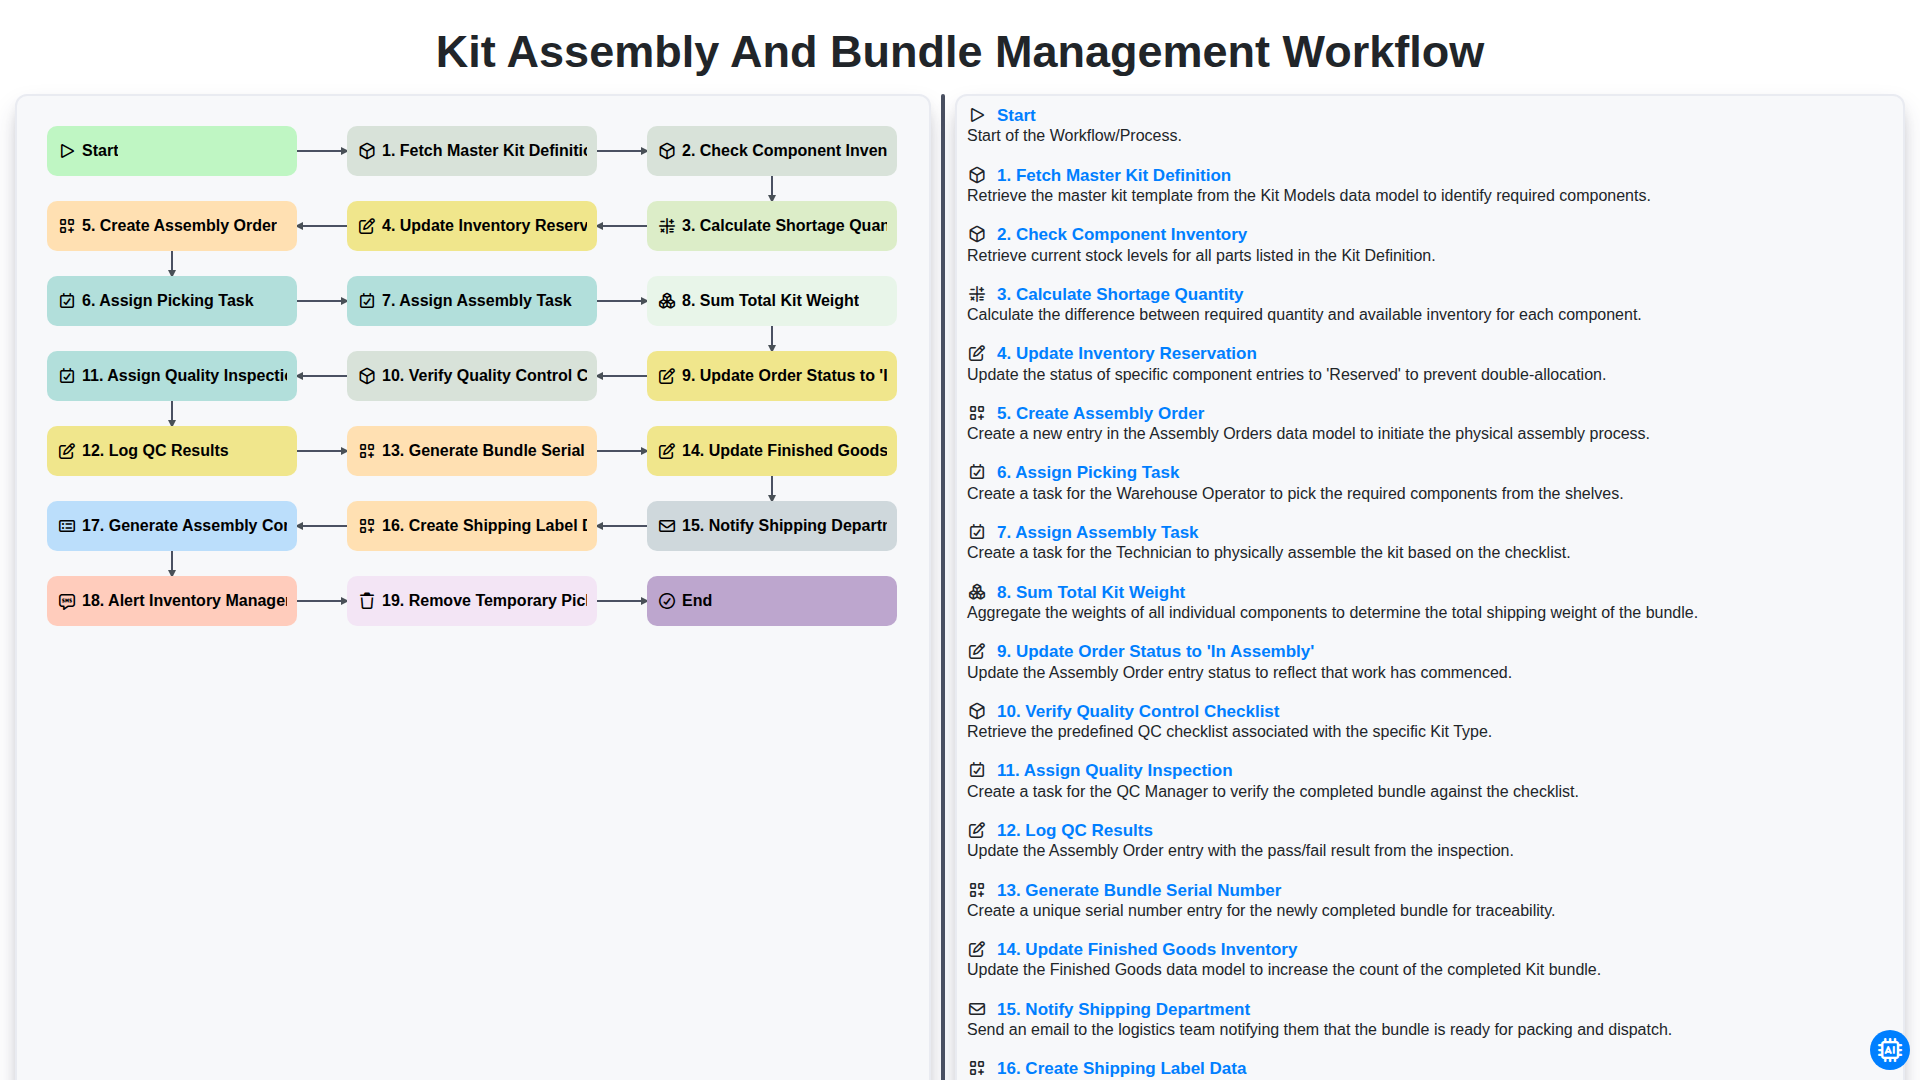
Kit Assembly and Bundle Management Workflow
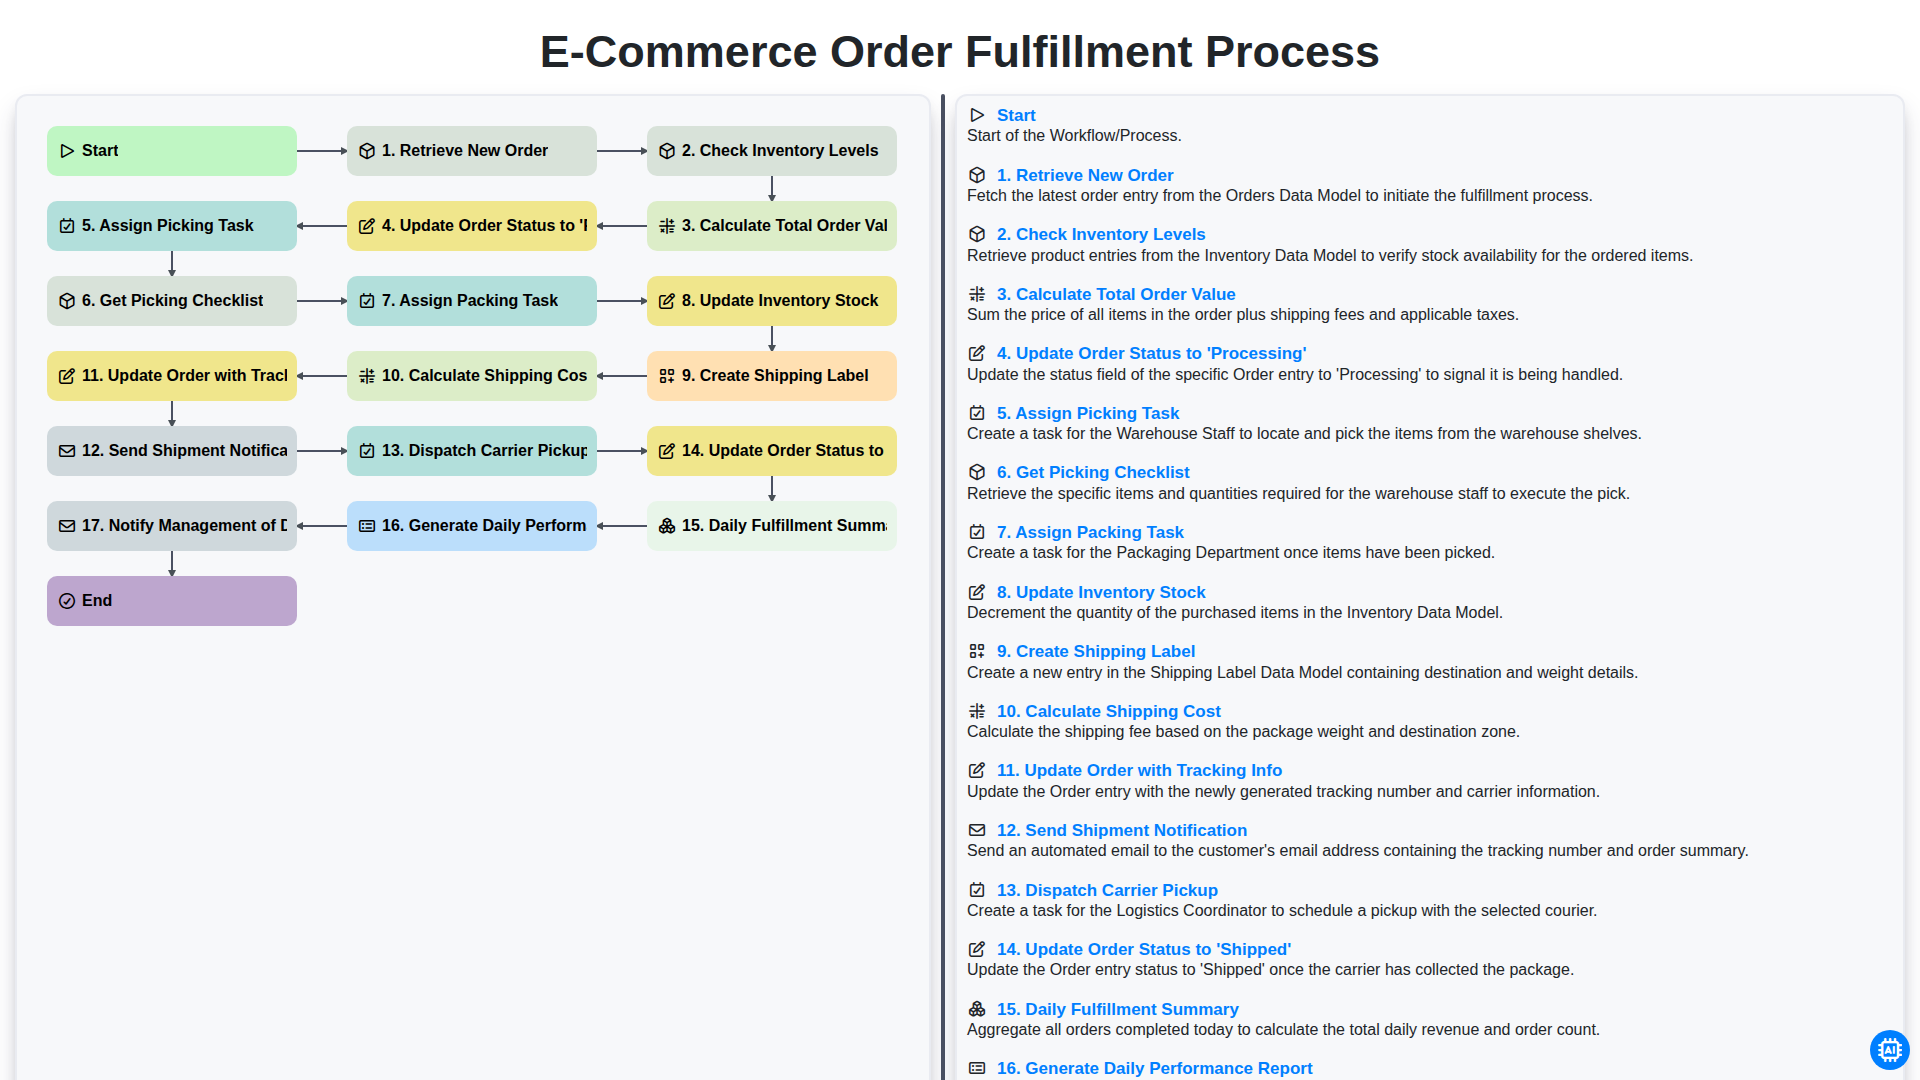
E-commerce Order Fulfillment Process
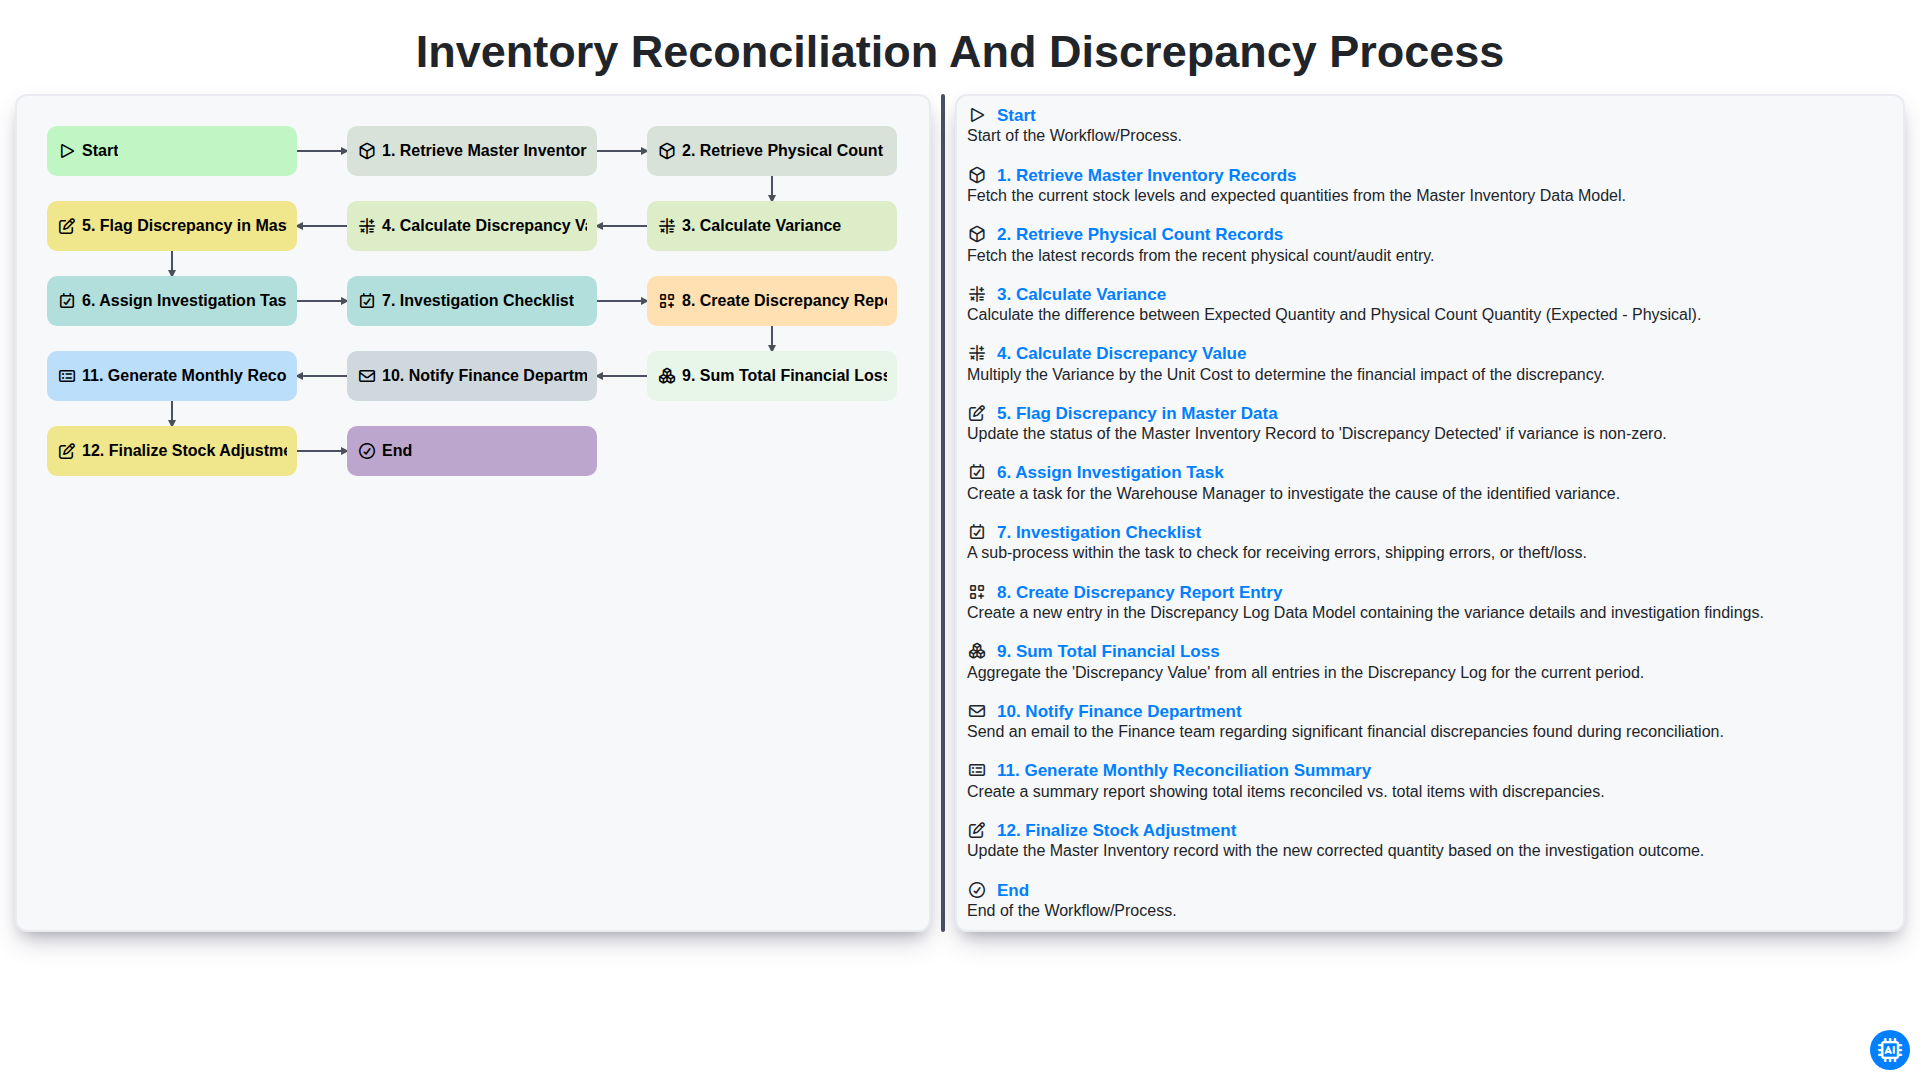
Inventory Reconciliation and Discrepancy Process
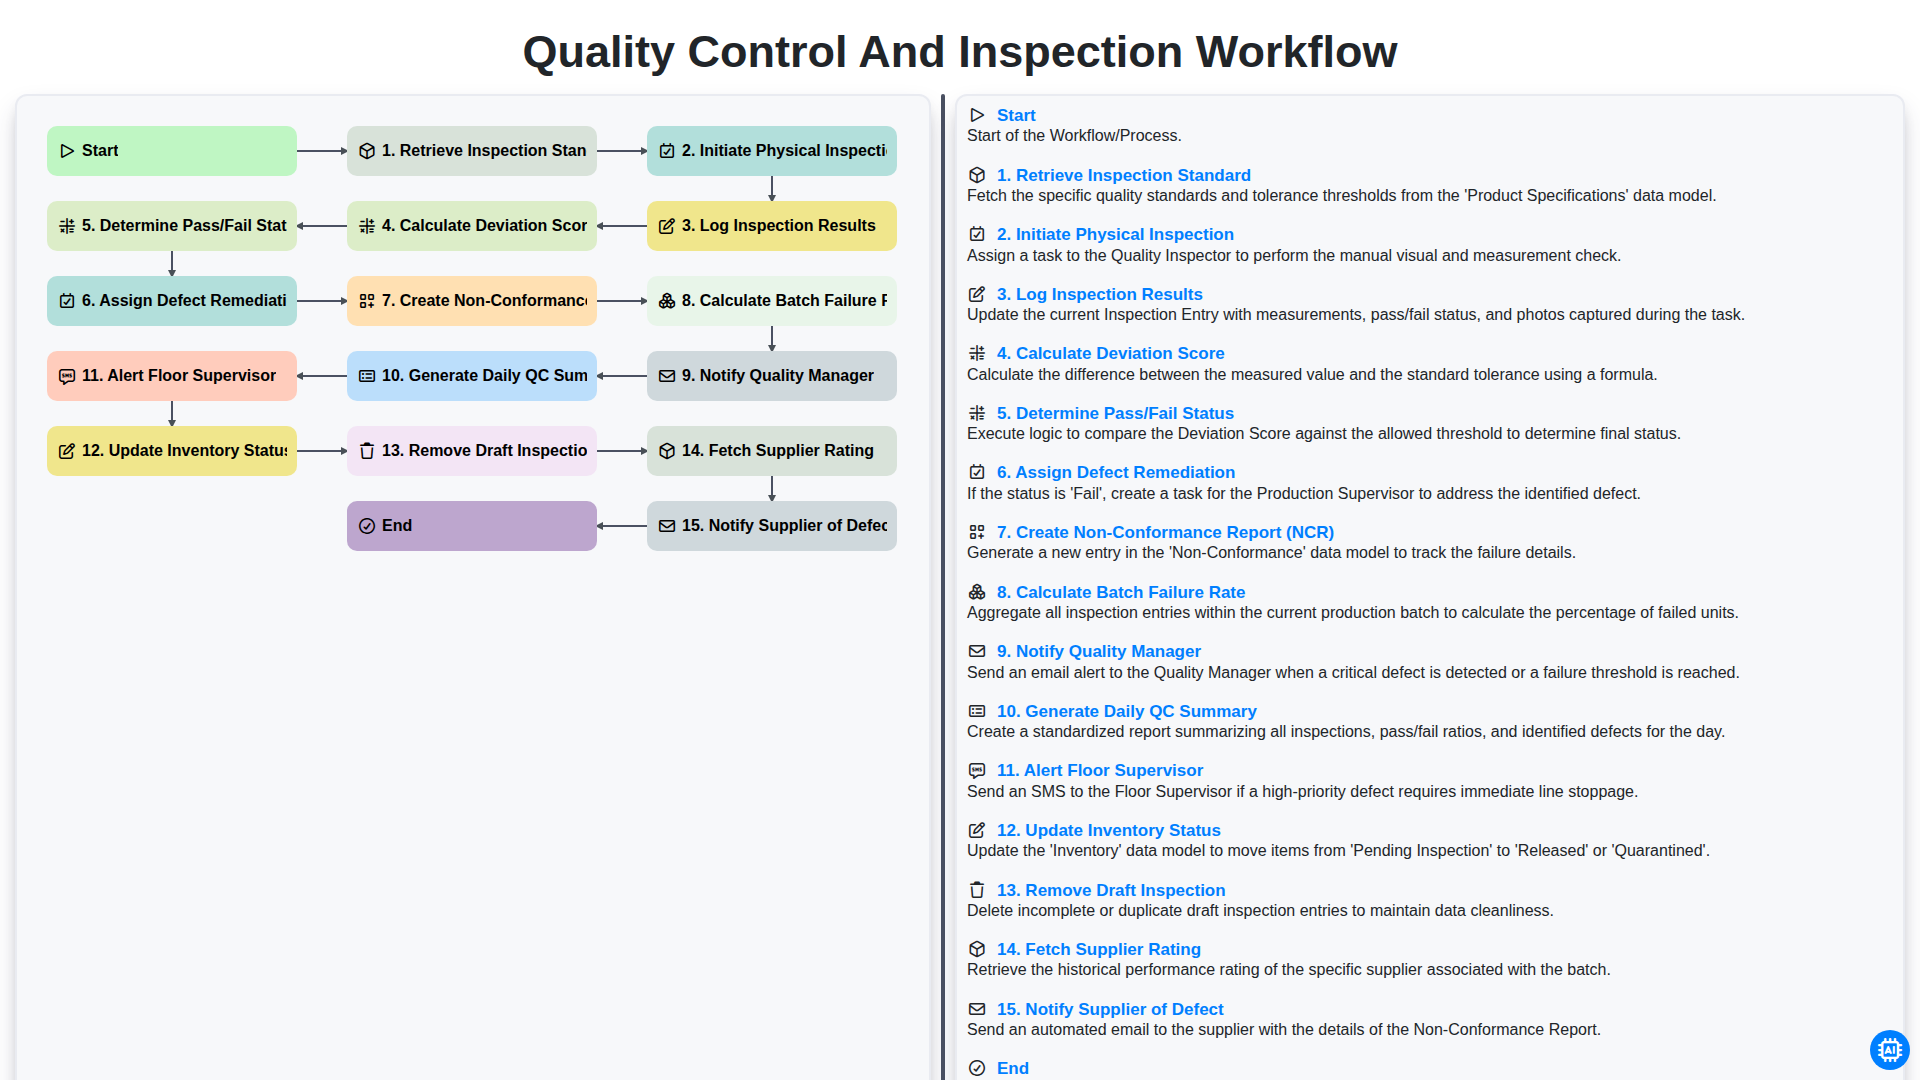
Quality Control and Inspection Workflow
We can do it Together
Need help with
Inventory Management?
Have a question? We're here to help. Please submit your inquiry, and we'll respond promptly.