Mastering Logistics Efficiency: A Comprehensive Guide to the KPI & Performance Analytics Process
Published: 05/31/2026 Updated: 06/01/2026
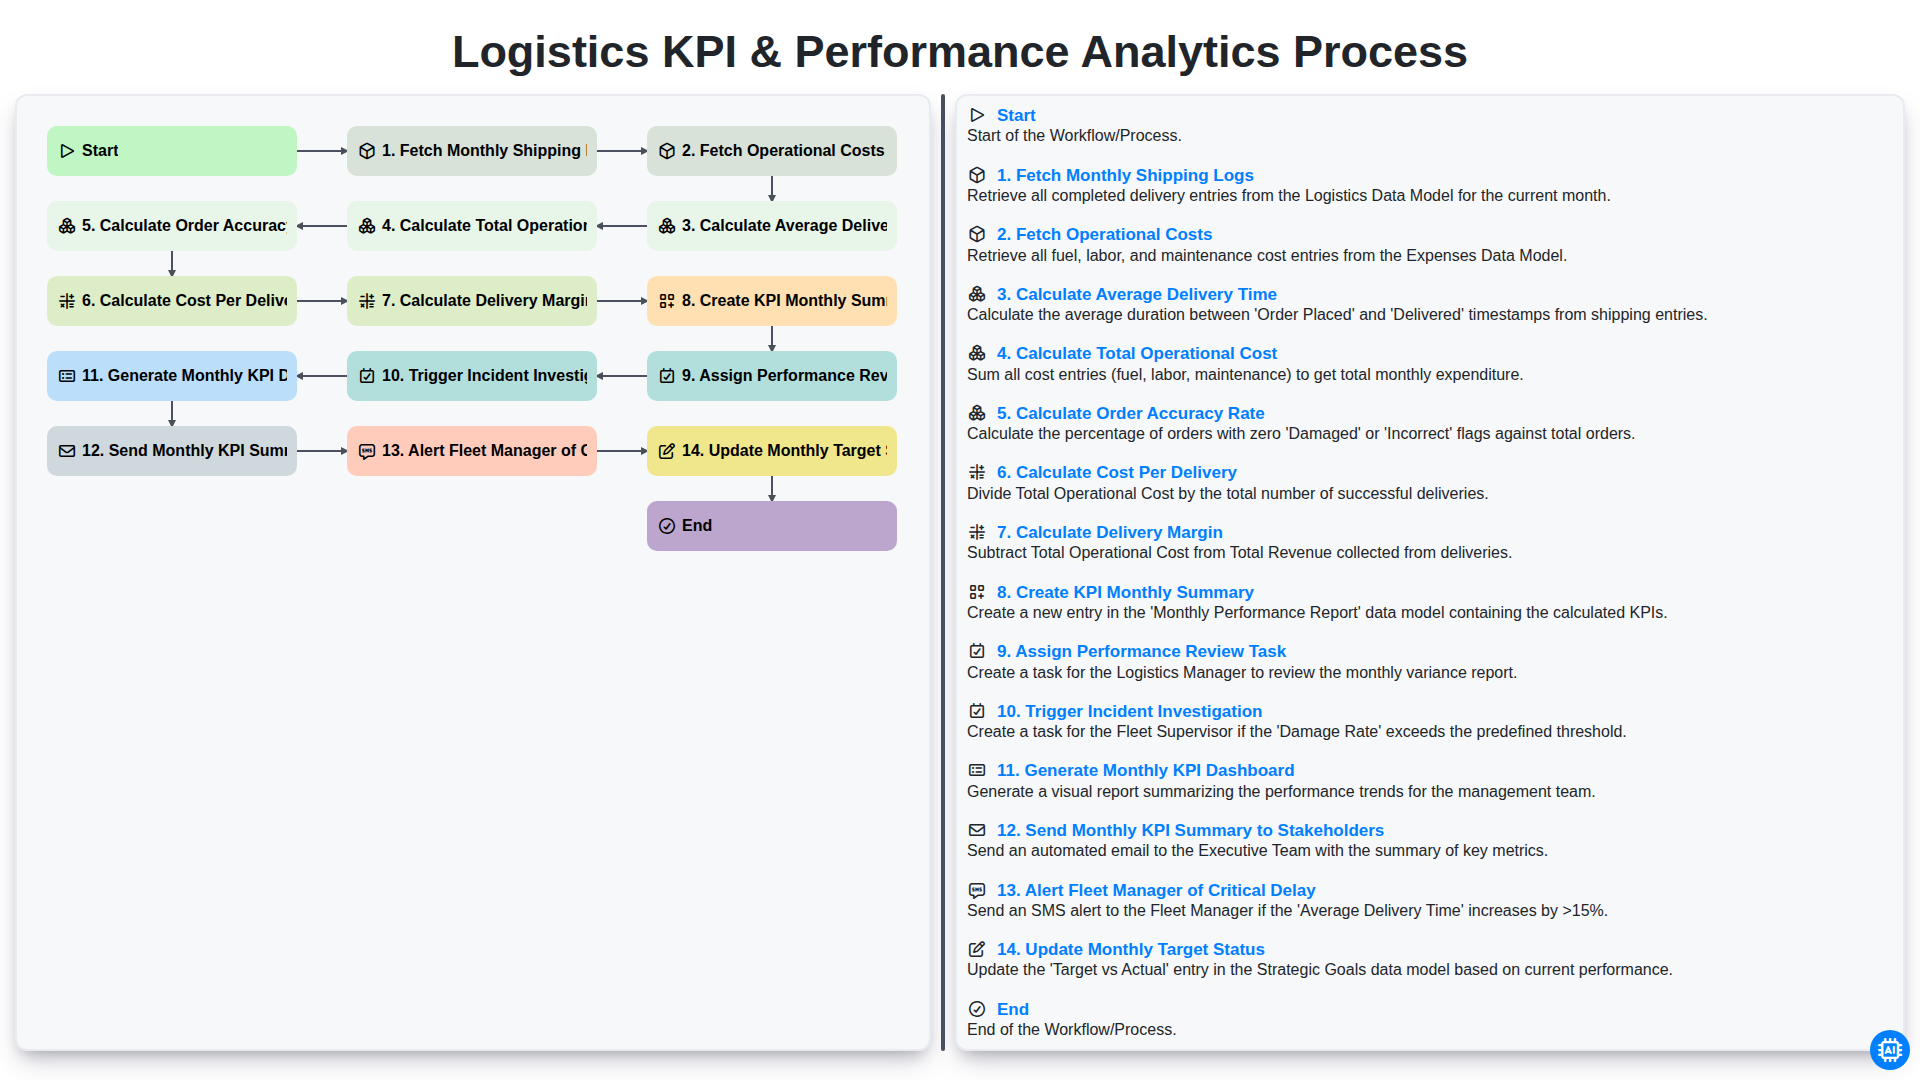
Table of Contents
- Introduction: The Importance of Data-Driven Logistics
- Phase 1: Data Collection and Raw Input Gathering
- Step 1: Fetching Monthly Shipping Logs and Operational Costs
- Phase 2: Core Metric Computation and Calculation
- Analyzing Delivery Efficiency: Calculating Average Delivery Time
- Evaluating Financial Impact: Total Operational Cost and Cost Per Delivery
- Measuring Precision: Determining Order Accuracy Rate
- Profitability Assessment: Calculating Delivery Margin
- Phase 3: Synthesis and Performance Summarization
- Creating the KPI Monthly Summary and Updating Target Status
- Phase 4: Actionable Insights and Automated Workflows
- Automating Accountability: Assigning Performance Reviews and Incident Investigations
- Real-time Alerting: Notifying Fleet Managers of Critical Delays
- Phase 5: Reporting and Stakeholder Communication
- Finalizing the Monthly KPI Dashboard and Stakeholder Distribution
- Resources & Links
TLDR: Streamline your supply chain oversight with this automated workflow designed to transform raw shipping logs and operational costs into actionable insights. Learn how to automate the end-to-end process of calculating critical metrics-such as delivery time, order accuracy, and delivery margins-while instantly triggering incident investigations and distributing real-time performance dashboards to stakeholders for data-driven decision-making.
Introduction: The Importance of Data-Driven Logistics
In the fast-paced world of supply chain management, intuition is no longer enough to maintain a competitive edge. As global networks become more complex and customer expectations for rapid, reliable delivery intensify, logistics leaders are facing unprecedented pressure to optimize every moving part of their operations. To navigate this complexity, the transition from reactive management to proactive optimization is essential, and that transition is powered by one thing: data.
Data-driven logistics is about more than just collecting numbers; it is about transforming raw operational inputs into actionable intelligence. By implementing a structured, automated workflow for tracking Key Performance Indicators (KPIs), companies can move beyond simply knowing what happened to understanding why it happened. When shipment logs, operational costs, and delivery metrics are processed through a consistent analytical lens, they reveal the hidden patterns of inefficiency-such as rising fuel costs, bottlenecked transit routes, or declining order accuracy-before they escalate into systemic failures.
Ultimately, a robust performance analytics process serves as the nervous system of a modern logistics operation. It provides the visibility needed to pinpoint exactly where margins are being eroded and where operational excellence is being achieved. By establishing a systematic way to measure, analyze, and respond to logistics performance, businesses can transform their supply chain from a cost center into a strategic engine for growth.
Phase 1: Data Collection and Raw Input Gathering
The foundation of any robust analytics engine lies in the integrity and comprehensiveness of its underlying data. Before complex calculations or strategic assessments can take place, the workflow must first execute the critical first step: Data Ingestion. In this initial phase, the system undergoes a systematic process of gathering raw, unprocessed information from various fragmented sources across the supply chain.
The process begins with two primary data streams: Fetching Monthly Shipping Logs and Fetching Operational Costs. The shipping logs serve as the operational heartbeat, containing granular details such as timestamps, destination data, and delivery statuses. Simultaneously, the integration of operational cost data-encompassing fuel, labor, maintenance, and warehousing expenses-is essential to provide the necessary financial context. Without this synchronized retrieval of both logistics activity and financial expenditure, any subsequent analysis would lack the multidimensional view required to accurately measure true profitability and operational efficiency.
Step 1: Fetching Monthly Shipping Logs and Operational Costs
The foundation of any robust performance analytics process lies in the integrity of the raw data. The workflow begins with the automated extraction of two critical data streams: Monthly Shipping Logs and Operational Costs.
First, the system retrieves the shipping logs, which serve as the primary source of truth for all movement-related activities. This includes detailed records of every order dispatched, timestamps for departure and arrival, carrier details, and delivery outcomes. Without accurate, granular logs, calculating metrics like delivery lead times or accuracy rates would be impossible.
Simultaneously, the process pulls the corresponding operational cost data. This includes variable expenses such as fuel consumption, driver wages, maintenance fees, and third-party logistics (3PL) invoices. By integrating both the logistical activity (the logs) and the financial expenditure (the costs) at the very start of the workflow, we create a unified dataset. This integration is vital, as it allows the subsequent steps of the analytics engine to bridge the gap between operational performance and financial impact, turning raw numbers into actionable business intelligence.
Phase 2: Core Metric Computation and Calculation
Once the raw data has been successfully retrieved from your shipping logs and financial records, the engine moves into the most critical stage: transforming raw numbers into actionable intelligence. This phase is where the data becomes metrics through a series of systematic, automated calculations.
The computational process follows a logical hierarchy, moving from simple averages to complex profitability analysis:
- Time & Accuracy Assessment: The system first calculates the Average Delivery Time to measure carrier efficiency and the Order Accuracy Rate to evaluate warehouse and picking precision. These two metrics serve as the primary indicators of service quality.
- Financial Deep-Dive: The process then integrates the fetched operational costs to determine the Total Operational Cost. From here, the engine derives the Cost Per Delivery, a vital metric for identifying unit-level inefficiencies, and the Delivery Margin, which reveals the true profitability of your logistics operations.
By automating these calculations, you eliminate the risk of manual spreadsheet errors and ensure that every margin and cost metric is calculated with mathematical consistency every single month.
Analyzing Delivery Efficiency: Calculating Average Delivery Time
To optimize a logistics network, you cannot simply rely on intuition; you must rely on data. One of the most critical metrics in this analytical workflow is the Average Delivery Time. This metric serves as a primary barometer for your entire supply chain's velocity and reliability.
The calculation process begins by pulling the raw data from your Monthly Shipping Logs. By measuring the time elapsed from the moment an order is dispatched to the timestamp of successful delivery, we can identify the precise duration of each transit cycle. However, a simple average isn't enough. To derive actionable insights, this step involves analyzing the variance between promised delivery windows and actual arrival times.
Analyzing this specific KPI allows your team to pinpoint bottlenecks-whether they are occurring at the warehouse loading docks, during long-haul transit, or during the last mile phase. By monitoring fluctuations in average delivery time month-over-month, you can distinguish between random delays and systemic inefficiencies, allowing you to implement targeted routing adjustments or carrier renegotiations before delivery delays impact your overall customer satisfaction scores.
Evaluating Financial Impact: Total Operational Cost and Cost Per Delivery
To achieve true visibility into logistics efficiency, the workflow must move beyond simple delivery timelines and delve into the granular financial metrics that dictate profitability. Two of the most critical benchmarks in this process are Total Operational Cost and Cost Per Delivery.
The process begins by fetching comprehensive monthly operational costs, which include everything from fuel consumption and vehicle maintenance to driver wages and warehouse overhead. By aggregating these figures, the system calculates the Total Operational Cost, providing a macro-level view of the logistics department's spending. While a high total cost might reflect a growing business volume, it only tells half the story.
To understand the true efficiency of your fleet, the workflow then transitions to calculating the Cost Per Delivery. This metric is the ultimate equalizer; it strips away the noise of volume fluctuations to reveal how much it costs to move a single package from origin to destination. By dividing the total operational expenditure by the number of successful deliveries, the analytics engine can pinpoint whether your scaling efforts are remaining cost-effective.
When these two metrics are analyzed in tandem with the Delivery Margin, the workflow identifies precisely where margin erosion is occurring-whether through rising fuel prices, inefficient routing, or disproportionate administrative overhead. Monitoring these financial KPIs ensures that your logistics strategy is not just fast, but fundamentally sustainable.
Measuring Precision: Determining Order Accuracy Rate
In the complex ecosystem of logistics, precision is the ultimate benchmark of operational excellence. Determining the Order Accuracy Rate is a critical step in our performance analytics workflow that moves beyond simple speed metrics to evaluate the fundamental integrity of your fulfillment process.
To calculate this KPI, the system performs a granular comparison between the items recorded in the initial customer order and the actual items documented during the outbound dispatch and final delivery stages. This process involves auditing perfect orders-those delivered in the correct quantity, with the correct SKU, and without any damage. By dividing the number of error-free orders by the total number of orders processed, we derive a percentage that serves as a direct reflection of warehouse picking accuracy and inventory management efficiency.
A high delivery speed means little if the contents of the package are incorrect. By integrating this metric into the monthly KPI summary, we can identify patterns of error-such as specific shifts or zones experiencing higher discrepancy rates-allowing for targeted training and process refinements. Ultimately, maintaining a high Order Accuracy Rate is not just about reducing costs related to returns and re-shipping; it is about preserving customer trust and ensuring the reliability of your entire supply chain.
Profitability Assessment: Calculating Delivery Margin
To truly understand the health of a logistics operation, looking at delivery speed or accuracy is not enough; you must also examine the bottom line through a rigorous Delivery Margin analysis. This step in our workflow serves as the ultimate litmus test for operational efficiency, moving beyond mere volume metrics to reveal the actual profitability of every shipment processed.
Calculating the delivery margin involves a precise subtraction of the Cost Per Delivery from the revenue generated per shipment. While a high volume of deliveries might suggest a booming business, a shrinking margin indicates that hidden operational leaks-such as rising fuel costs, excessive vehicle maintenance, or inefficient route planning-are eroding your profits. By integrating this calculation into the monthly KPI summary, the workflow allows leadership to identify exactly which routes, regions, or service levels are contributing to growth and which are inadvertently draining resources. This data-driven insight ensures that strategic decisions are based on realized profit rather than just superficial throughput.
Phase 3: Synthesis and Performance Summarization
Once the raw data has been processed and the core metrics have been calculated, the workflow transitions into the synthesis phase. This stage is where individual data points are transformed into actionable business intelligence.
The process begins with the Creation of the KPI Monthly Summary, which aggregates all calculated metrics-such as delivery margins and order accuracy-into a cohesive report. To ensure accountability, the system automatically Assigns Performance Review Tasks to relevant department heads, ensuring that the data is not just recorded, but reviewed.
During this phase, the workflow acts as an automated watchdog. If any metric falls below a predefined threshold, the system will Trigger an Incident Investigation to identify the root cause of the discrepancy. Simultaneously, for high-priority failures, the system will Alert the Fleet Manager of Critical Delays, allowing for immediate corrective action.
The final step in this phase involves closing the loop on the monthly cycle by Updating the Monthly Target Status. This ensures that the organization's long-term strategic goals are always synchronized with current operational realities, providing a continuous feedback loop for constant improvement.
Creating the KPI Monthly Summary and Updating Target Status
Once the core metrics have been calculated, the workflow moves into the synthesis stage, where raw data is transformed into actionable intelligence. This phase begins with the Creation of the KPI Monthly Summary, a consolidated report that aggregates delivery times, cost efficiencies, and accuracy rates into a single, cohesive narrative. This summary serves as the single source of truth for the month, providing a high-level overview that allows management to quickly grasp the overall health of the logistics network without digging through granular logs.
However, a summary is only as valuable as its context. To ensure true operational oversight, the process concludes by Updating the Monthly Target Status. By comparing the newly calculated performance metrics against pre-defined benchmarks and KPIs, the system identifies whether the department is meeting, exceeding, or falling short of its strategic goals. This step is critical for closing the loop: it transforms a simple retrospective of what happened into a proactive assessment of how we are performing against our roadmap, setting the stage for informed decision-making and strategic adjustments in the upcoming month.
Phase 4: Actionable Insights and Automated Workflows
Once the raw data is processed and the metrics are calculated, the true value of a KPI framework lies in its ability to transition from descriptive analytics to proactive management. In this phase, the workflow shifts from simply what happened to what do we need to do next. By integrating automated triggers into your performance analytics process, you transform a static report into a dynamic engine for operational excellence.
The automation of actionable insights ensures that critical information reaches the right decision-makers without manual intervention. For instance, the system doesn't just calculate the Cost Per Delivery or Delivery Margin; it actively monitors these figures against established benchmarks. If the Order Accuracy Rate dips below a predefined threshold or if the workflow detects a Critical Delay through real-time monitoring, the system automatically Alerts the Fleet Manager, allowing for immediate course correction before minor hiccups escalate into systemic failures.
Furthermore, this phase bridges the gap between data and accountability. The workflow automatically Assigns Performance Review Tasks to department heads and Triggers Incident Investigations when significant deviations are detected in the Monthly Shipping Logs. This ensures that every anomaly is documented and addressed. Finally, the process culminates in the automated distribution of the Monthly KPI Dashboard and the Monthly KPI Summary to Stakeholders, while simultaneously Updating Monthly Target Status. This closed-loop system ensures that your logistics strategy is always informed by real-time performance, driving continuous improvement across your entire supply chain.
Automating Accountability: Assigning Performance Reviews and Incident Investigations
Moving beyond mere data collection, a truly robust logistics workflow transforms raw numbers into actionable management oversight. The real power of an automated KPI process lies in its ability to bridge the gap between identifying a trend and addressing it. Once the system calculates the monthly summary, the workflow automatically transitions from analysis to accountability through two critical automated triggers: Assigning Performance Review Tasks and Triggering Incident Investigations.
Instead of leaving managers to manually hunt through spreadsheets to find where things went wrong, the system proactively flags discrepancies. For instance, if the Order Accuracy Rate or Delivery Margin falls below a predefined threshold, the workflow automatically generates a task for department heads to conduct a formal performance review. This ensures that operational lapses are never ignored or buried in a report.
Simultaneously, the system acts as a real-time watchdog through Incident Investigation triggers. If specific metrics-such as a sudden spike in Average Delivery Time-suggest a systemic failure or a logistical bottleneck, the workflow initiates a specialized investigation protocol. By automating these escalations, you remove the human error of oversight and ensure that every deviation from the monthly target is met with an immediate, structured response. This turns your KPI dashboard from a passive historical record into an active engine for continuous operational improvement.
Real-time Alerting: Notifying Fleet Managers of Critical Delays
In a fast-paced logistics environment, data visibility is only as valuable as the speed at which it triggers action. While the monthly KPI dashboard provides a high-level view of performance trends, the true power of an automated workflow lies in its ability to handle anomalies as they occur.
As part of our integrated analytics process, the system is configured to Alert Fleet Managers of Critical Delays the moment a delivery deviates from established service-level agreements (SLAs). Rather than waiting for a month-end review to discover that a specific route or carrier is underperforming, this automated trigger pushes real-time notifications directly to decision-makers.
By bypassing the delay of manual monitoring, fleet managers can initiate immediate course corrections-such as rerouting shipments, reallocating drivers, or contacting carriers-before a single delay escalates into a systemic failure. This proactive layer of the workflow transforms the analytics process from a mere reporting tool into a live command center, ensuring that critical stays a manageable exception rather than a recurring crisis.
Phase 5: Reporting and Stakeholder Communication
Once the complex calculations are finalized, the focus shifts from data processing to actionable intelligence. This final phase is where raw metrics are transformed into strategic insights that drive decision-making across the organization.
The workflow concludes with a structured dissemination of information designed to ensure transparency and rapid response. First, the system automatically Generates the Monthly KPI Dashboard, providing a visual representation of trends and performance trajectories. This is accompanied by the Sending of the Monthly KPI Summary to Stakeholders, ensuring that leadership remains aligned with operational realities.
However, communication isn't just about routine updates; it is also about proactive intervention. To prevent minor issues from becoming systemic failures, the workflow includes automated triggers, such as Alerting the Fleet Manager of Critical Delays and triggering an Incident Investigation when metrics fall below acceptable thresholds. Finally, the process closes the loop by Updating the Monthly Target Status, ensuring that the next month's planning is informed by the most recent performance data. This closed-loop communication ensures that every stakeholder-from the warehouse floor to the executive suite-is equipped with the information needed to maintain logistical excellence.
Finalizing the Monthly KPI Dashboard and Stakeholder Distribution
Once the complex calculations and performance assessments are complete, the final stage of the workflow focuses on transforming raw data into actionable intelligence. This phase is where individual metrics transition from numbers in a spreadsheet to a visual, high-level narrative.
The process begins with the Generation of the Monthly KPI Dashboard. Here, all calculated metrics-ranging from delivery margins to order accuracy rates-are aggregated into a centralized, visually intuitive interface. This dashboard serves as the single source of truth, allowing leadership to spot trends, identify seasonal fluctuations, and compare current performance against historical benchmarks at a single glance.
However, data visualization is only effective if it reaches the right eyes at the right time. The workflow concludes with the automated Distribution of the Monthly KPI Summary to Stakeholders. By proactively sending these insights to department heads, finance, and operations directors, you ensure that decision-makers are never left in the dark. This automated distribution eliminates the manual bottleneck of report compilation, ensuring that the entire organization is aligned on the previous month's performance and prepared to execute data-driven strategies for the month ahead.
Resources & Links
- Tableau Data Visualization: A powerful tool for visualizing complex logistics KPIs and creating the Monthly KPI Dashboard mentioned in the workflow.
- Microsoft Power BI: An essential resource for automating the calculation of delivery margins and sharing real-time performance reports with stakeholders.
- SAP Logistics Management: Provides deep insights into managing shipping logs, operational costs, and integrated supply chain analytics.
- Oracle Cloud SCM: A robust platform for tracking order accuracy rates and managing automated incident investigation workflows.
- Project Management Institute (PMI): Useful for understanding the principles of assigning performance review tasks and managing operational workflows effectively.
- IBM Supply Chain Intelligence: Advanced AI-driven resources for predicting critical delays and automating alerts for fleet managers.
Found this Article helpful?
Logistics Management Solution Demo
Tired of shipping delays, lost packages, and inefficient routes? ChecklistGuro's Work OS platform streamlines your entire logistics operation, from warehouse management and order fulfillment to route optimization and delivery tracking. Gain real-time visibility, reduce costs, and improve customer satisfaction. Learn how ChecklistGuro can transform your logistics business!
Related Articles
The Ultimate Refrigerated Cargo Temperature Control Checklist Template
Mastering Your Fleet: A Vehicle Maintenance Log Review Template
Master Your Returns: The Ultimate Returns Processing Efficiency Audit Checklist
Data Privacy Policy Compliance: Your Essential Checklist Template
Delivery Confirmation Audit: Your Checklist Template for Process Excellence
Your Pallet Inspection & Maintenance Checklist Template
Fuel Efficiency Monitoring: Your Checklist Template for Savings
Supply Chain Risk Assessment: Your Essential Checklist Template
We can do it Together
Need help with
Checklists?
Have a question? We're here to help. Please submit your inquiry, and we'll respond promptly.