A Step-by-Step Guide to the Maintenance KPI Reporting Process
Published: 06/18/2026 Updated: 06/19/2026
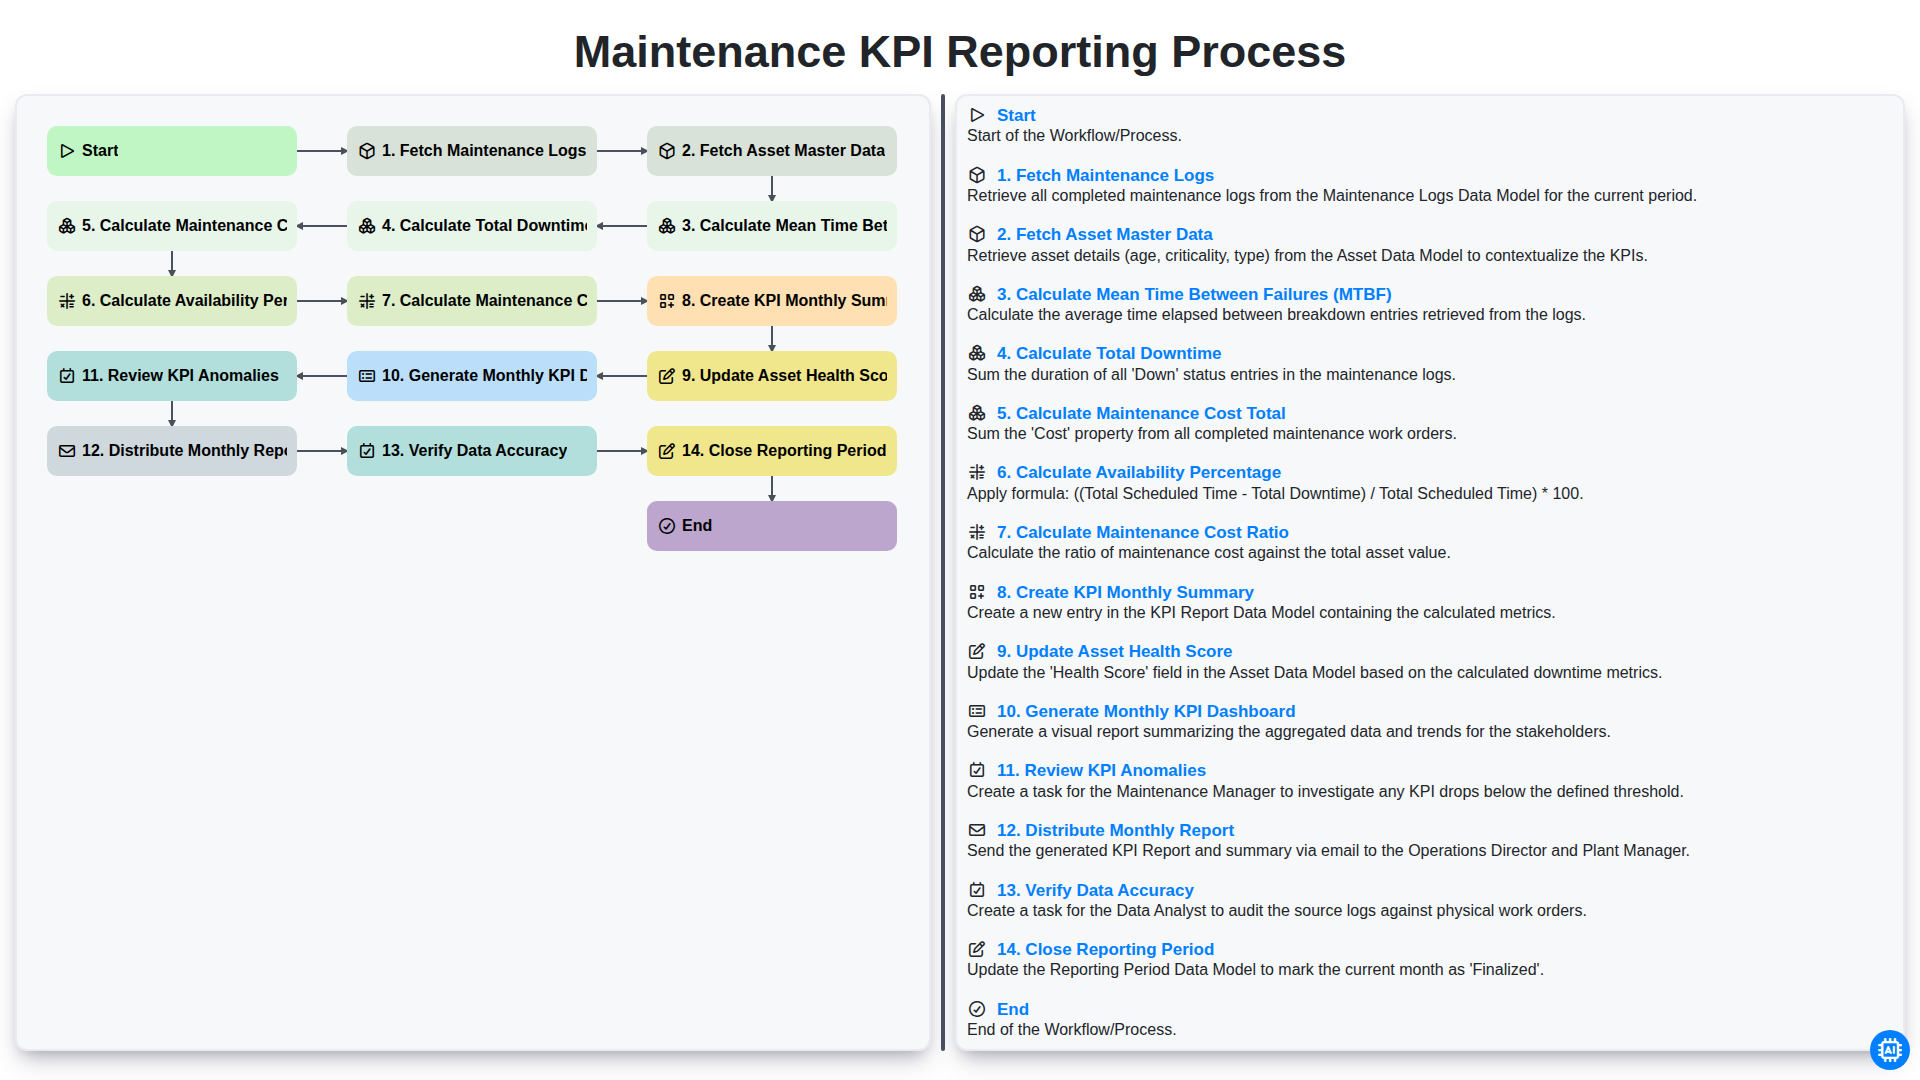
Table of Contents
- Introduction to Maintenance KPI Reporting
- Phase 1: Data Collection and Integration
- Step 1: Fetching Maintenance Logs
- Step 2: Fetching Asset Master Data
- Phase 2: Core Metric Calculations
- Step 3: Calculating Mean Time Between Failures (MTBF)
- Step 4: Calculating Total Downtime
- Step 5: Calculating Total Maintenance Cost
- Step 6: Calculating Availability Percentage
- Step 7: Calculating Maintenance Cost Ratio
- Phase 3: Insight Generation and Visualization
- Step 8: Creating the KPI Monthly Summary
- Step 9: Updating Asset Health Scores
- Step 10: Generating the Monthly KPI Dashboard
- Phase 4: Validation and Distribution
- Step 11: Reviewing KPI Anomalies
- Step 12: Verifying Data Accuracy
- Step 13: Distributing the Monthly Report
- Step 14: Closing the Reporting Period
- Conclusion: Driving Continuous Improvement
- Resources & Links
TLDR: Streamline your maintenance management with this comprehensive guide to the KPI reporting workflow. Learn how to automate everything from data collection and complex metric calculations-like MTBF and availability-to generating actionable monthly dashboards and ensuring data accuracy for smarter, data-driven asset management.
Introduction to Maintenance KPI Reporting
In the fast-paced world of industrial operations, data is only as valuable as the insights you can extract from it. For maintenance managers, simply collecting data isn't enough; the real challenge lies in transforming raw logs and repair records into actionable intelligence. This is where a structured Maintenance KPI Reporting Process becomes indispensable.
Key Performance Indicators (KPIs) serve as the pulse of your maintenance strategy, providing a clear window into the health of your machinery, the efficiency of your workforce, and the overall stability of your production lines. However, without a standardized workflow, reporting often becomes a reactive, manual, and error-prone struggle. By establishing a systematic approach-moving from data ingestion to deep-dive analysis and final distribution-organizations can shift from firefighting unplanned breakdowns to implementing a proactive, data-driven maintenance culture.
In this article, we will break down the end-to-end workflow required to turn fragmented maintenance logs into a powerful, automated reporting engine that drives continuous improvement.
Phase 1: Data Collection and Integration
The foundation of an effective reporting cycle lies in the integrity of the underlying data. Before any complex calculations can occur, the process begins with a rigorous data collection and integration phase. This stage involves two critical primary steps: Fetching Maintenance Logs and Fetching Asset Master Data.
The first step involves pulling detailed records from your CMMS (Computerized Maintenance Management System) or EAM (Enterprise Asset Management) software. This includes historical work orders, repair timestamps, failure descriptions, and labor hours. However, raw logs alone lack context; therefore, we must simultaneously integrate the Asset Master Data. This step ensures that every log entry is mapped to the correct piece of equipment, including its specific metadata such as installation date, manufacturer specifications, and criticality rating. By unifying these two data streams, we create a single, reliable source of truth that serves as the bedrock for all subsequent KPI calculations.
Step 1: Fetching Maintenance Logs
The foundation of any reliable KPI report lies in the integrity of the raw data. The first step in the maintenance reporting workflow is Fetching Maintenance Logs, which involves extracting all relevant activity records from your Computerized Maintenance Management System (CMMS) or Enterprise Asset Management (EAM) software.
This process requires gathering comprehensive data from all recent work orders, including timestamps for every failure, repair, and completion. It is crucial to ensure that no critical event is missed, as these logs serve as the primary input for calculating-downstream metrics like MTBF and total downtime. To maintain high-quality reporting, this step should focus on capturing detailed information such as the type of failure, the duration of the repair, and any unplanned interruptions. Without a thorough and systematic extraction of these logs, the entire reporting cycle becomes vulnerable to inaccuracies that can misrepresent the true state of your equipment's performance.
Step 2: Fetching Asset Master Data
Once the maintenance logs have been retrieved, the next critical step in the workflow is to Fetch Asset Master Data. While maintenance logs provide a chronological history of repairs and failures, they lack the necessary context required to make that data meaningful.
To transform raw logs into actionable intelligence, you must integrate them with your comprehensive asset registry. This process involves pulling essential metadata for every piece of equipment, including:
- Asset Identification: Unique IDs, names, and classifications.
- Criticality Rankings: Determining which assets have the highest impact on production.
- Operational Parameters: Installation dates, manufacturer specifications, and design life.
- Location Data: Specificity regarding which production line or facility the asset belongs to.
By merging your maintenance history with this master data, you create a unified dataset. This step is foundational; without accurate asset master data, you cannot accurately assign downtime to specific departments or identify whether recurring failures are isolated to a particular manufacturer or asset class. This enrichment phase ensures that all subsequent calculations-such as MTBF and Availability-are mapped to the correct physical assets.
Phase 2: Core Metric Calculations
Once the raw data from maintenance logs and asset master records has been successfully retrieved, the workflow transitions into the most critical stage: the computational engine of the reporting process. This phase is where raw data is transformed into actionable intelligence through a series of interdependent mathematical operations.
The calculation sequence begins with assessing reliability and operational impact. First, we derive the Mean Time Between Failures (MTBF) to identify how frequently equipment is breaking down, followed by the calculation of Total Downtime to quantify the duration of lost production. To understand the economic impact, the system aggregates all related expenses to determine the Maintenance Cost Total.
With these foundational metrics established, the workflow moves into high-level performance indicators. We calculate the Availability Percentage to measure equipment readiness and the Maintenance Cost Ratio to evaluate the efficiency of the maintenance budget relative to total production value.
The culmination of these calculations is the update of the Asset Health Score, a single, powerful metric that summarizes the operational integrity of each individual piece of equipment. This stage is essential, as it converts fragmented data points into the standardized KPIs required for the subsequent visualization and reporting phases.
Step 3: Calculating Mean Time Between Failures (MTBF)
Once the raw data from your maintenance logs and asset master records are synchronized, the core analytical phase begins with calculating the Mean Time Between Failies (MTBF). This metric serves as the primary indicator of an asset's reliability and the effectiveness of your preventive maintenance strategy.
To calculate MTBF, you must determine the total operational time of an asset and divide it by the number of failures that occurred during a specific period. A decreasing MTBF is a critical red flag, signaling that equipment is failing more frequently and that your current maintenance intervals may be insufficient. By quantifying this metric, you move from reactive firefighting to a data-driven approach, allowing you to predict potential breakdowns before they escalate into costly unplanned downtime.
Step 4: Calculating Total Downtime
After determining the frequency of equipment failures via MTBF, the next critical step in the reporting workflow is calculating the Total Downtime. This metric quantifies the cumulative period during which an asset was non-operational due to unplanned breakdowns or scheduled maintenance activities.
To calculate this accurately, the system must aggregate the duration of every down event recorded in the maintenance logs. This involves subtracting the timestamp of asset restoration from the timestamp of the initial failure. It is important to distinguish between unplanned downtime (unforeseen breakdowns) and planned downtime (preventative maintenance), as the former directly impacts operational efficiency and necessitates more urgent investigation. A rising trend in total downtime is a primary indicator of aging machinery or an ineffective preventative maintenance strategy.
Step 5: Calculating Total Maintenance Cost
Once the breakdown of labor, spare parts, and external service fees has been aggregated, the next critical step in the reporting workflow is to Calculate Total Maintenance Cost. This stage involves consolidating all financial data points captured during the reporting period to arrive at a single, comprehensive figure representing the total investment in asset upkeep.
To achieve an accurate total, the process must include not only the direct costs-such as the price of replacement components and technician wages-but also the indirect costs, such as the cost of consumables and any specialized tooling depreciation. By summing these variables, you create the foundation necessary for more advanced metrics, such as the Maintenance Cost Ratio, allowing you to evaluate how much of your total operational budget is being consumed by reactive versus proactive maintenance activities.
Step 6: Calculating Availability Percentage
Once the raw data for downtime and total operating time has been gathered, the next critical step in the reporting process is calculating the Availability Percentage. This metric is a vital indicator of how effectively your maintenance strategy is keeping your machinery operational.
To calculate this, you must determine the ratio of the time the asset was actually functional versus the total time it was scheduled to be in operation. The formula typically follows this logic:
Availability % = (Total Scheduled Time - Total Downtime) / Total Scheduled Time × 100
A high availability percentage indicates a reliable fleet, while a declining percentage serves as an early warning sign of increasing equipment instability or inefficient repair processes. By quantifying this metric, maintenance managers can move beyond guesswork and pinpoint exactly how much productive time is being lost to unplanned breakdowns and maintenance delays.
Step 7: Calculating Maintenance Cost Ratio
The Maintenance Cost Ratio is a critical metric that evaluates the efficiency of your maintenance strategy by comparing your total maintenance expenditure against the total value of your assets or your total production value. This calculation moves the focus from purely technical performance to financial impact, allowing stakeholders to understand how much of the organization's budget is being consumed by upkeep activities.
To calculate this ratio, you divide the total maintenance costs (which include labor, parts, and outsourced services) by the total asset replacement value or the total revenue generated by the equipment. A rising ratio often indicates that an asset is becoming too expensive to maintain, signaling a potential need for replacement rather than continued repair. By monitoring this metric closely, maintenance managers can provide data-driven justifications for capital expenditures and identify specific machines that are disproportionately draining the company's bottom line.
Phase 3: Insight Generation and Visualization
Once the raw data has been gathered and the foundational metrics calculated, the workflow shifts from data processing to true intelligence gathering. This phase is where raw numbers are transformed into actionable business intelligence through a series of complex analytical steps.
The process begins with the heavy lifting of mathematical computation. First, the system calculates the Mean Time Between Failures (MTBF) and Total Downtime to establish the reliability baseline of your equipment. Simultaneously, we aggregate the Total Maintenance Cost and derive the Availability Percentage to understand how much of your operational window is being lost to repairs. To provide a deeper financial perspective, the Maintenance Cost Ratio is calculated, allowing stakeholders to see the cost of maintenance relative to the total value of the assets.
With these core metrics established, the workflow moves into advanced synthesis:
- Creating the KPI Monthly Summary: Consolidating all metrics into a high-level overview.
- Updating Asset Health Scores: Re-calculating individual equipment scores based on recent performance trends.
- Generating the Monthly KPI Dashboard: Visualizing the data through intuitive charts and graphs for immediate comprehension.
The final layer of this phase involves a critical layer of human and automated oversight. Before any report leaves the department, the system triggers a Review of KPI Anomalies to flag unexpected spikes in downtime or costs. This is followed by a rigorous Data Accuracy Verification to ensure the integrity of the insights. Only after these checks are complete is the Monthly Report Distributed to key stakeholders, effectively Closing the Reporting Period and setting the stage for the next operational cycle.
Step 8: Creating the KPI Monthly Summary
Once the core metrics-such as MTBF, downtime, and cost ratios-have been calculated, the next critical step is to aggregate this raw data into a KPI Monthly Summary. This stage is where individual data points transition into actionable intelligence.
The goal of the Monthly Summary is to provide a high-level snapshot of the maintenance department's performance over the previous thirty days. Rather than looking at every single asset in isolation, this step involves grouping the calculated metrics into a consolidated view that highlights trends and departmental aggregates. This summary acts as the executive digest, condensing complex mathematical outputs into a digestible format that reveals whether the maintenance strategy is trending toward operational excellence or increasing instability. By consolidating these figures, you create the foundation necessary for the more visual and detailed dashboarding that follows.
Step 9: Updating Asset Health Scores
Once the monthly KPIs are calculated, the workflow moves into a critical phase of long-term strategic planning: Updating Asset Health Scores. This step transforms raw performance data into actionable intelligence by re-evaluating the physical condition and reliability of every piece of equipment in your inventory.
An Asset Health Score is not a static number; it is a dynamic metric that reflects the real-world impact of the month's maintenance activities. By integrating the newly calculated MTBF, downtime, and cost ratios, you can transition from reactive monitoring to predictive maintenance. For instance, an asset that shows a declining MTBF and increasing repair costs will see its health score drop, triggering an automatic flag for potential overhaul or replacement.
Updating these scores ensures that your maintenance strategy remains proactive. It allows maintenance managers to identify which assets are aging out and which are performing optimally, ensuring that budget and labor resources are allocated to the machines that pose the highest risk to operational continuity.
Step 10: Generating the Monthly KPI Dashboard
Once the data has been processed and the key metrics-such as MTBF, availability, and cost ratios-have been calculated and updated, the process moves into the visualization phase. Generating the Monthly KPI Dashboard is where raw numbers are transformed into actionable intelligence.
The goal of this step is to consolidate all the calculated metrics into a single, intuitive visual interface. A well-structured dashboard should provide a high-level overview for executives while allowing maintenance managers to drill down into specific asset details. This involves creating various visualizations, such as:
- Trend Lines: To track MTBF and downtime fluctuations over several months.
- Gauge Charts: To represent the current Availability Percentage and Asset Health Scores at a glance.
- Bar Charts: To compare maintenance costs across different departments or asset classes.
- Heat Maps: To identify specific time periods or asset groups prone to frequent failures.
By automating the generation of this dashboard, you ensure that the reporting process is not just a backward-looking documentation exercise, but a forward-looking strategic tool. This visual summary serves as the single source of truth, enabling stakeholders to quickly identify patterns, recognize operational strengths, and pinpoint areas requiring immediate intervention.
Phase 4: Validation and Distribution
Once the analytical heavy lifting is complete, the focus shifts from computation to ensuring the integrity and accessibility of the insights. This final phase is critical to ensure that the data driving your maintenance strategy is trustworthy and reaches the right stakeholders in a timely manner.
The process begins with Reviewing KPI Anomalies. Before any report is finalized, the data must be scrutinized for outliers or unexpected spikes-such as a sudden drop in MTBF or an unprecedented surge in maintenance costs-which could indicate either a genuine operational crisis or a data entry error. Following this, the Verify Data Accuracy step acts as a final quality gate, ensuring that the calculated metrics align with the raw logs and master data.
Once the data is validated, the Generate Monthly KPI Dashboard step transforms the raw numbers into a visual narrative, making it easy for management to spot trends at a glance. With a finalized dashboard, the Distribute Monthly Report step commences, pushing the insights to department heads, facility managers, and stakeholders to trigger informed decision-making. Finally, the cycle concludes by Closing the Reporting Period, which locks the data to maintain a consistent historical record, ensuring that the foundation for the next month's baseline remains secure and untampered.
Step 11: Reviewing KPI Anomalies
Once the monthly KPI dashboard has been generated, the process moves into a critical phase of analytical scrutiny: Reviewing KPI Anomalies. Data visualization can reveal patterns, but it can also highlight unexpected spikes or drops that require immediate investigation.
During this step, the maintenance manager or analyst must look beyond the standard metrics to identify outliers-data points that deviate significantly from established trends. For instance, a sudden drop in the Availability Percentage or an unexpected surge in Maintenance Cost Ratio shouldn't just be noted; they must be interrogated. Is the anomaly caused by a single catastrophic equipment failure, or is it a symptom of a systemic breakdown in your preventative maintenance schedule?
By systematically reviewing these anomalies, you transform the reporting process from a mere historical record into a proactive diagnostic tool. This stage is where you distinguish between one-off operational hiccups and emerging technical trends, ensuring that the subsequent distribution of the report provides actionable intelligence rather than just raw numbers.
Step 12: Verifying Data Accuracy
Before finalizing the reporting period, it is critical to perform a rigorous audit of the compiled metrics. Verifying data accuracy ensures that the insights presented in your dashboard are built on a foundation of truth rather than technical glitches or manual entry errors. During this stage, you should cross-reference the calculated KPIs-such as MTBF and Availability Percentage-against the raw maintenance logs and asset master data to identify any discrepancies. Even a minor error in downtime calculation or a missed cost entry can lead to skewed maintenance cost ratios, ultimately resulting in flawed decision-making. By implementing a verification step, you safeguard the integrity of your maintenance strategy and build trust in the reporting process across your entire organization.
Step 13: Distributing the Monthly Report
Once the monthly KPI report has been verified and finalized, the final stage of the workflow is distribution. This step is crucial because a report holds no value unless it reaches the stakeholders who have the authority to act on the insights provided.
Effective distribution involves more than just hitting send on an email. It requires ensuring that the right data reaches the right people in a format that is easily digestible. Typically, this involves sharing the comprehensive report with maintenance managers and plant engineers, while providing high-level summaries to operations directors and executive leadership.
To maximize the impact of the reporting process, consider the following best practices during distribution:
- Targeted Communication: Tailor the delivery method to the audience. Executives may prefer a concise PDF summary or a link to a live dashboard, while technical teams may require the full granular breakdown of downtime and MTBF.
- Automated Alerts: Whenever possible, utilize automated distribution lists to ensure that reports are delivered at the same time every month, establishing a predictable rhythm for performance reviews.
- Actionable Context: Accompany the report with a brief executive summary that highlights key wins, significant downtime events, and urgent areas requiring budget or resource allocation.
By closing the loop with a formal distribution process, you transform raw data into a strategic communication tool that drives continuous improvement across your entire maintenance organization.
Step 14: Closing the Reporting Period
The final step in the maintenance KPI reporting workflow is the formal closure of the reporting period. Once the monthly report has been distributed and all stakeholders have been notified, the period must be officially locked in your system.
Closing the period serves two critical purposes: it ensures data integrity by preventing any retroactive changes to the historical records and it establishes a clear demarcation point between the completed month and the new month's data collection. By officially closing the period, you create a single version of truth that serves as the foundation for year-over-year comparisons and long-term trend analysis. This brings the cycle to a successful end, allowing your team to shift focus from retrospective analysis to proactive, data-driven maintenance strategies for the upcoming month.
Conclusion: Driving Continuous Improvement
Implementing a structured Maintenance KPI Reporting Process is more than just a monthly administrative task; it is a strategic engine for operational excellence. By systematically moving from raw data retrieval to the deep analysis of MTBF, downtime, and cost ratios, organizations transition from reactive firefighting to proactive asset management.
The true value of this workflow lies in its ability to transform fragmented logs and asset data into actionable intelligence. As you review anomalies and verify data accuracy, you aren't just closing a reporting period-you are uncovering the hidden patterns that drive equipment reliability and cost efficiency. When used consistently, this cycle fosters a culture of continuous improvement, allowing maintenance teams to optimize resource allocation, extend asset lifecycles, and ultimately safeguard the organization's bottom line.
Resources & Links
- IBM Maximo Maintenance Management: Resources on implementing enterprise asset management (EAM) and automated KPI tracking.
- SAP Asset Management: Insights into integrating maintenance logs with master data for advanced analytics.
- UpKeep CMMS Blog: Practical guides on calculating MTBF, downtime, and maintenance cost ratios.
- Tableau Data Visualization: Tools and tutorials for generating monthly KPI dashboards and visualizing asset health.
- Reliability Centered Maintenance (RCM) Standards: Foundational principles for reviewing KPI anomalies and driving continuous improvement.
- McKinsey Operations Insights: Strategic perspectives on using maintenance data to optimize asset availability and cost ratios.
Found this Article helpful?
Maintenance Management Solution Demo
Maximize equipment uptime & reduce costs! ChecklistGuro streamlines maintenance scheduling, work order management, & asset tracking. Prevent breakdowns, optimize performance, & extend equipment life. Manage it all with our Work OS.
Related Articles
Construction Equipment Maintenance Checklist Template

Paper vs ChecklistGuro in Facility Management
The Ultimate O&M Manual Checklist Template

Excel vs ChecklistGuro in Facility Management
Excel vs ChecklistGuro in Maintenance Management
Your Ultimate Guide to Critical Spares Management: A Checklist Template
Equipment Repair Log Template: Your Guide to Organized Maintenance
Paper vs ChecklistGuro in Maintenance Management
We can do it Together
Need help with
Checklists?
Have a question? We're here to help. Please submit your inquiry, and we'll respond promptly.