Predictive Failure Analysis Workflow
Published: 06/18/2026 Updated: 06/19/2026
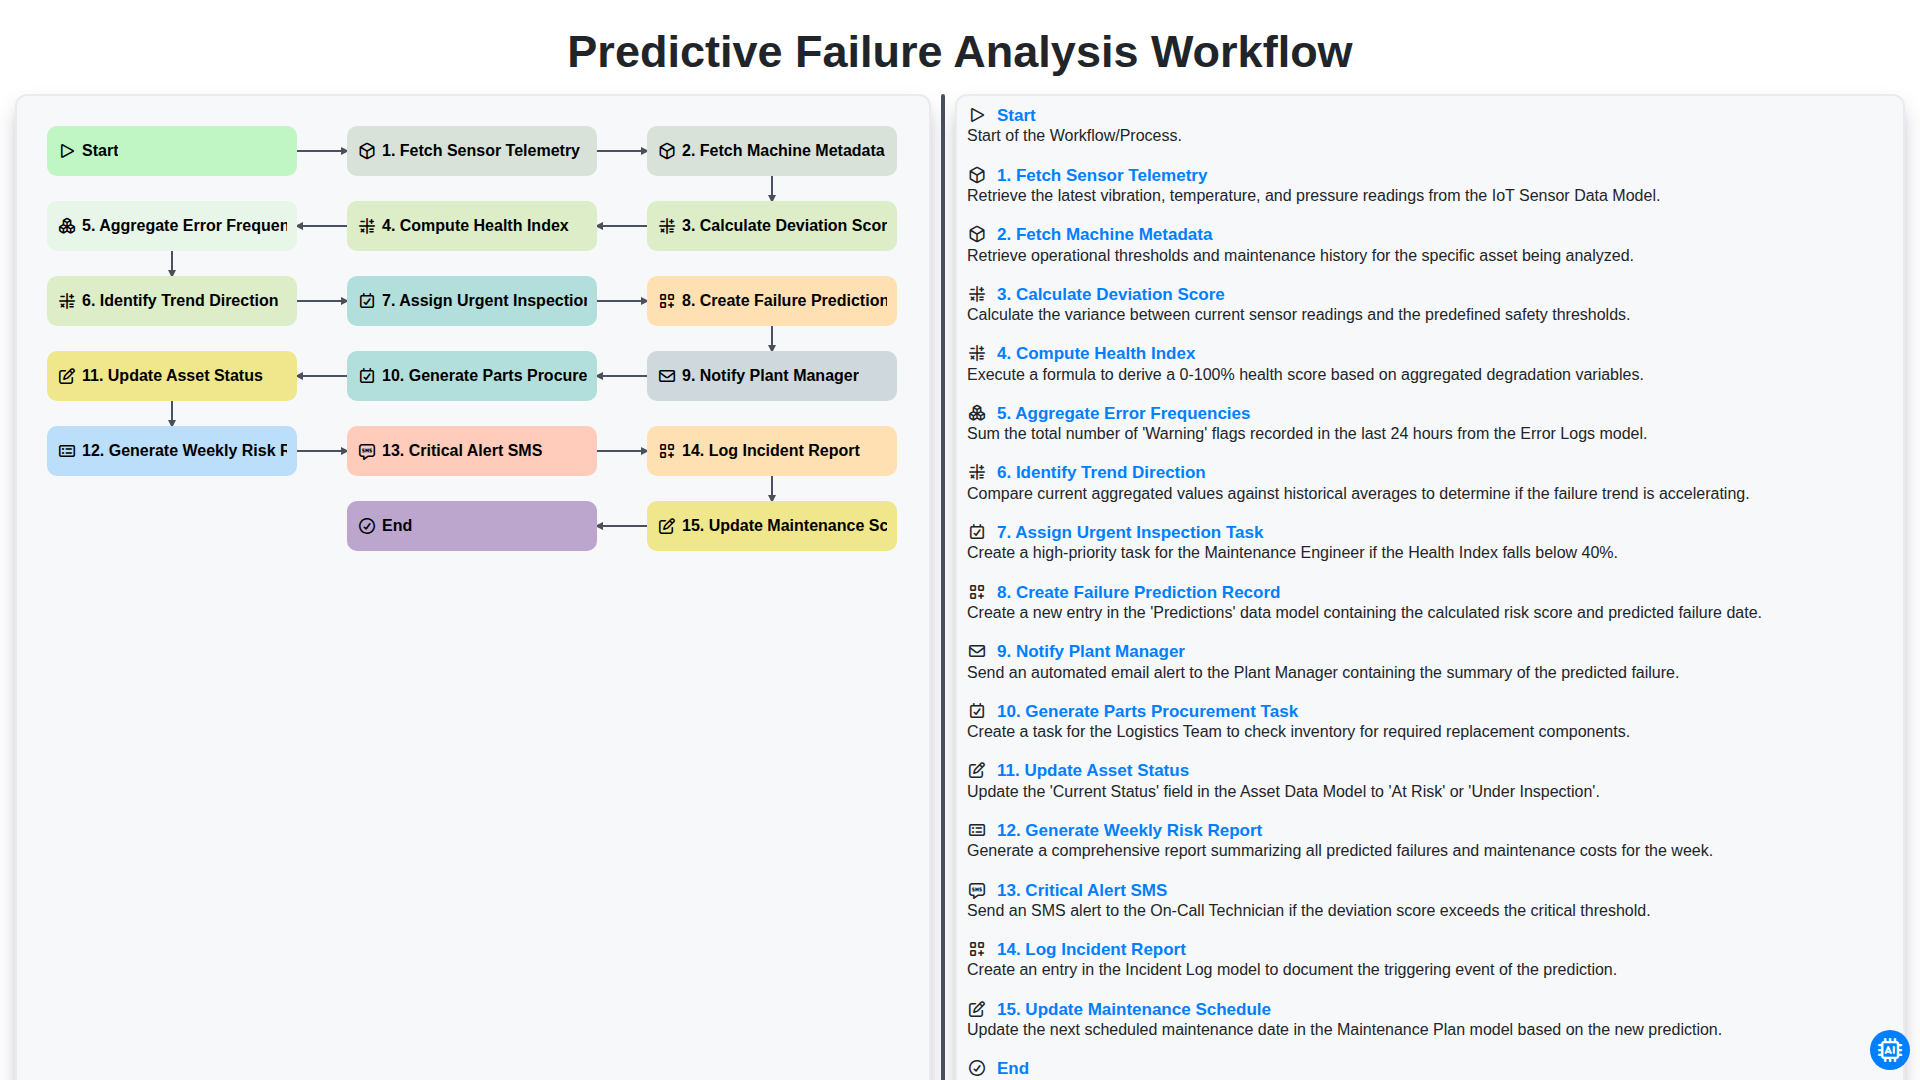
Table of Contents
- Introduction to Predictive Maintenance
- Phase 1: Data Acquisition and Contextualization
- Step 1: Fetching Sensor Telemetry and Machine Metadata
- Phase 2: Real-Time Analytical Processing
- Step 2: Calculating Deviation Scores and Computing Health Indices
- Step 3: Analyzing Error Frequencies and Trend Direction
- Phase 3: Automated Decision Making and Task Assignment
- Step 4: Generating Failure Predictions and Inspection Tasks
- Step 5: Triggering Critical Alerts and Manager Notifications
- Phase 4: Supply Chain and Resource Integration
- Step 6: Procurement Automation and Parts Management
- Phase 5: System Updates and Long-term Documentation
- Step 7: Updating Asset Status and Maintenance Schedules
- Conclusion: Continuous Improvement through Weekly Risk Reporting
- Resources & Links
TLDR: Learn how to automate industrial maintenance with this Predictive Failure Analysis Workflow, which streamlines the process of monitoring sensor telemetry and machine metadata to detect anomalies, calculate health scores, and automatically trigger critical actions like urgent inspections, parts procurement, and real-time manager notifications to prevent costly downtime.
Introduction to Predictive Maintenance
In the modern industrial landscape, the shift from reactive to proactive maintenance is no longer just an advantage-it is a necessity. Traditional maintenance strategies often fall into two extremes: reactive maintenance, where repairs are made only after a breakdown occurs, leading to costly unplanned downtime; and preventative maintenance, which relies on fixed intervals that may result in unnecessary servicing of healthy machinery.
Predictive Maintenance (PdM) bridges this gap by utilizing data-driven insights to intervene exactly when needed. By leveraging real-time sensor data and advanced analytics, organizations can move away from guessing and toward knowing. The core strength of a predictive approach lies in its ability to detect the subtle, often invisible, precursors to mechanical failure. Instead of waiting for a catastrophic breakdown, predictive workflows analyze patterns in vibration, temperature, and pressure to forecast potential issues long before they impact production.
By implementing a structured Predictive Failure Analysis Workflow, companies can transform raw telemetry into actionable intelligence, optimizing asset longevity, reducing operational costs, and ensuring a seamless, uninterrupted production cycle.
Phase 1: Data Acquisition and Contextualization
The foundation of any effective predictive maintenance strategy lies in the integrity and depth of the incoming data. The process begins with Fetching Sensor Telemetry, where real-time streams of high-frequency data-such as vibration, temperature, pressure, and acoustic emissions-are ingested from IoT-enabled assets. However, raw telemetry in isolation lacks the necessary context to be actionable.
To transform these signals into meaningful insights, the workflow simultaneously performs the step of Fetching Machine Metadata. By integrating static and semi-static information-such as machine age, manufacturer specifications, installation date, and historical service records-the system builds a digital twin of the asset. This phase of contextualization ensures that a temperature spike in a brand-new machine is interpreted differently than the same spike in a legacy unit nearing its end-of-life, providing the essential baseline required for accurate anomaly detection.
Step 1: Fetching Sensor Telemetry and Machine Metadata
The foundation of any effective predictive maintenance strategy lies in the quality and comprehensiveness of the incoming data. The workflow begins with two parallel, critical ingestion processes: Fetching Sensor Telemetry and Fetching Machine Metadata.
First, the system initiates a real-time stream of sensor telemetry. This involves pulling high-frequency data points from IoT-enabled devices installed on the factory floor. We collect a variety of critical metrics, such as vibration levels, temperature fluctuations, pressure changes, and acoustic emissions. This granular, time-series data provides the raw heartbeat of the machinery, capturing the minute physical changes that often precede a mechanical breakdown.
However, raw numbers alone lack context. To make sense of the telemetry, the workflow simultaneously performs a fetch of Machine Metadata. This step pulls essential static and semi-static information from the Enterprise Asset Management (EAM) or Computerized Maintenance Management System (CMMS). This includes the machine's age, manufacturer specifications, installation date, operational thresholds, and historical maintenance logs.
By merging the live, dynamic stream of sensor telemetry with the structural context of the machine metadata, we create a digital twin environment. This integrated dataset ensures that when we later calculate deviations, the system knows not just that a temperature has risen, but whether that rise is abnormal for that specific machine's unique operational profile.
Phase 2: Real-Time Analytical Processing
Once the raw data is ingested, the system moves into the core computational engine of the workflow. This phase is where raw telemetry is transformed into actionable intelligence through a series of complex mathematical operations. The process begins by calculating deviation scores, comparing real-time sensor streams against historical baselines to identify anomalies. These scores are then synthesized to compute a health index, providing a single, unified metric representing the current state of the equipment.
To ensure the system distinguishes between one-off spikes and genuine mechanical degradation, the engine will aggregate error frequencies and identify trend directions. By analyzing whether error patterns are accelerating or stabilizing, the workflow can differentiate between transient noise and a developing fault. This layer of analytical processing is crucial; it shifts the logic from reactive observation to proactive pattern recognition, forming the mathematical foundation for the predictive alerts that follow.
Step 2: Calculating Deviation Scores and Computing Health Indices
Once the raw data has been gathered from both the real-time sensor telemetry and the historical machine metadata, the workflow moves into its analytical core. This stage is where raw numbers are transformed into actionable intelligence through two critical computational processes: Calculating Deviation Scores and Computing Health Indices.
The Deviation Score calculation acts as the first line of defense. By comparing real-time streaming data-such as vibration levels, temperature spikes, or pressure fluctuations-against the established golden batch or baseline operational parameters stored in the machine metadata, the system identifies anomalies. A high deviation score indicates that the current machine behavior is drifting away from its normal operating state, signaling the early stages of potential mechanical fatigue or sensor malfunction.
Building upon these scores, the system then performs the more complex task of Computing the Health Index. This is a multi-variable algorithmic process that weighs the magnitude of the deviation scores against the historical reliability of the asset. Unlike a simple alarm, the Health Index provides a normalized, high-level metric (typically on a scale of 0 to 100) that represents the overall structural and operational integrity of the equipment. This single, unified value allows maintenance teams to see at a glance which machines are performing optimally and which are entering a state of degradation, effectively turning complex telemetry into a simplified, intuitive health score.
Step 3: Analyzing Error Frequencies and Trend Direction
Once the system has calculated the deviation scores and established a baseline health index, the workflow moves into a deeper diagnostic phase: Aggregating Error Frequencies and Identifying Trend Direction.
Data points in isolation rarely tell the whole story; it is the pattern of recurrence that signals true operational risk. During the aggregation phase, the system scans historical logs to count how often specific error codes or threshold breaches have occurred within a defined window. A single anomaly might be a transient spike, but a high frequency of repeated deviations indicates a developing systemic issue.
Simultaneously, the workflow analyzes the Trend Direction. By applying time-series analysis to the incoming telemetry, the algorithm determines if the equipment's performance is stable, degrading, or rapidly deteriorating. Identifying whether a deviation is an isolated incident or part of an accelerating downward trend is the make-or-break moment in predictive modeling. This step distinguishes between a minor nuisance and an imminent mechanical failure, ensuring that the subsequent automated actions are proportionate to the actual risk.
Phase 3: Automated Decision Making and Task Assignment
Once the system has successfully computed the health index and identified a concerning trend direction, the workflow transitions from data processing to autonomous action. This phase is where the power of predictive maintenance truly manifests, moving beyond simple monitoring into proactive operational management.
The engine begins by executing a series of high-priority downstream actions. First, it assigns an urgent inspection task to the relevant technician to verify the detected anomaly on-site. Simultaneously, the system formalizes the findings by creating a failure prediction record, ensuring that the historical data is preserved for future model training. To ensure immediate awareness, the system will notify the plant manager and trigger a critical alert SMS if the deviation scores exceed the safety threshold, minimizing the window of risk between detection and response.
To streamline the recovery process and prevent downtime, the workflow automates the logistics of repair. It will automatically generate a parts procurement task if the predicted failure indicates component wear, ensuring necessary materials are staged before the machine even stops. As these tasks are triggered, the system works to update the asset status in the digital twin registry and update the maintenance schedule to prioritize the at-risk equipment. Finally, for long-term oversight, the system will log an incident report for compliance and generate a weekly risk report, providing stakeholders with a comprehensive overview of fleet health and upcoming maintenance requirements.
Step 4: Generating Failure Predictions and Inspection Tasks
Once the system has analyzed the incoming data streams and identified significant deviations, the workflow transitions from data processing to actionable intelligence. This stage is where raw numbers are transformed into proactive maintenance triggers.
The core of this phase involves the automated creation of a Failure Prediction Record, which serves as the single source of truth for the impending anomaly. To ensure this prediction leads to physical intervention, the system immediately Assigns an Urgent Inspection Task to the relevant maintenance technician. This isn't just a notification; it is a structured instruction containing the specific telemetry patterns that triggered the alert, allowing the technician to know exactly what to look for before even arriving at the machine. This proactive leap from detecting a problem to scheduling a solution is what defines a truly predictive maintenance ecosystem.
Step 5: Triggering Critical Alerts and Manager Notifications
Once the system identifies a critical deviation or an accelerating trend in failure probability, the workflow transitions from data processing to immediate-action intelligence. At this stage, the system triggers a Critical Alert SMS to ensure that high-priority risks are communicated instantly, bypassing the latency of email. Simultaneously, the workflow automatically executes the Notify Plant Manager step, delivering a comprehensive summary of the anomaly. This ensures that decision-makers are not just aware of the potential downtime, but are empowered with real-time, actionable insights to intervene before a catastrophic failure occurs.
Phase 4: Supply Chain and Resource Integration
Once a potential failure is identified, the workflow transitions from pure data analysis to actionable operational logistics. The primary goal of this phase is to bridge the gap between predictive insights and physical intervention by integrating the workflow with your supply chain and maintenance resource planning.
To ensure that repairs happen before a breakdown occurs, the system automatically triggers the Generate Parts Procurement Task. This ensures that necessary components are ordered and available on-site before the machine is even taken offline, eliminating the downtime caused by waiting for shipping. Simultaneously, the system will Update Maintenance Schedule, automatically re-prioritizing upcoming service windows to accommodate the predicted failure.
By synchronizing procurement and scheduling, the workflow transforms a simple alert into a complete, end-to-end operational response, ensuring that the right parts and the right personnel are ready exactly when they are needed.
Step 6: Procurement Automation and Parts Management
Once a potential failure is identified and the risk is validated, the workflow shifts from monitoring to proactive mitigation. To prevent downtime caused by waiting for-parts availability, the system automatically triggers a Generate Parts Procurement Task. This step ensures that the supply chain is activated the moment a decline in machine health is detected, rather than waiting for the machine to actually break down. By integrating predictive insights directly with procurement workflows, organizations can maintain just-in-time inventory levels, reducing warehouse overhead while ensuring that critical components are on-site and ready before the scheduled maintenance window begins.
Phase 5: System Updates and Long-term Documentation
Once the immediate crisis has been addressed and the predictive insights have been converted into actionable maintenance tasks, the workflow shifts from reactive mitigation to proactive system refinement. This final phase ensures that the intelligence gained from the failure prediction is encoded into the organization's permanent records, preventing the same error from recurring.
The process begins with the immediate automation of administrative and logistical dependencies. To ensure the repair process is seamless, the system will Generate Parts Procurement Task, ensuring that necessary components are ordered before the machine reaches a state of total breakdown. Simultaneously, the Update Asset Status command is executed to reflect the current operational state of the machinery, providing real-time visibility to all stakeholders.
To maintain the integrity of the maintenance lifecycle, the workflow triggers an Update Maintenance Schedule sequence, adjusting future preventive maintenance windows based on the newly identified wear patterns. This is complemented by the formal Log Incident Report, which captures the full context of the predicted failure for future forensic analysis.
Finally, to ensure long-term strategic oversight, the system will Generate Weekly Risk Report, aggregating all recent deviations and predictions into a high-level summary for engineering teams. By closing the loop with this level of documentation, the workflow transforms a single predictive alert into a continuous improvement cycle for the entire plant's operational health.
Step 7: Updating Asset Status and Maintenance Schedules
Once the predictive analysis has culminated in a failure prediction, the workflow shifts from data processing to operational execution. The final critical phase involves closing the loop between digital insights and physical maintenance.
First, the system performs an automated Update of the Asset Status, transitioning the machine from Operational to At Risk or Requires Inspection within the centralized management dashboard. This ensures that all stakeholders have real-time visibility into the current state of the plant floor, preventing any reliance on outdated information.
Following this status change, the workflow triggers an automated Update to the Maintenance Schedule. Rather than waiting for the next pre-planned downtime period, the system integrates the newly identified risk into the existing maintenance calendar. By dynamically re-prioritizing tasks based on the calculated failure probability, the workflow ensures that technicians are dispatched to address high-risk assets before a breakdown occurs, effectively transforming reactive repairs into a streamlined, proactive maintenance strategy.
Conclusion: Continuous Improvement through Weekly Risk Reporting
The implementation of a Predictive Failure Analysis Workflow does not simply end once an alert is triggered or a task is assigned; its true value lies in the long-term strategic insights gained through the Weekly Risk Report. By aggregating the data from every deviation score, trend direction analysis, and incident log generated throughout the week, this report transforms raw telemetry into actionable business intelligence.
Instead of merely reacting to isolated machine failures, leadership can use these reports to identify systemic patterns across the entire plant floor. Are certain machine models consistently showing higher error frequencies? Is a specific production line prone to recurring deviations? These high-level insights allow for proactive capital expenditure planning and more optimized maintenance budgeting. Ultimately, the weekly reporting cycle closes the loop on the predictive process, turning real-time technical monitoring into a continuous improvement engine that drives operational excellence and long-term asset reliability.
Resources & Links
- IBM: What is Predictive Maintenance?: An in-depth guide explaining the fundamentals of predictive maintenance and how AI-driven analytics prevent equipment downtime.
- AWS Predictive Maintenance Solutions: Resources on implementing cloud-based machine learning workflows for real-time sensor data processing and anomaly detection.
- Microsoft Azure IoT Analytics: Documentation on using IoT Hub and Azure Stream Analytics to calculate deviation scores and compute health indices from telemetry data.
- GE Digital: Industrial AI: Insights into industrial-scale workflows for trend direction analysis and automated maintenance task assignment.
- SAP Predictive Maintenance and Service: A look at integrating failure prediction records with supply chain management and automated parts procurement tasks.
- Cisco IoT Ecosystem: Technical overview of managing machine metadata and large-scale sensor telemetry in complex industrial environments.
- Plotly: Data Visualization for Trends: Tools and libraries used for identifying trend directions and visualizing error frequencies in real-time dashboards.
Found this Article helpful?
Maintenance Management Solution Demo
Maximize equipment uptime & reduce costs! ChecklistGuro streamlines maintenance scheduling, work order management, & asset tracking. Prevent breakdowns, optimize performance, & extend equipment life. Manage it all with our Work OS.
Related Articles
Construction Equipment Maintenance Checklist Template

Paper vs ChecklistGuro in Facility Management
The Ultimate O&M Manual Checklist Template

Excel vs ChecklistGuro in Facility Management
Excel vs ChecklistGuro in Maintenance Management
Your Ultimate Guide to Critical Spares Management: A Checklist Template
Equipment Repair Log Template: Your Guide to Organized Maintenance
Paper vs ChecklistGuro in Maintenance Management
We can do it Together
Need help with
Checklists?
Have a question? We're here to help. Please submit your inquiry, and we'll respond promptly.