Root Cause Analysis (RCA) Checklist
Uncover the *real* reason behind manufacturing issues! Download our free Root Cause Analysis (RCA) Checklist & systematically solve production problems, reduce downtime, and boost efficiency. Manufacturing RCA made easy.
This Template was installed 3 times.
Problem Definition & Data Gathering
Focuses on clearly defining the problem, identifying symptoms, and collecting relevant data to understand the situation.
Detailed Problem Description
Quantity of Affected Units/Batches
Date Problem First Noticed
Time Problem First Noticed
Observed Symptoms and Impacts
Affected Processes/Departments
Relevant Photos/Videos of the Problem
Description of the environment when the problem was observed (temperature, humidity, etc.)
Team Formation & Roles
Ensures the RCA team has the right expertise and defined responsibilities for thorough investigation.
Team Lead Assigned?
Team Lead Name
Key Functional Areas Represented (Select all that apply)
Team Member 1 Name & Role
Team Member 2 Name & Role
Number of Team Members
Brief Description of Team Member Roles & Responsibilities
Has the Team Received RCA Training?
5 Whys & Cause-Effect Diagram (Fishbone)
Utilizes common RCA techniques to explore potential causes and their relationships to the problem.
Describe the Problem Statement in Detail (as understood so far)
Number of 'Whys' Asked for the Initial Problem
Record the First 'Why' and the Answer
Record the Second 'Why' and the Answer
Record the Third 'Why' and the Answer
Record the Fourth 'Why' and the Answer
Record the Fifth 'Why' (or subsequent 'Whys' if needed) and the Answer
Potential Categories for Fishbone Diagram (e.g., Man, Machine, Method, Material, Measurement, Environment)
List Potential Causes within Each Category of the Fishbone Diagram
Data Analysis & Verification
Involves analyzing gathered data, testing hypotheses, and verifying potential root causes.
Statistical Process Control (SPC) Data Points Analyzed
Description of Statistical Analysis Performed (e.g., Regression Analysis, Hypothesis Testing)
Control Chart Type Used (if applicable)
Summary of Data Trends & Anomalies Observed
Data Sources Verified for Consistency
Hypothesis Testing Outcome (If Applicable)
Supporting Data Files (e.g., Excel Spreadsheets, Charts)
Description of how data was verified and cross-referenced
Root Cause Identification & Validation
Definitively identifies the root cause(s) and validates this determination through evidence.
Describe the identified root cause(s) in detail. Provide supporting evidence and data.
Which of the following categories best describes the root cause?
Assign a risk score (1-10, 10 being highest) to the likelihood of the identified root cause recurring if no corrective action is taken.
Upload any supporting documents, charts, or graphs that validate the identified root cause(s).
Explain the methodology used to validate the identified root cause(s). (e.g., statistical analysis, simulation, observation, experimentation)
Is the identified root cause validated by the team?
If the root cause is not validated, explain why and what further investigation is needed.
Corrective Actions & Implementation Plan
Develops and documents specific corrective actions to address the root cause and prevent recurrence.
Detailed Description of Corrective Action(s)
Estimated Cost of Implementation
Planned Start Date of Implementation
Planned Completion Date of Implementation
Responsible Department/Team
Implementation Priority (High, Medium, Low)
Resources Required (Check all that apply)
Potential Risks/Challenges in Implementation
Verification & Monitoring
Establishes a process to verify the effectiveness of corrective actions and monitor for long-term stability.
Baseline Performance Metric Value (Before Action)
Target Performance Metric Value (After Action)
Actual Performance Metric Value (Post-Implementation)
Date of First Verification Measurement
Frequency of Verification Measurements (e.g., weekly, monthly)
Verification Measurement Status
Notes on Verification Measurement (e.g., deviations, anomalies)
Date of Next Scheduled Verification
Documentation & Lessons Learned
Records the entire RCA process, findings, and corrective actions for future reference and continuous improvement.
Summary of RCA Process & Findings
Detailed Description of Corrective Actions Implemented
Estimated Cost of Corrective Actions
Date of RCA Completion
Lessons Learned & Recommendations for Future RCAs
Categories of System/Process Impacted by the Root Cause?
Contact Person for Follow-up & Verification
Supporting Documentation (e.g., data reports, diagrams)
Found this Checklist Template helpful?
Manufacturing Management Solution Demo
Stop chasing paperwork and wrestling with disconnected systems! Our solution brings clarity and control to your production process. From standard operating procedures (SOPs) and equipment maintenance to quality control and inventory tracking, we simplify every step.
Related Checklist Templates
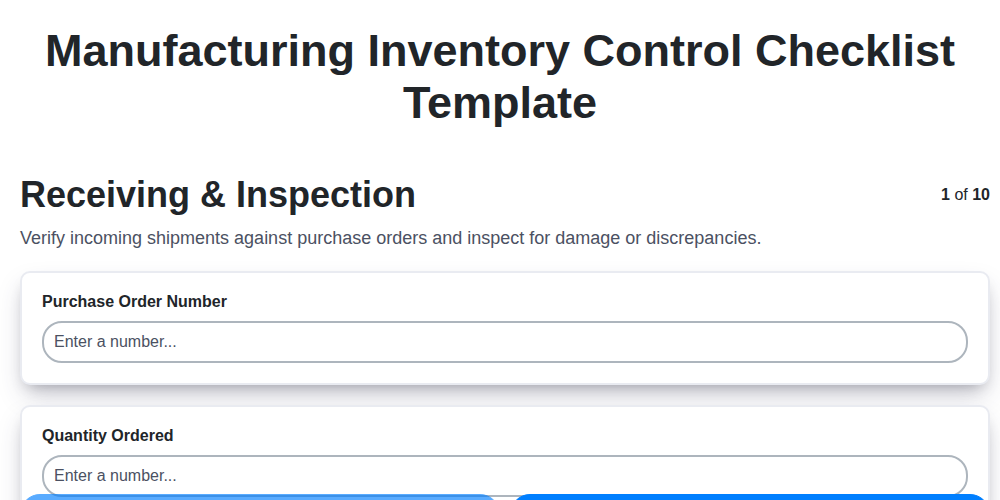
Manufacturing Inventory Control Checklist Template
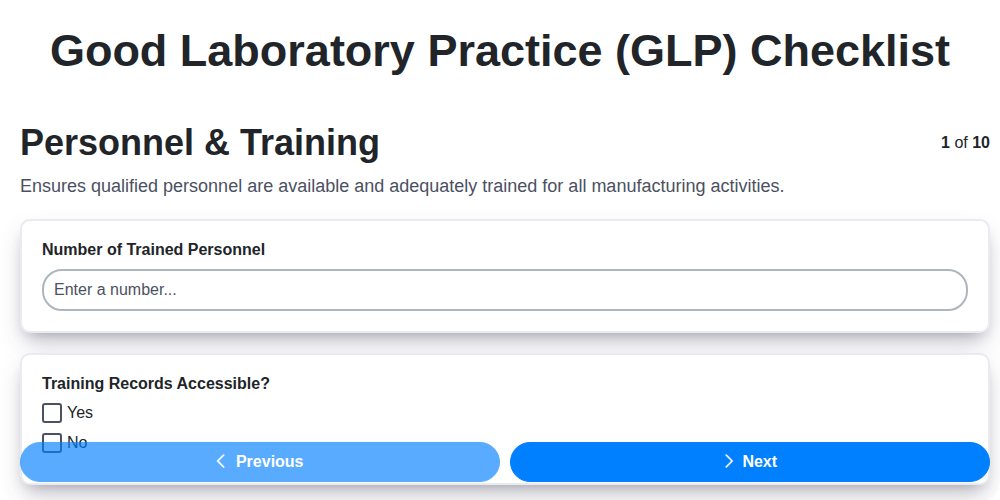
Good Laboratory Practice (GLP) Checklist

Confined Space Entry Checklist
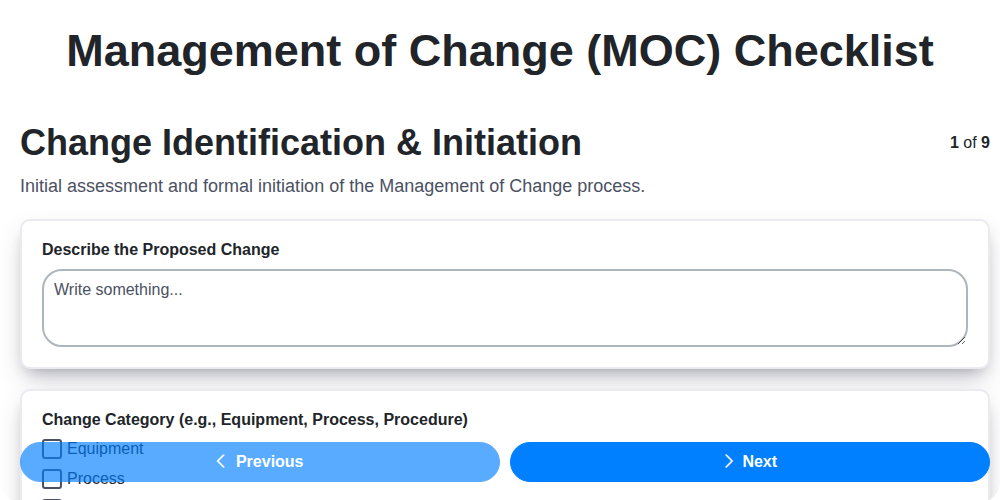
Management of Change (MOC) Checklist
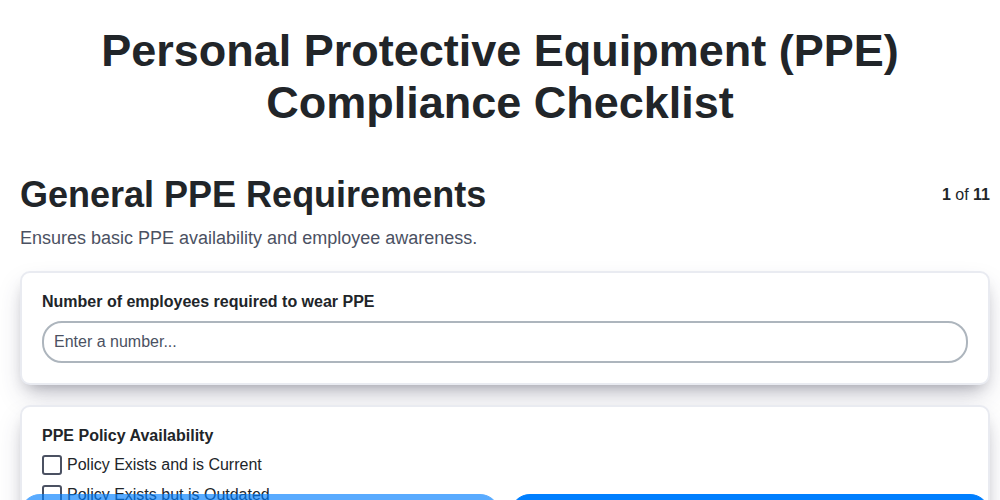
Personal Protective Equipment (PPE) Compliance Checklist
A3 Problem Solving Report Checklist
Ergonomic Assessment Checklist
First Article Inspection (FAI) Checklist
We can do it Together
Need help with
Manufacturing?
Have a question? We're here to help. Please submit your inquiry, and we'll respond promptly.