Smart Farming: Field Data Collection & Analysis Workflow for Agriculture
Published: 06/04/2026 Updated: 06/05/2026
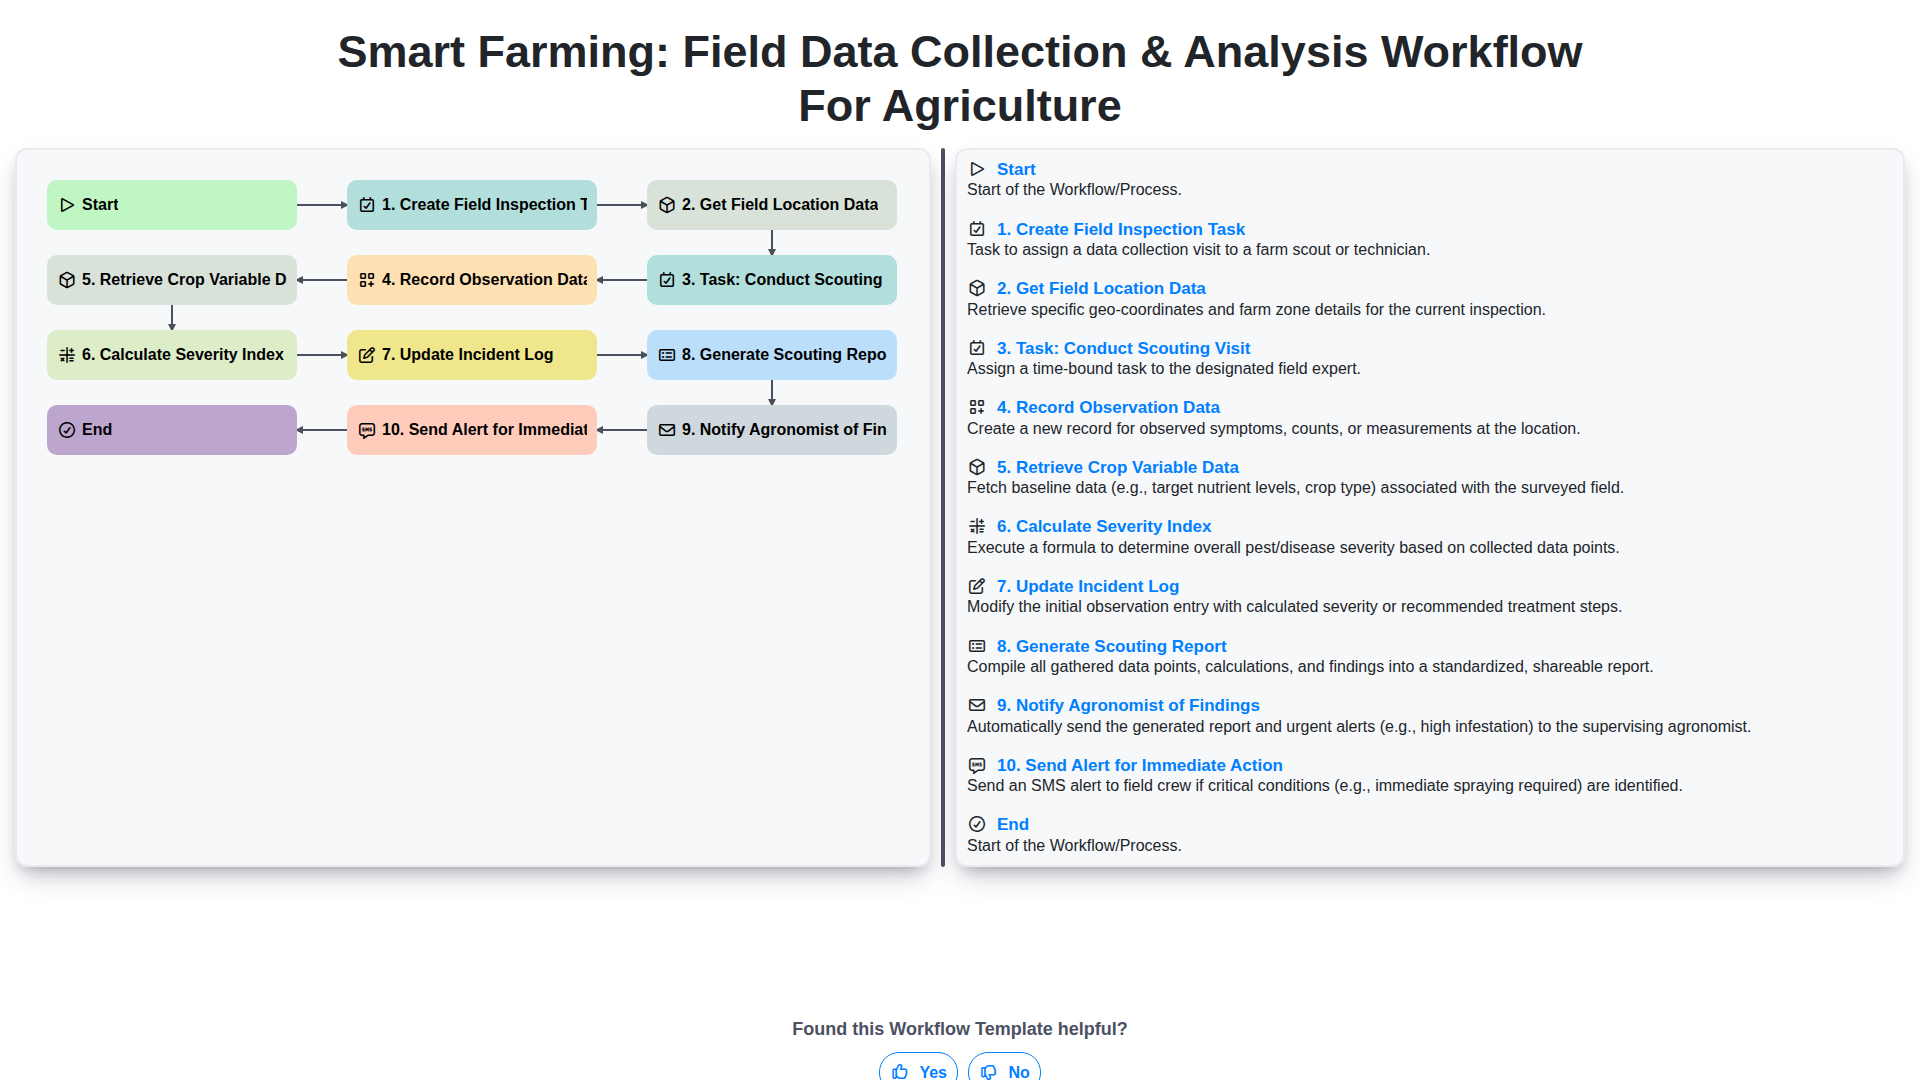
Table of Contents
- Introduction: The Era of Precision Agriculture
- Step 1: Initiating the Cycle: Creating Field Inspection Tasks
- Step 2: Precision Mapping: Getting Accurate Field Location Data
- Step 3: On-the-Ground Execution: Conducting the Scouting Visit
- Step 4: Digital Documentation: Recording Real-Time Observation Data
- Step 5: Integrating Sensor Intelligence: Retrieving Crop Variable Data
- Step 6: Data-Driven Insights: Calculating the Severity Index
- Step 7: Maintaining the Audit Trail: Updating the Incident Log
- Step 8: Turning Data into Knowledge: Generating the Scouting Report
- Step 9: Closing the Communication Loop: Notifying Agronomists
- Step 10: Rapid Response: Sending Alerts for Immediate Action
- Conclusion: Maximizing Yield through Automated Workflows
- Resources & Links
TLDR: Streamline your precision agriculture processes with this automated workflow designed to bridge the gap between field scouting and actionable insights. Learn how to seamlessly transition from creating inspection tasks and collecting real-time field data to calculating severity indices and triggering instant alerts for agronomists, ensuring rapid response to crop threats.
Introduction: The Era of Precision Agriculture
The landscape of modern agriculture is undergoing a profound transformation, moving away from traditional intuition-based farming toward a data-driven paradigm known as precision agriculture. For decades, farmers relied heavily on physical experience and visual estimates to manage crop health. However, as global food demands rise and climate volatility increases, the margin for error has shrunk significantly.
Today, the integration of digital workflows and real-time analytics allows producers to move beyond simple observation. We are entering an era where every square meter of a field can be monitored, measured, and managed with surgical precision. By leveraging automated data collection and sophisticated analysis, growers can identify pest outbreaks, nutrient deficiencies, or irrigation issues long before they become visible to the naked eye. This shift from reactive to proactive management is not just about increasing yields-it is about optimizing resources, reducing chemical inputs, and ensuring the long-term sustainability of the land. In this article, we will explore a streamlined, end-to-end workflow designed to bridge the gap between field observations and actionable intelligence.
Step 1: Initiating the Cycle: Creating Field Inspection Tasks
The foundation of a successful precision agriculture strategy lies in moving from reactive troubleshooting to proactive management. The workflow begins long before a scout ever sets foot in a field; it starts with the strategic creation of a Field Inspection Task.
Instead of wandering through crops aimlessly, the process is triggered by specific, data-driven needs-whether it's a scheduled seasonal check, a response to a weather event, or a subtle change in satellite imagery. By formalizing an inspection task within your digital management system, you establish a clear objective, define the specific boundaries of the area to be inspected, and set a timeframe for completion. This initial step ensures that every scouting mission is purposeful, documented, and integrated into the larger farm management ecosystem, setting the stage for precise data collection.
Step 2: Precision Mapping: Getting Accurate Field Location Data
Once a field inspection task is initialized, the next critical step is ensuring that the digital workflow is tethered to the physical reality of the farm. Precision farming is impossible without spatial accuracy, which is why Getting Field Location Data is the backbone of the entire process.
In this stage, the workflow integrates Geographic Information System (GIS) data and GPS coordinates to define the exact boundaries of the area under inspection. Instead of relying on vague descriptions like the north acreage, the system pulls precise polygon data, satellite imagery, and soil map overlays. This ensures that every observation recorded later in the process is timestamped and georeferenced to a specific coordinate. By capturing high-resolution location data at the start, we eliminate human error and ensure that when an agronomist receives an alert, they know exactly which square meter of the field is under stress, allowing for targeted interventions rather than broad, expensive, and inefficient field-wide treatments.
Step 3: On-the-Ground Execution: Conducting the Scouting Visit
Once the digital framework is set and the location data is pinpointed, the workflow moves from the office to the field. This is the most critical phase of the process: Conducting the Scouting Visit.
At this stage, the pre-defined inspection task serves as your digital roadmap. Rather than wandering aimlessly through rows of crops, the scout follows the precise GPS coordinates retrieved in the previous step to ensure every target area is covered. The objective is no longer just looking at plants, but rather systematic data acquisition.
As the scout moves through the field, the focus shifts to Recording Observation Data. Using mobile devices or handheld sensors, the scout documents real-time findings-such as pest presence, nutrient deficiencies, or signs of disease. This isn't merely qualitative observation; it is the precise capture of field-level intelligence. By digitizing these observations on-site, you eliminate the data lag and human error common with paper-based methods, ensuring that the transition from physical observation to digital analysis is seamless and instantaneous.
Step 4: Digital Documentation: Recording Real-Time Observation Data
Once the scouting visit is underway, the workflow shifts from planning to active data capture. This stage is the backbone of precision agriculture, as it transforms physical observations into actionable digital intelligence. Instead of relying on paper notebooks and manual entry-which are prone to human error and data loss-farmers and scouts use mobile applications to record observation data in real-time.
During this phase, the scout identifies and logs specific field conditions, such as pest presence, disease symptoms, or nutrient deficiencies. Digital documentation allows for the attachment of high-resolution photos, GPS-tagged waypoints, and precise notes directly to the specific field location. By capturing this data on-site, you ensure that the information is synchronized instantly with your management system, eliminating the data lag between the field and the office. This real-time recording ensures that every detail of the crop's health is captured with high fidelity, providing a reliable foundation for the subsequent analysis and decision-making steps.
Step 5: Integrating Sensor Intelligence: Retrieving Crop Variable Data
Once the physical scouting visit is underway, the workflow moves beyond simple visual observation to incorporate high-precision digital insights. The next critical step is to Retrieve Crop Variable Data, which bridges the gap between human eyes and machine intelligence.
In modern precision agriculture, a scout's eyes are augmented by data pulled directly from the field's digital ecosystem. This involves integrating real-time telemetry and remote sensing data-such as NDVI (Normalized Difference Vegetation Index) maps from satellites, moisture levels from IoT soil sensors, and thermal imagery from drones. By pulling this variable data into your workflow, you are no longer relying solely on anecdotal evidence. Instead, you are layering physical observations with quantitative metrics, allowing you to see patterns of plant stress, nutrient deficiency, or water scarcity that might be invisible to the naked eye. This integration transforms a simple inspection into a data-driven diagnostic session.
Step 6: Data-Driven Insights: Calculating the Severity Index
Once the raw observation data has been recorded in the field, the workflow transitions from simple data collection to intelligent analysis. This is where the true power of precision agriculture lies. By integrating your recorded observations with retrieved crop variable data-such as NDVI (Normalized Difference Vegetation Index) from satellite imagery or drone NDVI maps-the system can perform a sophisticated comparison between real-world sightings and remote sensing indices.
The core of this process is the calculation of the Severity Index. This mathematical evaluation measures the gap between the current crop health and the ideal physiological state. By layering qualitative scouting notes (like pest density or wilting levels) over quantitative spatial data, the system can quantify the exact impact of a biological or environmental stressor. This step transforms noticing a problem into measuring a threat, providing a standardized metric that allows for objective decision-making and precise-rate application of inputs.
Step 7: Maintaining the Audit Trail: Updating the Incident Log
Once the severity index has been calculated and the immediate data points are processed, the workflow moves into a critical phase of data integrity: updating the incident log. This step ensures that every anomaly, pest detection, or nutrient deficiency identified during the scouting visit is formally documented within a centralized, permanent record.
Maintaining a detailed incident log is about more than just recording what went wrong; it is about creating a searchable, historical audit trail that serves as the single source of truth for the entire farm operation. By updating the log in real-time, you bridge the gap between field observation and long-term decision-making. This ensures that when looking back at the end of a season, or when comparing current yields to previous years, there is an unambiguous record of exactly when an issue was first detected, its documented severity, and the subsequent actions taken. This continuity is vital for compliance, precision planning, and refining your long-term agronomic strategies.
Step 8: Turning Data into Knowledge: Generating the Scouting Report
The true value of field scouting lies not in the collection of raw data, but in the transformation of that data into actionable intelligence. Once the observation data is recorded and the severity indices are calculated, the workflow moves into its most critical phase: Generating the Scouting Report.
This step acts as the bridge between manual field observations and strategic decision-making. Rather than leaving agronomists to sift through fragmented notes or disparate spreadsheets, the automated generation of a scouting report aggregates all critical inputs-including GPS-tagged locations, crop variability data, and calculated pest or disease severity levels-into a single, unified document.
A high-quality, automated report provides a comprehensive snapshot of the field's health at a specific moment in time. It contextualizes anomalies by layering real-time observations over historical field data, allowing stakeholders to see not just what is happening, but where and how severe the issue is. By streamlining this process, the workflow eliminates human error in data transcription and ensures that the knowledge extracted from the field is accurate, structured, and ready for immediate analysis. This report serves as the foundational evidence needed to justify interventions, optimize input usage, and drive the next steps in the precision agriculture cycle.
Step 9: Closing the Communication Loop: Notifying Agronomists
Once the data has been processed and the severity index calculated, the workflow moves into its most critical phase: moving from insight to action. Data is only as valuable as the decisions it inspires, which is why notifying the agronomist of findings is a non-negotiable step in a smart farming ecosystem.
Rather than waiting for a manual review of spreadsheets or paper logs, the system automatically pushes the analyzed results directly to the relevant experts. By integrating real-time notifications, you eliminate the information lag that often allows pests or diseases to spread unchecked. This automated handoff ensures that the person with the expertise to solve the problem is the first to know when a threshold has been breached, transforming raw field data into an actionable directive.
Step 10: Rapid Response: Sending Alerts for Immediate Action
The workflow culminates in the most critical phase: the transition from insight to action. Once the system identifies a high-severity index or a critical anomaly during the data analysis stage, it triggers an automated alert system. This ensures that urgent issues-such as sudden pest outbreaks, irrigation failures, or severe nutrient deficiencies-do not sit unnoticed in a database.
Rather than waiting for the next scheduled inspection, the system pushes real-time notifications directly to the mobile devices of field managers and technicians. By automating this red flag mechanism, you eliminate the dangerous gap between detection and intervention. This rapid response capability transforms your data from a mere historical record into a proactive tool, allowing for precision interventions that can save entire crops from potential loss.
Conclusion: Maximizing Yield through Automated Workflows
In the era of precision agriculture, the transition from manual, fragmented processes to a structured, automated workflow is no longer a luxury-it is a necessity for survival. By integrating every stage of the lifecycle-from the initial creation of a field inspection task to the final, high-priority alert sent to an agronomist-farmers can eliminate the information gaps that often lead to crop loss and wasted resources.
The true power of this workflow lies in its ability to turn raw, scattered data into actionable intelligence. When field location data, crop variables, and observation records flow seamlessly into a centralized system to calculate a severity index, decision-making moves from guesswork to precision. This automation ensures that critical issues are not just recorded, but actively communicated, triggering immediate actions when the crop is most vulnerable. Ultimately, adopting this systematic approach to data collection and analysis allows you to minimize human error, optimize input usage, and, most importantly, maximize your yield through proactive, data-driven stewardship of your land.
Resources & Links
- Precision Agriculture Fundamentals: A comprehensive guide to understanding how data-driven decision-making transforms modern farming practices.
- GIS for Agriculture: Resources on utilizing Geographic Information Systems (GIS) for precise field mapping and location data management.
- Smart Farming Technology: Insights into how integrated machinery and sensors provide critical crop variable data and real-time field insights.
- Environmental Variable Monitoring: Information on tracking climate and environmental factors that contribute to calculating crop severity indices.
- Digital Farm Management Software: Tools and workflows for automating scouting reports, incident logging, and agronomist notifications.
- AI in Crop Analytics: Exploring how artificial intelligence processes observation data to automate the detection of crop stress and pests.
Found this Article helpful?
Agriculture Management Solution Demo
Running a farm or agricultural business is complex. ChecklistGuro's Work OS platform simplifies your operations, from crop planning and irrigation management to livestock tracking and harvest scheduling. Increase efficiency, reduce waste, and boost yields! See how ChecklistGuro can revolutionize your agriculture business.
Related Articles
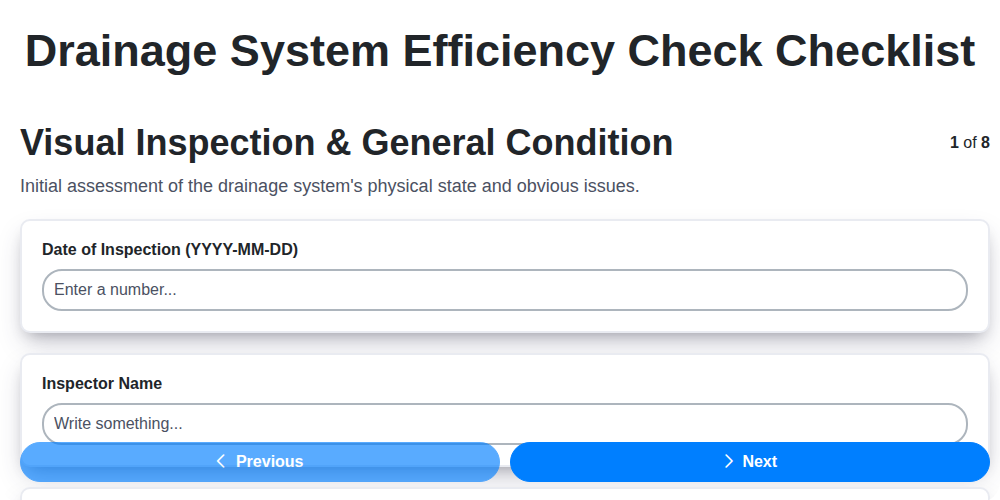
10 Simple Steps to a Healthy Drainage System: Your Checklist Template

Mastering the Daily Crop Scouting Report: Your [Specific Crop] Checklist Template
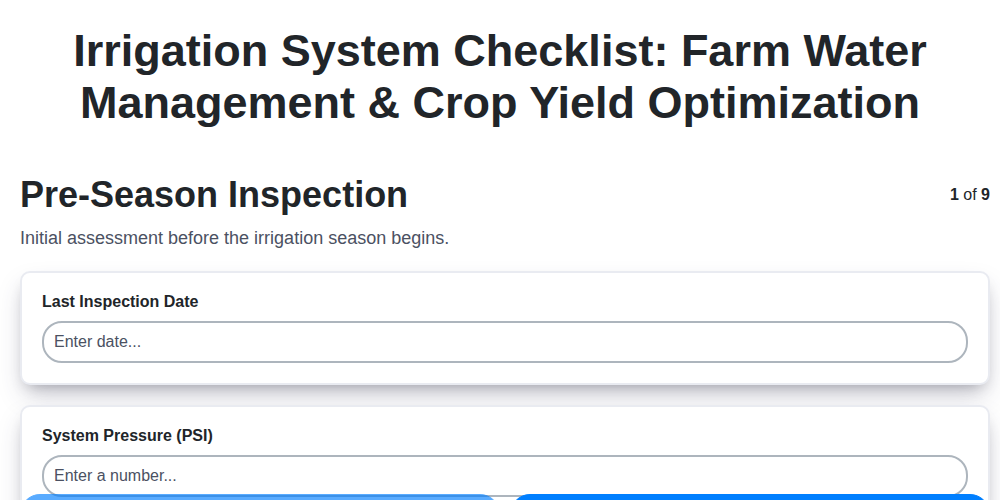
Irrigation System Checklist: Farm Water Management & Crop Yield Optimization
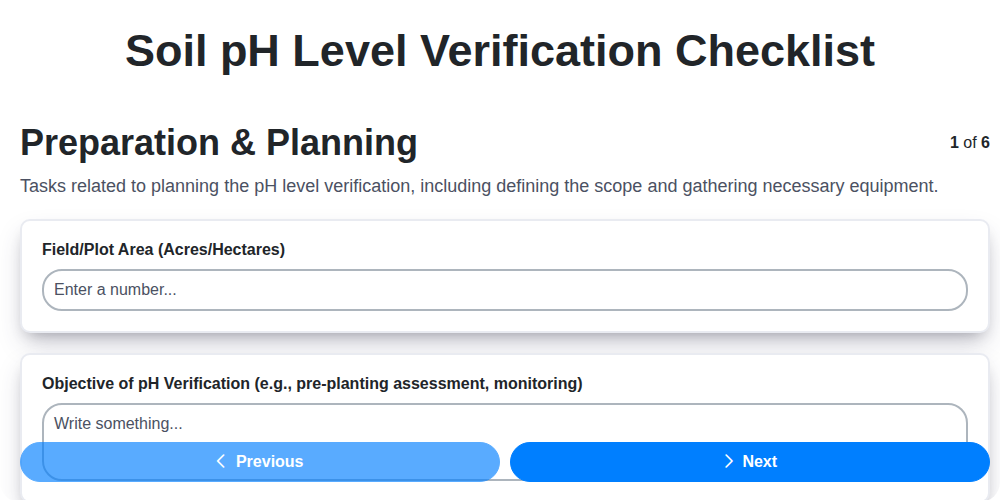
Unlock Your Garden's Potential: A Soil pH Verification Checklist
PPE Usage Checklist Template: Your Guide to Safety
Water Discharge Permit Compliance Checklist Template
The Ultimate GPS & Precision Farming Calibration Checklist Template
Water Runoff Analysis Checklist Template
We can do it Together
Need help with
Checklists?
Have a question? We're here to help. Please submit your inquiry, and we'll respond promptly.