Warehouse Space Utilization Optimization Process: A Step-by-Step Workflow Template
Published: 06/04/2026 Updated: 06/05/2026
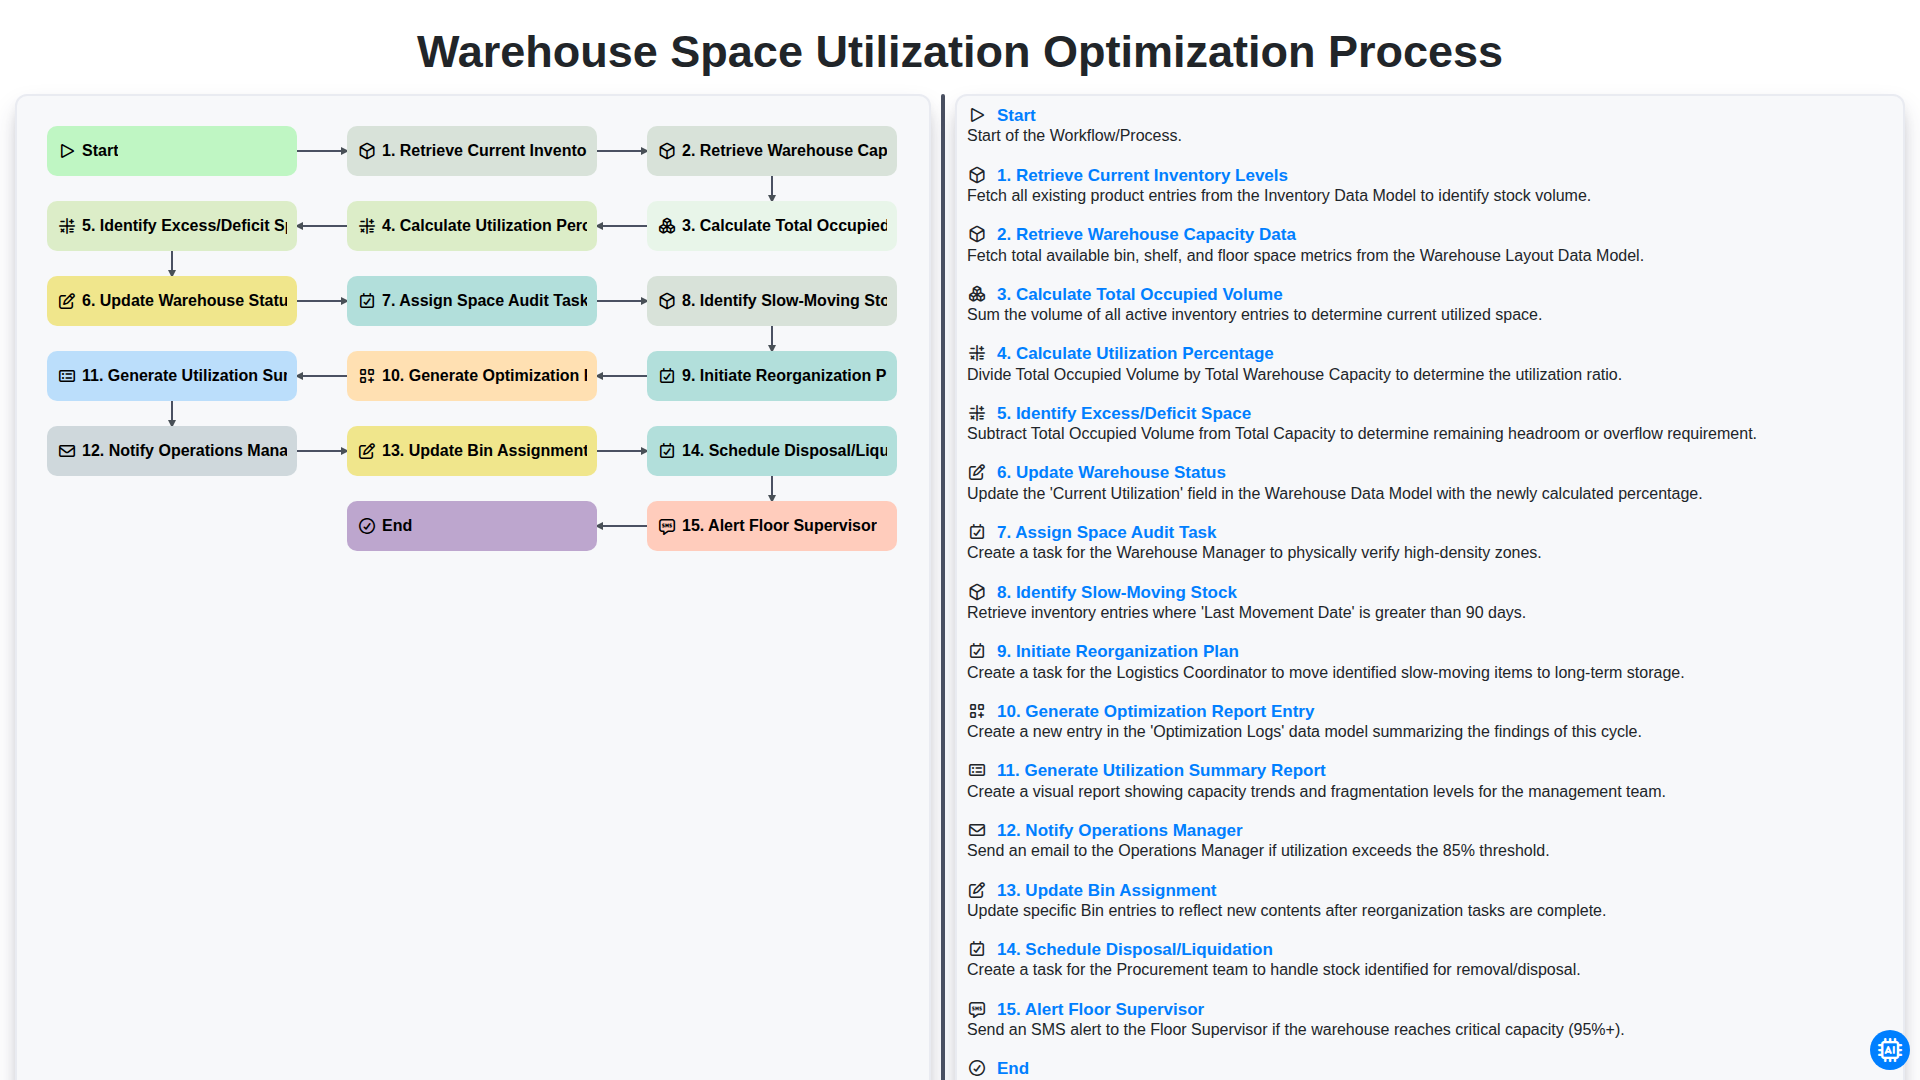
Table of Contents
- Introduction: The Importance of Warehouse Space Optimization
- Phase 1: Data Collection and Baseline Assessment
- Step 1: Retrieving Current Inventory Levels
- Step 2: Retrieving Warehouse Capacity Data
- Phase 2: Calculating Utilization Metrics
- Step 3: Calculating Total Occupied Volume
- Step 4: Determining the Utilization Percentage
- Phase 3: Gap Analysis and Space Identification
- Step 5: Identifying Excess or Deficit Space
- Step 6: Identifying Slow-Moving Stock for Review
- Phase 4: Actionable Optimization Strategies
- Step 7: Initiating the Reorganization Plan
- Step 8: Updating Bin Assignments and Warehouse Status
- Step 9: Managing Surplus through Disposal or Liquidation
- Phase 5: Monitoring, Reporting, and Communication
- Step 10: Generating Optimization Reports and Summaries
- Step 11: Communicating Updates to Management and Floor Supervisors
- Resources & Links
TLDR: Learn how to maximize warehouse efficiency with our comprehensive workflow template designed to streamline space optimization. This guide explains how to automate the process of monitoring inventory levels, calculating utilization percentages, and executing actionable reorganization strategies to eliminate dead space and optimize storage capacity.
Introduction: The Importance of Warehouse Space Optimization
In the fast-paced world of logistics and supply chain management, warehouse space is one of your most valuable-and expensive-assets. Every square foot of your facility represents an investment in overhead, labor, and utility costs. When space is managed inefficiently, it leads to a cascade of operational bottlenecks: cluttered aisles, increased picking times, wasted energy, and the high cost of dead storage.
Maximizing your facility's potential isn't just about finding more room; it is about mastering the art of Warehouse Space Utilization Optimization. Achieving an optimal balance between available capacity and current inventory levels is critical for maintaining a lean, agile, and cost-effective operation. By implementing a structured, data-driven workflow, businesses can move away from reactive firefighting and toward a proactive strategy that identifies inefficiencies before they impact the bottom line. This process allows you to transform a crowded, disorganized warehouse into a streamlined engine of productivity, ensuring that every inch of your facility is working toward your operational goals.
Phase 1: Data Collection and Baseline Assessment
The foundation of any successful optimization strategy lies in the accuracy of your initial data. Before any physical movements occur within the warehouse, you must establish a clear, data-driven baseline to understand your current operational landscape. This phase focuses on gathering the raw metrics required to identify where your capacity is being wasted and where bottlenecks are forming.
The process begins with two critical data retrieval steps: Retrieving Current Inventory Levels and Retrieving Warehouse Capacity Data. By auditing exactly what is currently in stock and comparing it against the total available storage capacity (including racks, floor space, and bin dimensions), you create a comprehensive snapshot of your warehouse's current state.
Once the raw data is gathered, the analytical work begins. We move into the calculation stage by Calculating Total Occupied Volume-determining the actual cubic space consumed by existing goods. From this, we can Calculate the Utilization Percentage, a key performance indicator (KPI) that reveals how much of your footprint is being used effectively.
The final objective of this phase is to Identify Excess or Deficit Space. By pinpointing specific zones that are over-congested or under-utilized, you move from mere observation to actionable insight, setting the stage for the strategic reorganization that follows.
Step 1: Retrieving Current Inventory Levels
The foundation of any successful optimization strategy lies in the accuracy of your baseline data. The process begins with the systematic retrieval of current inventory levels across all zones within the warehouse. This involves a comprehensive audit of your Warehouse Management System (WMS) to extract real-time data on every SKU currently in stock.
To ensure the integrity of the optimization workflow, it is critical to capture not just the quantity of items, but also their specific physical dimensions and storage locations. By pulling up-to-date stock counts, you eliminate the risk of making decisions based on ghost inventory or outdated records, ensuring that the subsequent calculations for volume and capacity are grounded in the true reality of your current warehouse state.
Step 2: Retrieving Warehouse Capacity Data
Once the current inventory levels have been documented, the next critical phase is to Retrieve Warehouse Capacity Data. This step serves as the baseline for your entire optimization strategy. To understand how much room you truly have to maneuver, you cannot simply look at empty floor space; you must look at the granular, structural capacity of your entire facility.
This process involves pulling detailed data from your Warehouse Management System (WMS) regarding every assignable storage unit within the facility. This includes:
- Bin and Rack Dimensions: The exact cubic volume and footprint of every pallet position, shelf, and bin.
- Storage Type Breakdown: Distinguishing between bulk storage areas, temperature-controlled zones, and picking faces.
- Dynamic vs. Fixed Capacity: Identifying areas that can be reconfigured versus fixed structural limitations.
By retrieving this data, you move beyond guesswork and transition into precise mathematical modeling. Without an accurate map of your total available volume, calculating utilization becomes impossible, and any subsequent reorganization plans will be built on a flawed foundation.
Phase 2: Calculating Utilization Metrics
Once the necessary data has been gathered, the focus shifts from data collection to quantitative analysis. This phase is the core of the optimization engine, where raw numbers are transformed into actionable insights. The process follows a structured mathematical progression to determine exactly how much of your facility is working for you and how much is sitting idle.
The calculation begins by determining the Total Occupied Volume, which is the sum of the physical space currently held by all active inventory. By comparing this figure against your Warehouse Capacity Data, you can then Calculate the Utilization Percentage. This percentage is the most critical KPI in this phase; it reveals the true density of your operations.
However, a high percentage isn't always a sign of efficiency-it could signal congestion. To gain a granular view, the next step is to Identify Excess or Deficit Space. This allows you to pinpoint exactly where you have dead zones that are wasting money or bottlenecks that are hindering movement. By quantifying these gaps, you move beyond guesswork and into a data-driven understanding of your warehouse's physical limitations.
Step 3: Calculating Total Occupied Volume
Once the current inventory levels and total warehouse capacity have been retrieved, the next critical step is to Calculate Total Occupied Volume. This stage moves the process from simple data collection to active computation.
In this step, you must aggregate the physical dimensions (length, width, and height) of all items currently stored in the warehouse to determine the actual cubic volume they occupy. It is not enough to simply count the number of units; you must account for the volumetric footprint of the stock. By multiplying the quantity of each SKU by its specific volume, you arrive at a precise measurement of the space being utilized. This calculation is essential because it provides the denominator needed to understand how much of your three-dimensional warehouse cube is actually being used, rather than just looking at floor square footage.
Step 4: Determining the Utilization Percentage
Once the total occupied volume has been calculated, the next critical step is to Calculate the Utilization Percentage. This metric serves as the primary KPI (Key Performance Indicator) for your warehouse efficiency, providing a clear mathematical representation of how effectively your available cubic capacity is being used.
To arrive at this figure, divide the total occupied volume by the total warehouse capacity and multiply by 100. This percentage offers an immediate snapshot of your operational health: a percentage too low indicates wasted overhead and dead space, while a percentage approaching 100% suggests a high risk of congestion, decreased picking speeds, and safety hazards. By quantifying this ratio, management can move away from intuitive guesswork and rely on precise, data-driven insights to drive the optimization process.
Phase 3: Gap Analysis and Space Identification
Once the baseline utilization metrics are established, the focus shifts from data collection to actionable intelligence. This phase is critical because it transforms raw numbers into a roadmap for operational efficiency. The primary objective here is to move beyond simply knowing how much space is used and instead determining where the operational friction exists.
The process begins by identifying excess or deficit space. By comparing your calculated occupied volume against your total capacity, you can pinpoint specific zones that are over-stuffed-creating safety hazards and retrieval delays-or zones that are underutilized, representing wasted overhead costs.
To ensure these insights are actionable, the workflow involves a deep dive into stock velocity. We identify slow-moving stock that may be dead weight, occupying premium picking locations despite low turnover. This discovery serves as the catalyst to initiate a reorganization plan, a strategic restructuring of the warehouse layout designed to redistribute density more effectively. Finally, to ensure the data remains accurate and the findings are documented for long-term planning, we generate an optimization report entry and a comprehensive utilization summary report. This stage ensures that the gap analysis isn't just a one-time observation, but a documented foundation for continuous warehouse improvement.
Step 5: Identifying Excess or Deficit Space
Once the utilization percentage has been calculated, the next critical phase of the workflow is to pinpoint exactly where the discrepancies lie. This step involves a deep dive into the mathematical results to identify specific areas of excess or deficit space.
Identifying a space deficit is an urgent signal that your current inventory volume is outgrowing your physical footprint, which can lead to aisle congestion, safety hazards, and increased labor costs due to disorganized picking paths. Conversely, identifying excess space-pockets of underutilized or dead zones-reveats opportunities to consolidate storage, reduce overhead, and potentially repurpose areas for new product lines or value-added services.
By isolating these specific gaps, the process moves from simple observation to actionable intelligence. This stage serves as the bridge between data collection and the decision-making process, allowing you to determine whether you need to scale your storage capacity or optimize your current layout to reclaim wasted area.
Step 6: Identifying Slow-Moving Stock for Review
Once the initial calculation of space utilization is complete and the gaps in your warehouse capacity are identified, the next critical phase is to look deeper into the composition of your inventory. Identifying slow-moving stock is a vital diagnostic step in the optimization process.
In this stage, we analyze historical turnover rates to pinpoint items that have been sitting in bins for extended periods without movement. These dead or stagnant SKUs are often the primary culprits behind artificial space congestion; they occupy valuable premium locations that should be reserved for high-velocity goods. By isolating these low-turnover items, you can distinguish between a genuine lack of physical space and a lack of efficient inventory rotation. This step ensures that your optimization efforts aren't just about moving boxes around, but about strategically clearing out the clutter to make room for growth.
Phase 4: Actionable Optimization Strategies
Once the data has been analyzed and the gaps in your warehouse efficiency are identified, the focus shifts from observation to execution. This phase is where raw metrics are transformed into operational improvements. To ensure a seamless transition from insight to action, the following systematic workflow should be implemented:
First, the process begins with the immediate deployment of corrective measures. Once a deficit or excess in space is identified, the primary goal is to Update Warehouse Status and Assign Space Audit Tasks to ensure the physical reality of the floor matches the digital records. This is closely followed by a deep dive into inventory health; by identifying Slow-Moving Stock, you can Initiate a Reorganization Plan that reallocates high-velocity items to more accessible zones.
To prevent clutter and optimize density, it is critical to Schedule Disposal/Liquidation for obsolete items and Update Bin Assignments to ensure every SKU has its optimal home. This ensures that the newfound space is used strategically rather than simply being left empty.
Finally, closing the loop is essential for long-term-governance. The workflow concludes by Generating an Optimization Report Entry and a comprehensive Utilization Summary Report. To ensure these changes are sustained, the process ends with a formal communication loop: Notify the Operations Manager of the new efficiency benchmarks and Alert the Floor Supervisor to oversee the physical execution of the new layout. This structured approach ensures that optimization is not a one-time event, but a continuous cycle of improvement.
Step 7: Initiating the Reorganization Plan
Once the identification of excess or deficit space has been finalized and the scope of the inefficiency is clear, the next critical phase is to Initiate the Reorganization Plan. This step transitions the process from analytical observation to actionable strategy.
An effective reorganization plan is not merely about moving boxes; it is about strategically reconfiguring your warehouse layout to maximize every cubic inch of available capacity. During this stage, the focus shifts to redesigning slotting strategies-repositioning high-velocity items closer to dispatch areas and relocating low-turnover goods to deeper, more remote storage zones. The goal is to create a fluid movement pattern that reduces travel time for pickers while simultaneously eliminating dead zones within the warehouse. By drafting a structured blueprint for this transition, you ensure that the subsequent physical movements are purposeful, organized, and designed to sustain long-term operational efficiency.
Step 8: Updating Bin Assignments and Warehouse Status
Once the identification of space deficits or excesses is complete, the workflow moves into the critical execution phase: Updating Bin Assignments and Warehouse Status. This step transforms theoretical data into actionable warehouse floor changes.
At this stage, the system or warehouse manager must update the digital bin assignments to reflect the new organizational logic. This involves re-mapping specific SKUs to more efficient locations-moving high-velocity items to golden zones (easily accessible areas) and relocating low-velocity items to deeper storage. Simultaneously, the Warehouse Status must be updated in the Warehouse Management System (WMS) to ensure that the Current Capacity reflects the newly optimized layout, preventing the accidental over-allocation of space.
Beyond simple data entry, this step also triggers the Alert to the Floor Supervisor. By notifying the supervisor immediately, you ensure that the physical movement of stock begins in alignment with the digital records. This synchronization is vital to prevent ghost inventory issues, where the system believes a bin is empty or available when it is actually still occupied by un-moved stock. Precise updates here ensure that the next cycle of optimization begins from a foundation of accurate, real-time data.
Step 9: Managing Surplus through Disposal or Liquidation
Once you have identified excess space and identified slow-moving stock through the auditing process, the next critical step is to clear the clutter. Identifying a bottleneck is only half the battle; the true optimization happens when you actively manage the surplus. Schedule Disposal or Liquidation is the decisive action required to transform dead stock into usable warehouse capacity.
This stage involves evaluating items that have been flagged as stagnant or obsolete and deciding on the most cost-effective exit strategy. Whether it is through bulk liquidations, clearance sales, or permanent disposal, the goal is to remove non-performing inventory to prevent inventory bloat. By systematically clearing out these items, you effectively reclaim valuable bin locations and floor space, ensuring that your warehouse footprint is dedicated to high-velocity products that drive revenue.
Phase 5: Monitoring, Reporting, and Communication
Once the structural adjustments are implemented, the final phase of the workflow focuses on closing the loop through rigorous documentation and proactive communication. This stage ensures that the optimizations made are not just temporary fixes, but permanent improvements integrated into the warehouse's operational intelligence.
The process begins with the generation of an optimization report entry and a comprehensive utilization summary report. These documents serve as the single source of truth, providing a granular look at how the recent changes have impacted space efficiency. To ensure accountability, the workflow triggers an automated notification to the Operations Manager, keeping leadership informed of real-time efficiency gains and potential bottlenecks.
However, data visibility is only effective if followed by operational action. The workflow continues by updating bin assignments within the Warehouse Management System (WMS) to reflect the new spatial layout, ensuring the digital twin matches the physical reality. For areas where the optimization identified obsolete inventory, the system automatically schedules disposal or liquidation tasks to prevent future clutter. Finally, an alert is sent to the Floor Supervisor, ensuring the team on the ground is aware of the updated protocols and can oversee the smooth execution of the new spatial strategy. This end-to-end communication loop ensures that optimization becomes a continuous cycle of improvement rather than a one-time event.
Step 10: Generating Optimization Reports and Summaries
Once the data analysis phase is complete, the workflow transitions from calculation to documentation. This critical stage involves two distinct but interconnected outputs: the Generation of Optimization Report Entries and the Generation of the Utilization Summary Report.
The first part of this step focuses on granular data logging. The Optimization Report Entry acts as a detailed technical log of the specific findings for the current period. This entry captures the raw metrics, such as the exact percentage of occupied vs. available volume and the specific zones identified as having a deficit or excess of space. This serves as a point-in-time record that allows for granular auditing and longitudinal tracking of how specific aisles or zones are performing.
Simultaneously, the Utilization Summary Report is produced to provide a high-level, executive overview of the warehouse's health. While the individual entries focus on the where and how much, the summary report focuses on the what now. This document aggregates all recent findings into a digestible format, highlighting trends in space consumption and providing a macro-view of warehouse efficiency. Together, these two reports transform raw numbers into actionable intelligence, providing the necessary paper trail to justify upcoming logistical changes and resource reallocations.
Step 11: Communicating Updates to Management and Floor Supervisors
Once the optimization plan is finalized and the data-driven adjustments are ready for implementation, the final and most critical step is ensuring seamless communication across all levels of the organization. Optimization is not a solitary task; it requires synchronized action between high-level decision-makers and the personnel managing the physical floor.
This phase involves three distinct communication loops:
- Notifying the Operations Manager: The process concludes with a formal notification to the Operations Manager. This ensures that management is aware of the new utilization metrics, the identified shifts in capacity, and the strategic reasoning behind the reorganization. This keeps leadership informed about how these changes align with broader supply chain goals and-budgetary constraints.
- Alerting the Floor Supervisor: While management focuses on the macro view, the Floor Supervisor must be alerted to the micro-level changes. They are responsible for overseeing the immediate execution of the reorganization, ensuring that the new bin assignments are followed, and managing the physical movement of stock.
- Data Transparency via Reporting: Alongside these direct alerts, the updated utilization summaries and optimization reports serve as a single source of truth. By circulating these reports, you ensure that everyone-from the warehouse office to the loading docks-is operating with the same real-time understanding of available capacity and inventory health.
Effective communication prevents the information silo trap, ensuring that your optimization strategy translates from a digital calculation into a physical reality on the warehouse floor.
Resources & Links
- Gartner Supply Chain Research: Industry-leading research and insights on supply chain management, logistics trends, and warehouse technology implementation.
- MHI (Material Handling Institute): The leading association for the material handling, logistics, and supply chain industry, offering technical resources on warehouse automation.
- Supply Chain Management Review: Expert analysis and case studies regarding operational excellence and strategic warehouse management workflows.
- Warehousing Education and Research Council: Resources focused on warehousing best practices, standardization, and operational efficiency metrics.
- Inbound Logistics: Comprehensive news and educational articles regarding inventory management, space optimization, and logistics strategy.
- IBM Supply Chain Intelligence: Tools and methodologies for utilizing data analytics and AI to monitor inventory levels and warehouse capacity.
Found this Article helpful?
Logistics Management Solution Demo
Tired of shipping delays, lost packages, and inefficient routes? ChecklistGuro's Work OS platform streamlines your entire logistics operation, from warehouse management and order fulfillment to route optimization and delivery tracking. Gain real-time visibility, reduce costs, and improve customer satisfaction. Learn how ChecklistGuro can transform your logistics business!
Related Articles
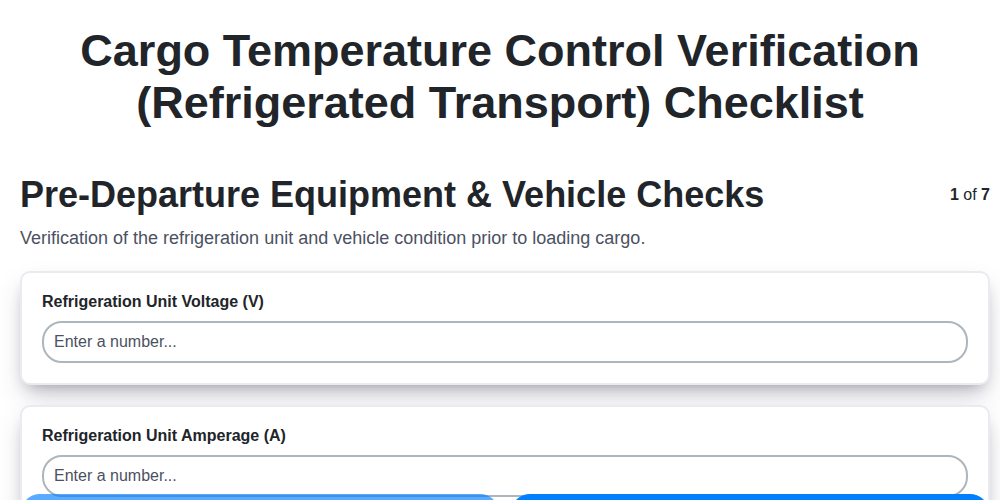
The Ultimate Refrigerated Cargo Temperature Control Checklist Template
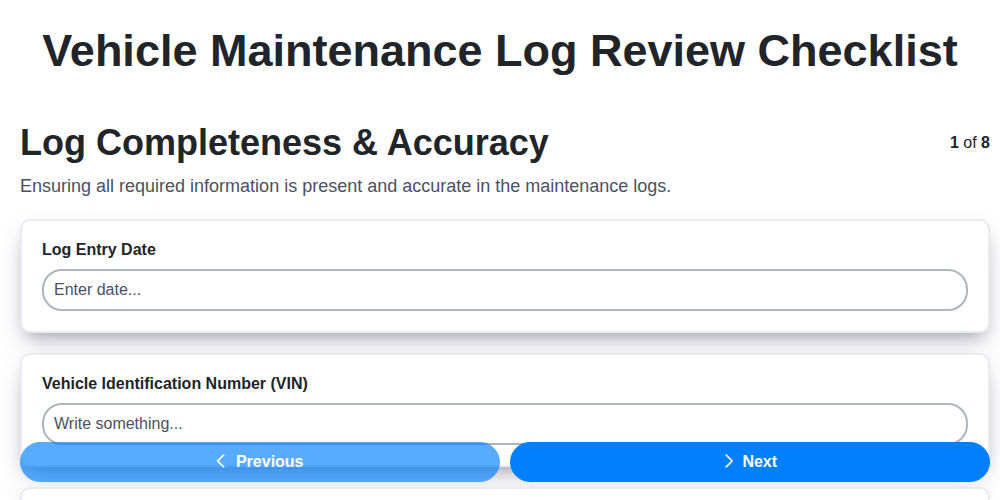
Mastering Your Fleet: A Vehicle Maintenance Log Review Template
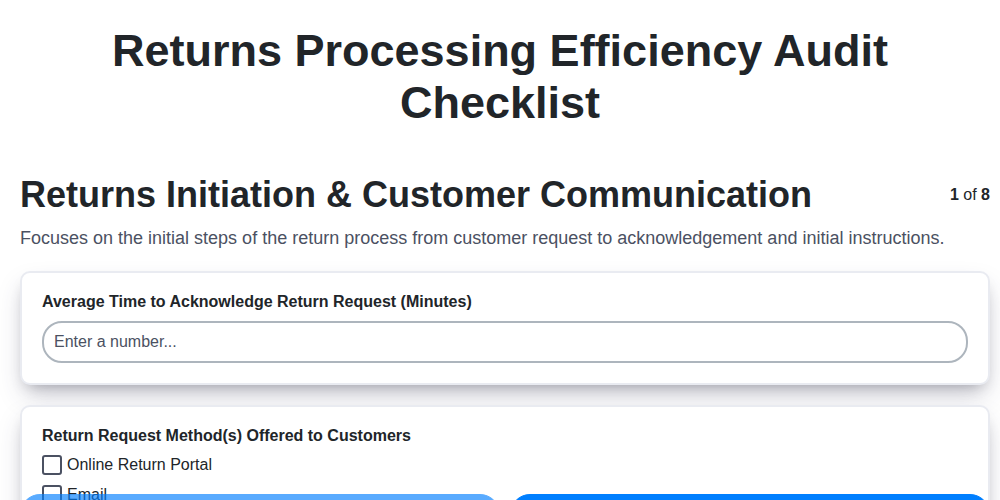
Master Your Returns: The Ultimate Returns Processing Efficiency Audit Checklist
Data Privacy Policy Compliance: Your Essential Checklist Template
Delivery Confirmation Audit: Your Checklist Template for Process Excellence
Your Pallet Inspection & Maintenance Checklist Template
Fuel Efficiency Monitoring: Your Checklist Template for Savings
Supply Chain Risk Assessment: Your Essential Checklist Template
We can do it Together
Need help with
Checklists?
Have a question? We're here to help. Please submit your inquiry, and we'll respond promptly.