Mapping Your Weeds: A Checklist Template for Accurate Infestation Detection
Published: 09/01/2025 Updated: 12/13/2025
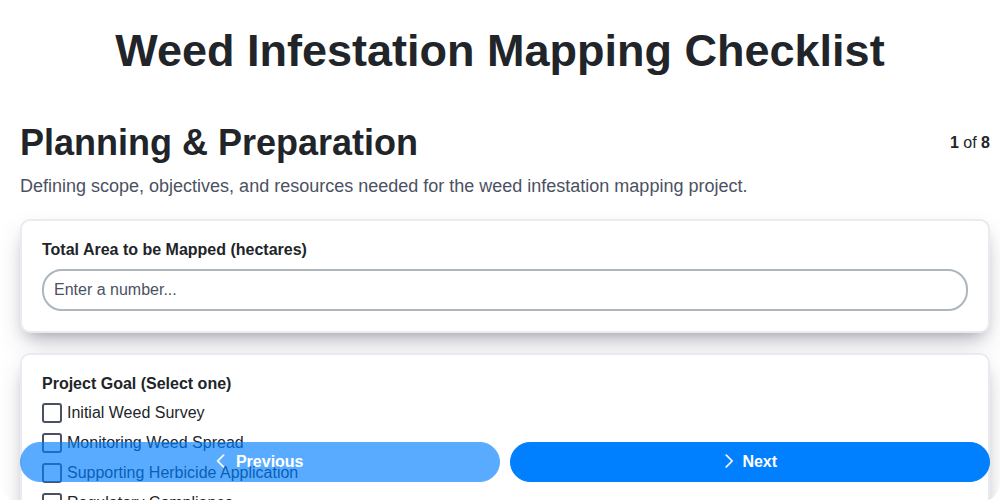
Table of Contents
- Why Map Your Weeds? Understanding the Benefits
- Planning & Preparation: Laying the Groundwork
- Selecting the Right View: Understanding Remote Sensing Options
- Data Acquisition - Ground Truthing: Validation on the Field
- Image Processing & Analysis: Extracting the Weed Signal
- Integrating Your Classified Image into a GIS Environment
- Mapping & Visualization: From Data to Insight
- Reporting & Documentation: Sharing Your Findings
- Resources & Links
TLDR: Struggling to manage weeds effectively? This checklist template provides a step-by-step guide to accurately map weed infestations using remote sensing and ground truthing. From planning and data acquisition to GIS integration and reporting, this tool streamlines the process, enabling targeted treatment and improved weed management decisions.
Why Map Your Weeds? Understanding the Benefits
For years, weed management has largely been a reactive process - scouting fields, identifying problem areas, and applying treatments as needed. While this approach isn't inherently wrong, it's often inefficient, costly, and can lead to unintended environmental consequences. Proactive weed mapping offers a transformative shift, providing a wealth of benefits that go far beyond simply knowing where weeds are.
Think of it as gaining a strategic advantage. Weed mapping empowers you to transition from constantly playing catch-up to anticipating and mitigating weed threats before they significantly impact your yields or ecosystem health.
Here's a breakdown of the key advantages:
- Early Detection & Rapid Response: Identifying infestations in their nascent stages - often before they become visually obvious - allows for targeted interventions when control is most effective and less costly. This drastically reduces the potential for widespread infestation.
- Optimized Resource Allocation: Forget blanket herbicide applications. Weed maps pinpoint areas of concern, allowing for precise treatment only where needed. This minimizes herbicide usage, reduces input costs, and minimizes environmental impact.
- Enhanced Monitoring & Trend Analysis: Regularly updated weed maps provide a historical record of infestation patterns. Track changes over time, assess the efficacy of your control strategies, and adapt your approach accordingly. This data-driven feedback loop ensures continuous improvement.
- Improved Decision-Making Across the Farm: Weed mapping isn't just about herbicides. It informs a wider range of decisions, from crop rotation planning and tillage practices to irrigation management.
- Environmental Stewardship: Reducing herbicide use and promoting healthier ecosystems aligns with sustainable agricultural practices and contributes to a more resilient farm.
Ultimately, weed mapping isn't just about creating a map - it's about cultivating a smarter, more efficient, and more sustainable approach to weed management.
Planning & Preparation: Laying the Groundwork
Before you even think about launching drones or downloading satellite imagery, a solid planning phase is absolutely crucial. Rushing into data acquisition without a clear strategy is a recipe for wasted time, resources, and potentially inaccurate results. This initial planning defines the scope, objectives, and overall success of your weed infestation mapping project.
First, clearly define your objectives. What specific questions do you hope to answer with this map? Are you trying to identify the prevalence of a particular weed species across a field? Assessing the impact of an infestation on crop yield? Understanding how weed distribution changes over time? Defining your objectives will guide every subsequent decision.
Next, identify the target weed species. Different weeds have unique spectral signatures, which will inform your choice of remote sensing data and image processing techniques. Knowing which weeds you're targeting allows for more focused data selection and classification strategies.
Carefully determine the mapping area and scale of your project. A large-scale project covering hundreds of acres will require different resources and techniques compared to a smaller, more localized study. Consider the level of detail needed - do you require individual plant identification, or is a general distribution map sufficient?
A realistic budget and resource allocation is vital. Data acquisition can be costly, and specialized software and skilled personnel may be required. Factor in time for fieldwork, data processing, and analysis. Don't underestimate the time investment!
Finally, don't overlook legal and ethical considerations. Ensure you have the necessary permissions to access the land being mapped and be mindful of any privacy concerns related to data collection. This proactive approach minimizes potential issues down the road. A little planning upfront can save a lot of headaches later!
Selecting the Right View: Understanding Remote Sensing Options
Choosing the right remote sensing data is crucial for accurate weed infestation mapping. It's not a one-size-fits-all solution; the best option depends on factors like the target weed species, the size of the area you're mapping, your budget, and the level of detail required. Let's break down the most common options:
1. Multispectral Satellite Imagery: This is a popular choice for large-scale mapping. Satellites like Sentinel-2 and Landsat 8 offer broad coverage and relatively low cost. They capture data in several spectral bands (typically 4-10), allowing for the calculation of vegetation indices like NDVI, which can differentiate between healthy vegetation and stressed or invasive weeds. While the spatial resolution (detail) isn't as high as drone imagery, it's suitable for identifying broad patterns of infestation.
2. Hyperspectral Imagery: Stepping up in sophistication, hyperspectral imagery captures data in dozens or even hundreds of narrow spectral bands. This incredibly detailed spectral signature allows for very precise identification of weed species, even when they appear visually similar. However, it's typically acquired through airborne or drone-based platforms, making it more expensive and often limited to smaller areas.
3. Drone (UAV) Imagery: Drones offer a fantastic combination of high spatial resolution, flexibility, and cost-effectiveness, particularly for smaller areas. They can be equipped with various sensors, including multispectral and hyperspectral cameras, allowing for customized data acquisition. The ability to fly at lower altitudes also results in greater detail and can be ideal for targeted surveys or precision mapping of specific fields. Keep in mind that drone operations are subject to regulations and may require licensing.
Considerations for Selection:
- Spectral Resolution: Does the sensor capture the wavelengths needed to differentiate your target weed?
- Spatial Resolution: How much detail do you need to see?
- Temporal Resolution: How often do you need updated imagery?
- Cost: What's your budget for data acquisition?
- Regulatory Requirements: Are there any restrictions on data acquisition or drone operation in your area?
Data Acquisition - Ground Truthing: Validation on the Field
Ground truthing, or field validation, is the cornerstone of any successful weed infestation mapping project. It bridges the gap between what you think your remote sensing data is showing and the reality on the ground. Without accurate ground truth data, your final map will be unreliable and potentially misleading.
Planning Your Fieldwork:
Before stepping into the field, careful planning is essential. Your ground truth locations should be strategically selected to represent the diversity of your study area and to cover areas you suspect have varying levels of infestation. Consider:
- Accessibility: Choose locations reachable by foot, ATV, or other appropriate vehicles.
- Variation: Include areas with suspected high, medium, and low weed density.
- Randomness: Incorporate randomly selected points to ensure a representative sample.
- Edge Effects: Sample areas near field edges or transitions between habitats, where infestations often begin.
What to Record in the Field:
During your field visits, meticulous data collection is key. At each ground truth location, record the following:
- GPS Coordinates: Use a high-accuracy GPS device to precisely mark the location. Double-check coordinates!
- Species Identification: Confirm the presence of your target weed species. Take clear photographs as visual confirmation. If unsure, consult with a local expert.
- Density/Cover: Estimate the percentage of ground cover occupied by the weeds. This can be done visually or using a quadrant method.
- Overall Health of Vegetation: Note the general health and condition of the surrounding vegetation, as this can provide context for the infestation.
- Environmental Factors: Record observations about soil type, moisture levels, slope, aspect, and other environmental conditions that might influence weed distribution. A simple notepad and pen are often sufficient.
- Photographic Evidence: Take multiple photographs from different angles to provide a visual record of each location. Include a scale (e.g., a ruler or coin) for reference.
Properly collected ground truth data is your benchmark for evaluating the accuracy of your remote sensing analysis. Don't underestimate the time and effort required for this crucial step - it will directly impact the quality and usefulness of your final weed infestation map.
Image Processing & Analysis: Extracting the Weed Signal
This stage is where the magic happens - transforming raw imagery into actionable information. The process isn's always straightforward, and requires careful consideration of your chosen imagery and the unique spectral characteristics of your target weed species.
Radiometric Correction: Establishing a Common Baseline
Before any meaningful analysis can occur, the imagery needs to be radiometrically corrected. This step accounts for atmospheric effects and sensor inconsistencies, converting the digital numbers (DN) in the image to reflectance values. Reflectance values represent the proportion of light reflected by the surface and allow for a standardized comparison across different images and sensors. Software packages like ENVI, ERDAS Imagine, or even open-source solutions like Orfeo Toolbox provide tools for this essential correction.
Vegetation Indices: Spotting the Differences
Vegetation indices are mathematical combinations of spectral bands designed to highlight vegetation health and characteristics. For weed infestation mapping, several indices are particularly useful:
- Normalized Difference Vegetation Index (NDVI): A classic index, NDVI indicates overall vegetation greenness. While useful, it might not differentiate between desirable crops and problem weeds.
- Enhanced Vegetation Index (EVI): EVI is less susceptible to atmospheric effects and soil background influences than NDVI, making it a better choice in areas with dense vegetation or varying soil conditions.
- Soil Adjusted Vegetation Index (SAVI): SAVI attempts to minimize the influence of soil brightness, particularly valuable in areas with exposed soil.
- Specific Weed Indices: Research might reveal indices specifically tuned for your target weed species. For example, certain ratios of near-infrared and red wavelengths might be particularly effective in differentiating Kochia or Palmer Amaranth.
Experimentation with different vegetation indices is critical; what works best will depend on your specific scenario.
Classification Techniques: Separating Weed from Crop
Once reflectance values and vegetation indices have been calculated, the next step is to classify the image, differentiating between weed-infested areas, crop areas, and other land cover types. Common classification techniques include:
- Supervised Classification: Requires training areas - regions that are known to be either weed-infested or crop-covered - to train the classification algorithm. Maximum Likelihood, Support Vector Machines (SVM), and Random Forest are popular supervised algorithms.
- Unsupervised Classification: The algorithm automatically groups pixels into clusters based on their spectral characteristics. Requires user interpretation to assign meaning to each cluster (e.g., weed vs. crop).
- Object-Based Image Analysis (OBIA): Groups pixels into meaningful objects based on spectral, spatial, and contextual information. This is particularly useful for identifying weeds within complex landscapes.
Careful selection of classification parameters and algorithms is key to achieving accurate results. Post-classification editing and refinement are often necessary to remove errors and improve the overall map quality.
Integrating Your Classified Image into a GIS Environment
The magic truly happens when you bring your processed imagery into a Geographic Information System (GIS). This isn't just about pretty maps; it's about enabling analysis, spatial queries, and informed decision-making. Most commonly, you'll use industry-standard software like ArcGIS or QGIS, but the principles remain the same regardless of the platform.
Here's how to get started:
Importing the Classified Raster: Your classified image (likely in a format like GeoTIFF or Esri Grid) needs to be imported into your GIS project. Ensure the coordinate system is correctly defined to align with your other spatial data (e.g., field boundaries, soil maps). Incorrect coordinate systems will lead to inaccurate spatial relationships.
Joining Attribute Data: Assign meaningful attribute data to each class within your classified image. For example, you might create a field called WeedType and populate it with the specific weed species identified during classification. This allows for filtering, querying, and further analysis.
Spatial Analysis and Overlay: This is where the power of GIS shines. Perform spatial joins to combine your weed map with other relevant datasets. For instance:
- Proximity Analysis: Identify fields that are within a certain distance from a known weed infestation.
- Overlay Analysis: Combine the weed map with soil maps to assess the relationship between weed prevalence and soil type.
- Change Detection (Time Series Data): If you have historical imagery, you can analyze changes in weed distribution over time.
Accuracy Assessment Refinement: Bring in your ground truth data and perform an accuracy assessment. This involves comparing the classified map to your field observations and calculating metrics like overall accuracy, producer's accuracy, and user's accuracy. Low accuracy may indicate the need to revisit the classification parameters.
Creating Thematic Maps and Reports: Transform your classified data into visually compelling maps that communicate your findings effectively. Use color ramps, legends, and labels to highlight important features and patterns. Combine these maps with tables and charts to create a comprehensive report for stakeholders. Remember to clearly document your methodology and results.
Mapping & Visualization: From Data to Insight
The technical work - the remote sensing, processing, and classification - culminates in the most satisfying stage: creating a map that tells a story. A well-crafted visualization isn't just pretty; it's a powerful communication tool that allows you to quickly understand the extent and severity of weed infestations, and communicate those findings to stakeholders.
Here's how to translate your classified data into actionable insights:
Choosing the Right Map Type:
- Distribution Maps: These highlight the spatial patterns of weed presence. Use color gradients to represent weed density or prevalence - darker shades indicating higher infestation levels. Consider a graduated symbol map if using point data from ground truthing.
- Thematic Maps: Focus on specific characteristics, such as the most prevalent weed species within a region or changes in infestation over time. Choropleth maps (using color shading based on statistical areas) are useful for this.
- Change Detection Maps: If you have imagery from multiple dates, create a map illustrating changes in weed distribution or density over time. This is invaluable for assessing the impact of control measures.
- Interactive Web Maps: Go beyond static images! Interactive maps allow users to zoom, pan, query data, and explore different layers, fostering a deeper understanding. Tools like ArcGIS Online or QGIS's web publishing capabilities can be leveraged.
Beyond the Map: Supporting Visualizations
Maps are rarely sufficient on their own. Supplement them with:
- Charts and Graphs: Summarize key statistics like total area infested, dominant weed species, or accuracy assessment results. Bar charts, pie charts, and time series graphs are all powerful tools.
- Infographics: Combine maps, charts, and concise text to create a visually engaging overview of your findings.
- Legends & Metadata: Ensure your maps are clearly labeled and include sufficient metadata to allow others to understand your methodology and data sources.
Principles of Effective Visualization:
- Clarity: Prioritize clarity and avoid unnecessary complexity.
- Accuracy: Ensure your visualizations accurately represent the data.
- Accessibility: Consider colorblindness and other accessibility concerns when choosing color palettes.
- Storytelling: Frame your visualizations to communicate a clear narrative and highlight key insights.
Reporting & Documentation: Sharing Your Findings
Your meticulously mapped weed infestations represent a wealth of valuable information. But that data only truly becomes impactful when effectively communicated. This section focuses on creating a comprehensive report and presentation that clearly conveys your findings and drives informed action.
Elements of a Solid Report:
- Executive Summary: Begin with a concise overview of the project's objectives, key findings, and recommendations. This is often the first (and sometimes only) section read by busy stakeholders.
- Methodology: Detail the entire workflow - from data acquisition and processing to classification and accuracy assessment. Transparency builds credibility and allows for reproducibility.
- Results & Analysis: Present your weed infestation maps and derived statistics in a visually engaging manner. Use tables, charts, and graphs to highlight key trends and patterns. Clearly explain the meaning of the data.
- Accuracy Assessment: Thoroughly document your accuracy assessment process, including metrics (overall accuracy, producer's accuracy, user's accuracy) and any limitations.
- Discussion: Interpret your results in the context of the broader landscape. Consider factors that may influence weed distribution and abundance.
- Recommendations: Offer specific, actionable recommendations for weed management strategies. Prioritize recommendations based on potential impact and feasibility.
- Appendix: Include supporting materials such as raw data, detailed calculations, and image processing parameters.
Beyond the Report: Effective Presentations
A compelling presentation can bring your findings to life. Remember to:
- Know Your Audience: Tailor the content and language to their level of technical expertise.
- Visuals are Key: Use high-quality maps, charts, and photos to illustrate your points.
- Tell a Story: Structure your presentation with a clear narrative arc - from problem to solution.
- Keep it Concise: Respect your audience's time and focus on the most important information.
- Encourage Questions: Create a space for dialogue and address any concerns.
Data Archiving:
Don't let your hard work disappear! Implement a robust data archiving strategy to ensure long-term accessibility of your data, maps, and reports. This allows for future comparisons, trend analysis, and validation of your findings.
Resources & Links
- Michigan Invasive Species Risk Assessment : A comprehensive resource for understanding invasive species, including their spread patterns and potential impacts. Useful for understanding the 'why' behind weed mapping and the consequences of unchecked infestations, relevant to 'Why Map Your Weeds?'
- Utah State University - GIS : Provides tutorials, data, and general information about Geographic Information Systems (GIS). Essential for understanding the GIS environment section ('Integrating Your Classified Image into a GIS Environment' and 'Mapping & Visualization').
- Esri - GIS Software and Services : The leading provider of GIS software (ArcGIS) and services. Provides insights into software needed for image processing and mapping workflows. Important for 'Integrating Your Classified Image into a GIS Environment' and 'Mapping & Visualization'.
- QGIS - Free and Open Source GIS : A free and open-source alternative to ArcGIS. Useful for those needing a cost-effective GIS solution ('Integrating Your Classified Image into a GIS Environment' and 'Mapping & Visualization').
- USGS - Remote Sensing Basics : Provides introductory information on remote sensing principles, different types of imagery (e.g., multispectral, hyperspectral), and how they're acquired. Relevant to 'Selecting the Right View: Understanding Remote Sensing Options'.
- NASA Earthdata : Provides access to a vast archive of satellite imagery, including Landsat and Sentinel data. A valuable source for acquiring remote sensing data ('Data Acquisition - Ground Truthing' and 'Selecting the Right View').
- ESA Sentinel Programme : Provides information on the Sentinel satellite constellation, offering open access to high-resolution imagery. Useful for sourcing imagery for weed mapping ('Data Acquisition - Ground Truthing' and 'Selecting the Right View').
- Remote Sensing Journal : A peer-reviewed journal publishing research on remote sensing techniques and applications. Provides deeper dives into image processing and analysis methods ('Image Processing & Analysis').
- Royal Geographical Society : While broad, their resources on spatial analysis and cartography are useful for understanding best practices in mapping and visualization ('Mapping & Visualization').
- Texas A&M AgriLife Extension : Offers practical guidance and resources related to agriculture and weed management, relevant to understanding the context of weed infestations and reporting findings ('Reporting & Documentation').
- Intergovernmental Panel on Climate Change (IPCC) : Useful for understanding how climate change can impact weed distribution and abundance; contextually relevant to discussions about infestation spread ('Why Map Your Weeds?').
- GIS Resources : A directory of GIS software, data providers, and other related resources to facilitate data acquisition and image processing.
Frequently Asked Questions
What is the purpose of this 'Mapping Your Weeds' checklist?
This checklist is designed to help you systematically survey an area to identify and document weed infestations. It provides a structured approach to ensure you don't miss any weeds and accurately record their location and severity.
Who is this checklist for?
This checklist is useful for landowners, farmers, ranchers, conservationists, and anyone responsible for managing land and dealing with weed problems. It's suitable for both small and large areas.
What kind of information should I record using the checklist?
The checklist prompts you to record the weed species identified, its approximate location (using GPS coordinates or descriptions), the estimated percentage of area covered, the overall density, any notable observations (like seed bank presence or spread patterns), and any control measures already in place.
Do I need any special equipment to use this checklist?
Ideally, you're best served with a GPS device to record precise locations. However, a compass, maps, measuring tape, and a camera are also very helpful. A notebook and pen are essential for recording your observations. The checklist itself can be a printed copy or a digital document on a tablet or smartphone.
What is the significance of recording GPS coordinates?
GPS coordinates allow for precise mapping and tracking of weed infestations over time. This helps in assessing the effectiveness of control measures and identifying areas that require more intensive management.
Can I adapt the checklist to suit my specific needs?
Absolutely! The checklist is a template. Feel free to add or remove rows, add columns for additional information specific to your area or weeds, or modify the severity scale to better reflect your observations.
What do I do with the data I collect using the checklist?
The data collected can be used to create maps of weed infestations, prioritize control efforts, track changes in weed populations over time, and document the effectiveness of management strategies. You may also need it for reporting to local agencies or for grant applications.
How often should I conduct weed mapping surveys?
The frequency of surveys depends on the severity of the weed problem, the rate of spread, and the control strategies employed. Annual surveys are generally recommended, but more frequent monitoring may be necessary for rapidly spreading weeds or in high-priority areas.
Found this Article helpful?
Agriculture Management Solution Demo
Running a farm or agricultural business is complex. ChecklistGuro's Work OS platform simplifies your operations, from crop planning and irrigation management to livestock tracking and harvest scheduling. Increase efficiency, reduce waste, and boost yields! See how ChecklistGuro can revolutionize your agriculture business.
Related Articles
10 Simple Steps to a Healthy Drainage System: Your Checklist Template

Mastering the Daily Crop Scouting Report: Your [Specific Crop] Checklist Template
Irrigation System Checklist: Farm Water Management & Crop Yield Optimization
Unlock Your Garden's Potential: A Soil pH Verification Checklist
PPE Usage Checklist Template: Your Guide to Safety
Water Discharge Permit Compliance Checklist Template
The Ultimate GPS & Precision Farming Calibration Checklist Template
Water Runoff Analysis Checklist Template
We can do it Together
Need help with
Agriculture?
Have a question? We're here to help. Please submit your inquiry, and we'll respond promptly.