Mapping Local Food: A Checklist for Crop Stand Counts & Population Density
Published: 09/02/2025 Updated: 12/13/2025
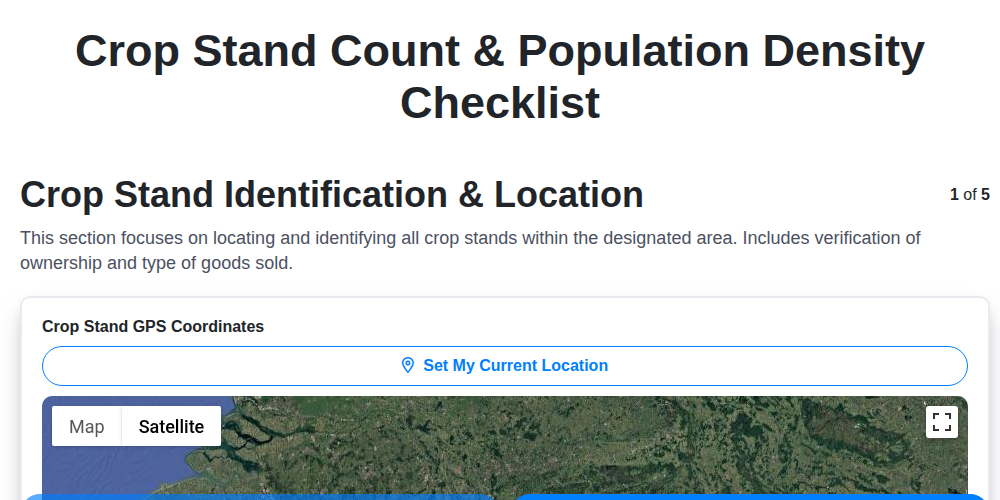
Table of Contents
- Why Map Local Food? Understanding the Connection
- The Checklist Approach: Ensuring Accurate Data
- Step 1: Identifying and Locating Crop Stands
- Step 2: Counting and Classifying Crop Stands
- Step 3: Assessing Population Density & Demographics
- Step 4: Recording Spatial Data - The Foundation of Analysis
- Step 5: Data Validation: Ensuring Accuracy and Reliability
- Mapping the Findings: Visualizing Crop Stands and Population
- Analyzing the Data: Uncovering Patterns and Insights
- Tools and Technologies: Your Guide to Mapping Local Food
- Future Directions: Expanding Our Understanding
- Resources & Links
TLDR: Want to understand how local farms and communities connect? This checklist guides you through counting crop stands and analyzing population density - step-by-step. It's perfect for assessing food access, tracking local food systems, and using GIS to map the story of your community's agriculture!
Why Map Local Food? Understanding the Connection
Mapping local food systems isn't just about putting dots on a map; it's about revealing a complex web of relationships that sustain our communities. Think of it as uncovering the story of where your food comes from - not just the farm, but the routes it takes, the people involved, and the impact it has on the surrounding landscape and economy.
Historically, local food systems were the norm - people primarily consumed what was grown nearby. As globalization increased, these connections weakened, leading to a disconnect between consumers and the origins of their food. Mapping helps to bridge this gap, providing a visual representation of the connections between farms, farmers' markets, food processors, distributors, restaurants, and consumers.
This visual representation allows us to:
- Identify Food Hubs: Pinpoint areas with a high concentration of local food businesses.
- Trace Supply Chains: Understand the flow of food from farm to table.
- Assess Accessibility: Evaluate whether local food is readily available to all residents, particularly in underserved communities.
- Promote Transparency: Increase consumer awareness of where their food comes from and how it's produced.
- Support Local Economies: Highlight the economic benefits of supporting local food businesses.
Ultimately, mapping local food is a powerful tool for fostering a more sustainable, resilient, and equitable food system. It'll connect people to their food, empower local communities, and strengthen the fabric of our society.
The Checklist Approach: Ensuring Accurate Data
A systematic checklist is the backbone of our data collection process, guaranteeing consistency and minimizing errors. Simply observing and recording isn't enough; a structured approach ensures we capture the vital details needed for meaningful analysis. Our checklist isn't static; it's continually refined based on lessons learned in the field.
Here's a glimpse into how it works:
- Standardized Forms: Every data point - crop stand features, location details, population density figures - is recorded using pre-defined forms. This eliminates ambiguity and ensures all necessary information is captured.
- Double-Checking Procedures: Each data entry is reviewed by a second team member. This sanity check catches mistakes that might otherwise slip through.
- GPS Verification: Location coordinates are meticulously verified against multiple sources, including aerial imagery and ground truthing exercises. Even a slight positional error can skew analysis results.
- Image Documentation: Photographs are taken at each crop stand, providing a visual record of its appearance and operational status. These images are also useful for cross-referencing historical data.
- Regular Checklist Review: The checklist itself is regularly reviewed and updated based on feedback from the field and evolving data collection needs. This ensures it remains relevant and effective.
By adhering to this rigorous checklist approach, we strive for the highest level of data accuracy and reliability.
Step 1: Identifying and Locating Crop Stands
Pinpointing crop stands isn't as simple as searching a database. They often operate seasonally, are informal, or lack formal registration. Our initial reconnaissance combines several approaches to ensure we capture as many as possible.
First, we leverage aerial imagery - tools like Google Earth and satellite data are invaluable for spotting roadside displays and temporary structures. While quick, this method requires careful interpretation as seasonal stands might not be visible in older imagery.
Next, we tap into local knowledge. Interviews with residents, farmers, and community organizations often reveal hidden gems we wouldn't otherwise find. These conversations also provide context about the history and significance of these stands within the community.
Roadside observation is a crucial element. Regularly driving through targeted areas allows us to identify new or relocated stands, especially those that may not be consistently visible in imagery.
Finally, we supplement our observations by searching online listings and advertisements. Local farmer's market websites, community forums, and social media groups can often provide clues about crop stand locations and operating schedules. Combining these diverse methods ensures a comprehensive inventory of crop stands in the area.
Step 2: Counting and Classifying Crop Stands
Simply identifying a crop stand is only the first step. To create a meaningful dataset, we need a systematic approach to counting and classifying them. Our process goes beyond a simple tally; it involves categorizing stands based on key characteristics that influence their impact.
First, we establish a clear definition of what constitutes a crop stand. This might include temporary structures, permanent buildings, roadside tables, or even individuals selling produce from their vehicles. Consistency here is vital. We then use a combination of aerial imagery, on-site observation, and local knowledge to identify potential stands.
During the counting phase, we record the following information:
- Permanent vs. Seasonal: We categorize stands as either permanent (operating year-round or for extended periods) or seasonal (operating for a limited time, typically during harvest season). This distinction informs understanding of economic stability and community reliance.
- Product Variety: We note the range of products offered. Is it primarily fruits and vegetables, or are other goods (e.g., honey, flowers, crafts) also sold? A wider variety often indicates a more diversified income stream for the vendor.
- Size & Scale: A simple estimation of the stand's size (e.g., small, medium, large) can suggest the volume of produce handled and potential impact on local suppliers.
- Operational Status: This is a crucial check. We verify that the stand is currently open and operating. Many stands are only active during specific times of the year or days of the week.
- Payment Methods: Noting whether the stand accepts cash, card, or mobile payments can provide insight into accessibility for different demographics.
- Presence of Signage: Is there clear signage indicating pricing and product information? This can reflect professionalism and engagement with customers.
Each of these characteristics contributes to a more nuanced understanding of the crop stand's role within the community and its overall significance in the local food system. A standardized classification system helps ensure data consistency and facilitates comparative analysis across different areas.
Step 3: Assessing Population Density & Demographics
Understanding the relationship between crop stand accessibility and the people who need it most requires a deep dive into population density and demographics. We don't just want to know how many people live near a crop stand; we need to understand who they are.
Our assessment goes beyond simple population counts. We utilize data from the U.S. Census Bureau (and equivalent sources in other regions) to analyze key demographic factors within a defined radius (typically 1-3 miles, but adaptable based on the area) of each crop stand location. These factors include:
- Median Household Income: Identifying areas with lower income levels, which often correlate with limited access to fresh produce.
- Percentage of Households Receiving SNAP Benefits: A strong indicator of food insecurity within a community.
- Percentage of Population Below the Poverty Line: Provides a broader measure of economic hardship.
- Age Distribution: Areas with a high percentage of elderly residents or young children may have different nutritional needs and access challenges.
- Racial and Ethnic Composition: Recognizing potential disparities in access to healthy food options based on community demographics.
- Vehicle Ownership Rates: Understanding transportation limitations that may hinder access, especially in rural areas.
We leverage Geographic Information System (GIS) software - primarily ArcGIS and QGIS - to spatially join crop stand data with census tract data, allowing us to visualize these demographic factors in conjunction with crop stand locations. This spatial analysis reveals patterns and correlations that wouldn't be apparent through simple data aggregation. For example, we might find a cluster of crop stands in a relatively affluent area, while a nearby lower-income neighborhood has significantly fewer options. This information is crucial for prioritizing interventions and promoting equitable access to fresh, healthy food.
Step 4: Recording Spatial Data - The Foundation of Analysis
Spatial data is the backbone of this entire process. Without accurate and well-organized location information, the correlations we seek between crop stands and population density would be impossible to identify. This isn't simply about jotting down addresses; it's about precisely capturing coordinates and linking them to a comprehensive dataset.
We utilize GPS devices with sub-meter accuracy to record the precise coordinates (latitude and longitude) of each crop stand. This data is then imported into a Geographic Information System (GIS), typically ArcGIS Pro or QGIS. Within the GIS, we create a geodatabase, a structured framework designed to manage spatial data efficiently. Each crop stand is represented as a point feature within this geodatabase, associated with a table containing all the information collected during our assessment - product variety, operational status, population density within a defined radius, and any relevant observations.
The data is structured to allow for complex queries and analyses. For example, we can easily:
- Buffer Analysis: Create buffers around crop stands to determine the population density within a specific service area.
- Spatial Joins: Combine crop stand data with census tract data to analyze demographic characteristics.
- Proximity Analysis: Identify areas with limited access to fresh produce based on the distance to the nearest crop stand.
Maintaining data integrity is paramount. We employ rigorous quality control measures to ensure accurate data entry and spatial referencing. All coordinates are verified against aerial imagery, and discrepancies are investigated and corrected. This meticulous approach ensures that our spatial data serves as a reliable foundation for meaningful analysis and informed decision-making.
Step 5: Data Validation: Ensuring Accuracy and Reliability
Garbage in, garbage out. It's a principle that rings true for any data-driven analysis, and our crop stand and population density assessment is no exception. Simply collecting data isn't enough; verifying its accuracy and reliability is paramount. This step is often the most time-consuming but also the most crucial for producing meaningful results.
Our data validation process involves multiple layers of scrutiny:
- Ground Truthing: We don't just rely on satellite imagery or online listings. We physically visit a sample of crop stand locations to confirm their existence, operating status, and product offerings. This helps us catch instances of outdated information or stands that have closed down.
- Image Comparison: Historical aerial imagery is a powerful tool. Comparing current imagery with past images reveals changes in crop stand locations, expansions, or even disappearances. This temporal analysis provides valuable context and helps identify trends.
- Cross-Referencing with Local Records: Whenever possible, we cross-reference our data with publicly available local government records, agricultural surveys, or business license databases. This adds another layer of verification and helps identify discrepancies.
- Error Checking & Outlier Analysis: We utilize spreadsheets and GIS software to systematically review our data for errors. This includes checking for incorrect coordinates, inconsistent data entry, and identifying outliers - data points that deviate significantly from the norm and warrant further investigation. For example, a crop stand listed within a high-density residential area that is, upon closer inspection, actually a rural farm stand would be flagged and corrected.
- Peer Review: We have a process where another team member reviews the data and findings to catch any overlooked errors or inconsistencies.
This rigorous validation process ensures that the data we present is accurate, reliable, and trustworthy - the foundation for any meaningful analysis and informed decision-making.
Mapping the Findings: Visualizing Crop Stands and Population
Once we've compiled the crop stand counts and population density data, the real story begins to unfold through visualization. Simply having the numbers is valuable, but a well-crafted map transforms abstract data into a readily understandable narrative. We utilize Geographic Information Systems (GIS) software like ArcGIS and QGIS to create a layered approach, showcasing multiple facets of the findings.
Initially, a base map highlighting the geographic distribution of crop stands is created. These are represented as distinct points, often color-coded based on factors like seasonality (permanent vs. temporary) or the variety of produce offered. Overlaid on this map is a heat map representing population density. This allows for a quick visual assessment of areas with both high population and limited access to fresh, local produce - potential food access deserts.
Beyond a simple point map and heat map, we often create graduated symbol maps, where the size of the crop stand symbol reflects factors like annual revenue or the number of employees. This provides a nuanced view of the economic impact of these businesses. Furthermore, we can incorporate thematic maps showcasing specific demographics within a defined radius of each crop stand, such as income levels or age distributions, to gain a deeper understanding of the community being served. These layered visualizations allow us to identify trends, highlight disparities, and ultimately inform strategies for promoting food access and supporting local agriculture. Interactive web maps, accessible through platforms like ArcGIS Online, are increasingly popular, allowing users to explore the data and draw their own conclusions.
Analyzing the Data: Uncovering Patterns and Insights
Once we're confident in the accuracy and completeness of our data, the real exploration begins. Simply having the numbers isn't enough - it's about what those numbers tell us. Our analysis moves beyond simple counting to reveal nuanced patterns and insights that inform decision-making.
A core element of our approach is spatial analysis. We use Geographic Information Systems (GIS) to overlay crop stand locations with demographic data, identifying areas with high population density and limited access to fresh produce. Heatmaps visually represent these food access deserts, highlighting areas where crop stands could play a vital role in bridging the gap.
We also calculate density metrics. For example, we might determine the average number of crop stands per capita within specific census tracts. This allows for comparisons between different neighborhoods and helps identify areas that are underserved or, conversely, potentially oversupplied. Correlation analysis investigates the relationship between crop stand density and various factors, such as median income, ethnic demographics, and proximity to transportation routes. Do wealthier neighborhoods have more stands? Are certain ethnic communities more likely to operate or support these businesses?
Beyond simple statistics, we look for trends over time. Comparing historical crop stand locations with current data reveals shifts in agricultural practices, urbanization patterns, and changing consumer preferences. A decline in crop stands over a decade, for instance, might signal a need for targeted support programs to ensure continued access to local produce. Finally, we use spatial regression models to isolate the factors most strongly influencing crop stand location and prevalence, allowing us to build predictive models for future planning and resource allocation.
Tools and Technologies: Your Guide to Mapping Local Food
Mapping crop stand locations and analyzing population density isn't just about wandering around with a notebook (though that can be part of it!). A range of digital tools and technologies streamline the process and unlock deeper insights. Here's a look at what you'll need, broken down by function.
1. Geographic Information Systems (GIS) - The Heart of the Operation:
- ArcGIS (Esri): The industry standard. Powerful, feature-rich, and offers both desktop and cloud-based solutions. Consider ArcGIS Pro for advanced analysis and mapping capabilities. While robust, it has a steeper learning curve and licensing costs can be significant.
- QGIS: A free and open-source alternative to ArcGIS. Surprisingly powerful and boasts a large and supportive community. A great choice for budget-conscious users and those who prefer open-source solutions.
- Google Earth Pro: An accessible option for basic mapping and observation. Excellent for initial reconnaissance and visual assessment of potential crop stand locations.
2. Data Collection & GPS:
- Smartphone GPS Apps: Essential for recording precise location data in the field. Many free and paid apps are available for both iOS and Android.
- Handheld GPS Devices: Offer improved accuracy and battery life compared to smartphones, especially in areas with poor cell service.
- Drones/UAVs: Increasingly useful for aerial imagery and monitoring crop stand conditions. Requires proper licensing and training.
3. Spreadsheet Software:
- Microsoft Excel: A widely used option for organizing and managing data.
- Google Sheets: A free, cloud-based alternative that facilitates collaboration.
- OpenOffice Calc: Another free and open-source option.
4. Online Mapping Platforms:
- Google My Maps: A simple way to create custom maps and share them with others. Ideal for basic visualization and collaboration.
- Leaflet/Mapbox: JavaScript libraries for building interactive web maps. Requires coding knowledge but offers greater customization.
5. Data Sources & APIs:
- U.S. Census Bureau: Provides demographic data for population density analysis.
- Local Government Open Data Portals: Often contain information on businesses, permits, and other relevant data.
- APIs (Application Programming Interfaces): Allow you to integrate data from various sources into your mapping projects (e.g., accessing real-time business data).
Future Directions: Expanding Our Understanding
Beyond simply counting stands and assessing population density, several exciting avenues for future research and data collection present themselves. We're currently exploring incorporating data on vehicle traffic patterns near crop stands - understanding accessibility for those without local transportation could provide a more nuanced picture of food access. Furthermore, integrating data on the economic viability of crop stands, such as average sales or operating costs, would offer insights into their sustainability and the challenges farmers face.
Looking ahead, leveraging remote sensing techniques, like high-resolution satellite imagery and drone surveys, promises to automate much of the initial stand identification process, increasing efficiency and allowing for broader geographic coverage. Machine learning algorithms, trained on labeled datasets of crop stand imagery, could also be employed to classify stands based on their characteristics (e.g., size, types of products offered). Finally, building a citizen science component, encouraging local residents to contribute observations and photos of crop stands, would significantly enhance the richness and timeliness of our data, fostering a deeper community connection to this vital aspect of our local food systems.
Resources & Links
- USDA Economic Research Service (ERS) : Provides extensive data and analysis on agricultural production, markets, and trade. Crucial for understanding the broader context of local food systems and potential supply chains. Provides stats on farm demographics and agricultural practices that impact crop stand viability.
- U.S. Census Bureau : Essential for population density data, demographic information, and household characteristics. Provides detailed population counts, age demographics, income levels, and housing data, vital for Step 2 and Step 3 of the checklist.
- Esri ArcGIS : Industry-leading GIS software. Offers a range of tools for mapping, data management, and spatial analysis. Used for recording, visualizing, and analyzing spatial data (Step 4 & Mapping the Findings). A commercial option with a free trial/educational license available.
- QGIS : Open-source Geographic Information System. A powerful, free alternative to ArcGIS, allowing for data recording, visualization, and analysis (Step 4 & Mapping the Findings). Great for budget-conscious users or those preferring open-source solutions.
- Leaflet : A popular open-source JavaScript library for interactive maps. Excellent for creating web-based map visualizations from your collected data (Mapping the Findings). Can be easily embedded in blogs and websites.
- Data.gov : A portal to US government datasets. May contain data related to local farms, food assistance programs, or other relevant information to enrich your analysis.
- USDA Agricultural Marketing Service (AMS) : Provides resources and information related to farmers markets, direct-to-consumer marketing, and other aspects of local food systems. Helps define what constitutes a 'crop stand' for consistency in data collection.
- City-Data.com : Provides demographic and statistical information for cities, towns, and neighborhoods across the United States. Useful for supplementary population density and characteristic data (Step 3).
- Mapbox : Provides mapping tools and APIs, including beautiful basemaps and tools for custom map design. Useful for creating engaging and informative visualizations (Mapping the Findings).
- Open Data Portal : A central hub for open government data. It can potentially contain local food related data released by various agencies. Explore for niche datasets.
- Google Maps : A familiar tool for initial reconnaissance and finding potential crop stand locations. Useful for preliminary location identification during Step 1.
- National Renewable Energy Laboratory (NREL) : While primarily focused on energy, NREL data on land use and agricultural practices can be valuable context. May inform discussions about farm viability and potential crop stand locations.
Frequently Asked Questions
What is 'Mapping Local Food' and why is it important?
This article explores how to map the relationship between local food sources (like crop stands) and population density. It's important because understanding this connection can help identify food deserts, optimize the placement of farmers markets and mobile markets, and support local food systems overall. It helps inform decisions for food access and community development.
What's a 'crop stand' as defined in this article?
For the purposes of this mapping exercise, a 'crop stand' refers to any temporary or semi-permanent location where locally grown produce, agricultural products, or homemade food items are sold directly to consumers. This includes roadside stands, farm booths at farmers' markets, and similar setups.
What kind of data do I need to collect for crop stand counts?
You'll need to record the location (latitude/longitude or address), type of products sold (produce, meat, dairy, etc.), hours of operation (or days of the week open), and any identifying features of the crop stand. Photos are helpful too!
How do I determine population density for an area?
You can obtain population density data from various sources, including the US Census Bureau (census.gov), state and local government websites, and GIS data portals. The article suggests using block-level population data for more granular insights.
What GIS software is recommended for this mapping project?
While the article doesn't specifically endorse one software, popular choices include QGIS (free and open-source), ArcGIS (commercial), and Google Earth Pro (free). The most important factor is choosing a tool you're comfortable using and that can handle spatial data.
How accurate do my crop stand counts need to be?
While perfect accuracy is difficult to achieve, strive for the best possible effort. Documenting any uncertainties or assumptions in your data collection process is crucial. A reasonable degree of completeness (covering as many crop stands as possible) is more important than pinpoint precision in every case.
Can this methodology be adapted for other regions or countries?
Yes! The core principles of mapping local food sources and population density are universally applicable. You will need to adapt the data sources and potentially the definitions of 'crop stand' to align with the specific context of your region or country.
What are some potential challenges I might encounter while collecting this data?
Challenges can include difficulty locating all crop stands (they may be temporary or unlisted), inconsistencies in hours of operation, privacy concerns related to crop stand owners, and access to accurate and up-to-date population data.
What can I do with the map I create?
The map can be used to identify areas with limited access to local food, inform the placement of new food resources, advocate for policies supporting local agriculture, and raise awareness within your community about the importance of local food systems.
Where can I find more resources on GIS and data visualization?
Many online resources are available. Check out QGIS tutorials on YouTube, ESRI's ArcGIS resources, and various online courses on data visualization platforms like Tableau or Power BI. Your local library may also offer GIS training.
Found this Article helpful?
Agriculture Management Solution Demo
Running a farm or agricultural business is complex. ChecklistGuro's Work OS platform simplifies your operations, from crop planning and irrigation management to livestock tracking and harvest scheduling. Increase efficiency, reduce waste, and boost yields! See how ChecklistGuro can revolutionize your agriculture business.
Related Articles
10 Simple Steps to a Healthy Drainage System: Your Checklist Template

Mastering the Daily Crop Scouting Report: Your [Specific Crop] Checklist Template
Irrigation System Checklist: Farm Water Management & Crop Yield Optimization
Unlock Your Garden's Potential: A Soil pH Verification Checklist
PPE Usage Checklist Template: Your Guide to Safety
Water Discharge Permit Compliance Checklist Template
The Ultimate GPS & Precision Farming Calibration Checklist Template
Water Runoff Analysis Checklist Template
We can do it Together
Need help with
Agriculture?
Have a question? We're here to help. Please submit your inquiry, and we'll respond promptly.