Your Grain Quality Checklist: A Step-by-Step Guide
Published: 09/02/2025 Updated: 12/13/2025
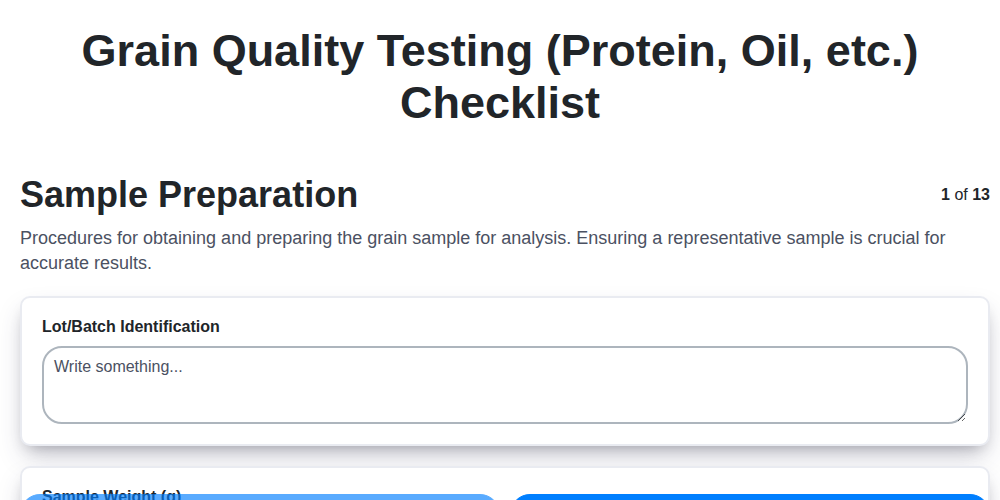
Table of Contents
- Introduction: Why Grain Quality Matters
- 1. Sample Preparation: The Foundation of Accurate Results
- 2. Moisture Content: A Critical First Assessment
- 3. Protein Content: Impacting Baking and Nutritional Value
- 4. Oil Content: Evaluating Quality in Oilseed Grains
- 5. Starch Quality: Texture and Processing Considerations
- 6. Fiber Content: Nutritional Profile Analysis
- 7. Test Weight & Bulk Density: Assessing Grain Plumpness
- 8. Falling Number: Enzyme Activity in Wheat
- 9. Gluten Assessment (Wheat): Dough Strength and Elasticity
- 10. Germination Rate: Vital for Seed Grain
- 11. Pest & Disease Detection: Safeguarding Quality
- 12. Data Recording & Reporting: Tracking Progress & Sharing Results
- Resources & Links
TLDR: Ensure top-quality grain with this easy-to-use checklist! It covers everything from moisture and protein content to pest assessment and mycotoxin screening - helping you meet standards, maximize profits, and make informed decisions about your harvest. Download the template and start testing!
Introduction: Why Grain Quality Matters
Beyond simply filling a silo, grain represents a significant investment - time, resources, and effort. Its quality directly impacts profitability, market access, and even consumer health. Think of it this way: a substandard harvest can lead to reduced milling yields, rejected shipments, and ultimately, a hit to your bottom line. Conversely, consistently delivering high-quality grain strengthens your reputation, commands premium prices, and fosters long-term relationships with buyers. Understanding the nuances of grain quality - from protein content and oil levels to starch characteristics and the absence of harmful toxins - empowers you to make informed decisions that maximize returns and minimize risks throughout the entire agricultural process. It's more than just a harvest; it's a commitment to excellence.
1. Sample Preparation: The Foundation of Accurate Results
The quality of your final test results hinges entirely on the accuracy and representativeness of your initial sample. A biased or poorly prepared sample can lead to misleading conclusions and incorrect decisions. Here's how to lay the groundwork for reliable results:
1. Representative Sampling - More Than Just a Scoop:
Avoid simply grabbing a handful of grain from the top of the pile. This often represents only the most exposed portion, which might be affected by factors like weather or handling. Instead, employ a systematic approach:
- Multiple Samples: Collect samples from various locations within the storage facility - the center, the edges, the bottom, and any areas that appear different.
- Core Sampling: Using a grain probe or auger, extract core samples to a consistent depth. This ensures you're reaching a cross-section of the grain mass.
- Large Composite Sample: Combine all the individual samples into a single, larger composite sample. This composite sample should be large enough (typically 2-5 kg, but check specific test requirements) to be representative of the entire lot.
2. Cleaning - Removing the Interference:
Carefully remove any foreign material - stones, weed seeds, broken kernels, or debris - from your sample. These contaminants can directly affect the results of some tests (e.g., moisture content). Be thorough but gentle to avoid introducing bias.
3. Subsampling - Scaling Down for Efficiency:
The initial composite sample is often too large to be easily tested. Carefully reduce the sample size using a quartering and coneing method, ensuring the subsample retains the original composition.
4. Maintaining Integrity - Preventing Contamination & Alteration:
- Clean Equipment: Utilize clean and dry sampling tools and containers.
- Protect from the Elements: Shield the sample from sunlight, rain, and extreme temperatures during the entire process.
- Labeling: Clearly label each sample with date, location, and any relevant information. This is crucial for traceability.
2. Moisture Content: A Critical First Assessment
Moisture content is arguably the most crucial initial assessment for any grain sample. Why? Because it directly impacts storage stability, milling performance, and overall grain quality. Excess moisture creates an environment conducive to microbial growth, leading to spoilage, mold development, and pest infestations. Conversely, grain that's too dry can be prone to breakage during handling and processing.
Accurate moisture measurement isn't just about meeting a target range; it's about preventing future problems. Utilizing reliable methods, such as electric moisture meters (which are convenient but require calibration) or oven drying (considered the gold standard for accuracy), allows you to make informed decisions about storage conditions and handling procedures. Remember, a seemingly small deviation from the optimal moisture range can have significant consequences for your entire grain harvest. Consistent monitoring throughout the storage period is essential to maintaining quality and minimizing losses.
3. Protein Content: Impacting Baking and Nutritional Value
Protein isn't just a buzzword; it's a critical factor influencing both the baking performance of wheat and the nutritional value of many grains. For wheat, protein content directly affects gluten development - the foundation of a strong, elastic dough that traps gases and produces a desirable bread texture. Higher protein levels generally lead to stronger doughs, resulting in breads with better rise, crumb structure, and overall quality. However, too much protein can also create a tough dough that's difficult to handle.
Beyond baking, protein contributes significantly to the nutritional profile of grains like corn, barley, and rice. It's an essential macronutrient, vital for human health, providing amino acids that the body cannot produce on its own. Grain producers often aim to increase protein levels to cater to the growing demand for nutrient-dense foods and animal feed. Testing protein content allows producers to optimize growing conditions, varieties, and storage practices to maximize this valuable component, ensuring a higher quality product for both consumers and end-users. A consistent assessment helps maintain market value and opens up opportunities for premium pricing based on enhanced nutritional content.
4. Oil Content: Evaluating Quality in Oilseed Grains
Oilseed grains-like soybeans, canola, sunflowers, and corn-are cultivated primarily for their high oil content, making them crucial ingredients in cooking oils, animal feed, and increasingly, biofuels. Measuring this oil content isn't just about knowing how much oil is present; it's about evaluating the overall quality and value of the grain. A higher oil content generally translates to greater potential yield and profitability, but it's not the only factor.
The standard method for determining oil content is Soxhlet extraction. This process involves extracting the oil from a known weight of grain using a solvent, typically hexane. The extracted oil is then weighed, and the percentage of oil is calculated based on the original grain weight. The result is usually expressed as a percentage, for example, 48% oil content.
Beyond the raw percentage, consider these important nuances:
- Free Fatty Acid (FFA) Content: A high FFA content indicates oil degradation, often due to improper storage or pre-harvest factors. Elevated FFA reduces the oil's suitability for certain applications and can negatively impact price.
- Moisture Content Correlation: Oil content is affected by moisture. Accurate moisture determination before oil extraction is crucial for reliable results.
- Variety Differences: Different grain varieties naturally possess different oil content levels. Knowing the expected range for your specific variety is important.
- Impact on Processing: Oil content directly influences milling efficiency and the type of processing required.
5. Starch Quality: Texture and Processing Considerations
Starch isn't just present in grains; its quality significantly impacts how it behaves during processing and the final product's characteristics. Understanding starch quality involves more than just measuring its total content. We're talking about its composition - the ratio of amylose to amylopectin - and how it gelatinizes.
Amylose vs. Amylopectin: A Key Distinction
Amylose and amylopectin are two different forms of starch. Amylose tends to form strong, gel-like structures when cooked, contributing to viscosity and firmness. Amylopectin, on the other hand, has a branched structure and results in a more pasty or creamy texture. The ratio of these two components is a crucial factor. Higher amylose content generally leads to more stable gels and stronger textures, while higher amylopectin content yields softer, more adhesive results.
Gelatinization: The Cooking Process
Gelatinization is the process where starch granules absorb water and swell when heated. The temperature at which gelatinization begins and ends (the gelatinization range) and the viscosity of the resulting paste are key indicators of starch quality. A wide gelatinization range can be problematic in some applications, leading to unpredictable results. Factors like starch granule size and damage also influence gelatinization behavior. Different end-uses require different starch properties - for instance, a crispbread needs starch that forms a strong, non-sticky gel, while a cake batter benefits from a starch that produces a soft, pliable dough. Analyzing these properties helps optimize processing conditions and ensures desired product texture and performance.
6. Fiber Content: Nutritional Profile Analysis
Understanding fiber content in grain goes beyond simply quantifying a number - it's about unlocking valuable insights into its nutritional profile and potential applications. Fiber, broadly categorized as soluble and insoluble, plays a crucial role in human health, contributing to digestive regularity, blood sugar control, and overall well-being.
The standard method for determining fiber content involves a series of weighing and digestion procedures. The sample is treated with acid and enzyme solutions to remove non-fiber components, leaving behind the residual fiber. This residue is then weighed and the percentage calculated based on the original sample weight.
Beyond the simple percentage, analyzing the types of fiber present - soluble versus insoluble - provides a more detailed picture. Soluble fiber, like beta-glucan in oats and barley, helps lower cholesterol and stabilize blood glucose. Insoluble fiber, abundant in wheat bran and corn, promotes bowel regularity.
For grain destined for animal feed, fiber content influences digestibility and nutrient absorption. Higher fiber levels can sometimes limit the availability of other essential nutrients. Conversely, in human food applications, the appropriate fiber level is a key factor influencing texture, palatability, and overall nutritional value. Knowing the specific fiber profile helps tailor grain usage for maximum benefit.
7. Test Weight & Bulk Density: Assessing Grain Plumpness
Test weight and bulk density are straightforward but incredibly valuable indicators of grain quality, essentially telling you how plump and uniform your grain is. Test weight specifically refers to the weight of a known volume of grain (typically a bushel). A higher test weight generally indicates a larger, more fully developed kernel, which translates to better milling qualities and overall higher quality. Bulk density, closely related, measures the weight of grain occupying a specific cubic volume - it's influenced by kernel size and shape, as well as the amount of broken or damaged kernels present.
Lower-than-expected test weight or bulk density can be a sign of environmental stress during growth (drought, heat), disease, or pest damage. While it doesn't tell you why the grain is lighter, it flags a potential issue that warrants further investigation. Conversely, consistently high test weight and bulk density are positive signs of a healthy, well-grown crop. Understanding these measurements allows you to make informed decisions about storage, pricing, and future planting strategies. Keep a record of your test weight and bulk density results alongside other quality data to identify trends and optimize your growing practices.
8. Falling Number: Enzyme Activity in Wheat
The Falling Number test is a crucial indicator of enzyme activity in wheat, particularly impacting its suitability for bread making. It measures the time it takes for a weighted plunger to fall through a heated wheat starch paste. A longer falling time indicates lower amylase enzyme activity - a desirable characteristic for high-quality bread flour. Amylase enzymes break down starch into sugars, which can lead to sticky dough and a loaf with poor structure and flavor if present in excessive amounts. Factors contributing to low Falling Numbers include sprout damage during harvest (pre-harvest germination) and improper storage conditions that encourage fungal growth and enzyme production. Acceptable Falling Numbers typically range from 300-400 seconds, though this can vary depending on the specific wheat variety and intended use. Consistently low Falling Numbers warrant investigation into harvest practices, storage conditions, and potential fungal contamination.
9. Gluten Assessment (Wheat): Dough Strength and Elasticity
Gluten, the protein complex unique to wheat, is the backbone of bread making. Its quality directly dictates the dough's ability to trap gases, develop structure, and ultimately, produce a loaf with desirable texture and volume. Gluten assessment goes beyond simply measuring how much gluten is present; it's about evaluating its functionality - its strength and elasticity.
What do we measure?
- Gluten Strength: This refers to the dough's resistance to tearing or breaking. A strong dough can withstand more mixing and shaping without losing its integrity. We typically evaluate strength using an Extensograph. The extensograph measures the force required to stretch a small piece of dough to a defined point. A higher peak force indicates greater dough strength.
- Gluten Elasticity: Elasticity describes the dough's ability to return to its original shape after being stretched or deformed. Highly elastic dough retains gases effectively, contributing to a light and airy crumb. The extensograph also provides information on elasticity - the area under the curve represents the dough's overall workability.
- Gluten Content: While not a direct measure of strength or elasticity, gluten content provides context. Lower gluten content often correlates with weaker dough.
Why does it matter?
- Bread Volume & Texture: Strong and elastic doughs produce higher volume bread with a desirable crumb structure.
- Mixing Behavior: Gluten quality influences mixing time and energy requirements.
- Process Adaptability: Understanding gluten characteristics allows for adjustments to milling processes and baking recipes.
10. Germination Rate: Vital for Seed Grain
Seed grain quality hinges critically on its germination rate - the percentage of seeds capable of sprouting under favorable conditions. This isn't just about getting a good stand of crops; it's about maximizing yield potential and minimizing waste. A low germination rate translates directly to replanting costs, reduced harvest output, and ultimately, lost income.
Several factors influence germination, including seed vigor, moisture content, temperature, and seed-borne diseases. Testing germination rate provides a clear indication of seed viability and overall quality. Standardized germination tests involve placing a predetermined number of seeds under controlled conditions (moisture, temperature, light) and observing sprout emergence over a specific timeframe, typically around 7-14 days. The resulting percentage reflects the proportion of viable seeds.
Before planting, it's essential to understand the minimum acceptable germination rate for your specific crop and region. This threshold often depends on planting density and potential for replanting. Consistently low germination rates may signal underlying issues with seed storage, seed treatment, or seed source, prompting further investigation and corrective action. Accurate germination testing empowers informed planting decisions and optimizes crop performance.
11. Pest & Disease Detection: Safeguarding Quality
Detecting pests and diseases early is crucial for preventing quality degradation and potential economic losses. Visual inspection is the first line of defense - carefully examine the grain for signs of infestation (insects, larvae, webbing) or fungal growth (discoloration, moldy odors). Pay particular attention to areas where moisture may accumulate, like the bottom of bins or near ventilation openings.
Beyond the naked eye, microscopic examination can reveal the presence of fungal spores or insect eggs not visible during routine inspection. Common pests include weevils, moths, and beetles, while diseases can range from mild surface molds to more serious conditions like Fusarium head blight (in wheat).
Prompt action is essential. This might involve fumigation, aeration to reduce moisture and create an unfavorable environment for pests, or applying appropriate fungicides - always adhering to label instructions and regulatory guidelines. Maintaining proper storage conditions (temperature, humidity, ventilation) is the best preventative measure against both pests and diseases. Regular monitoring throughout the storage period is vital for maintaining grain quality and safeguarding your investment.
12. Data Recording & Reporting: Tracking Progress & Sharing Results
Consistent data recording isn't just about ticking a box; it's the foundation of informed decision-making and continuous improvement. Every test result - from moisture content to gluten strength - should be meticulously documented, including the date, testing method, analyst, and any relevant observations. A simple spreadsheet, a dedicated quality management software, or even a well-organized paper logbook can serve as your data repository.
But the power of data extends far beyond storage. Regularly analyzing your recorded results allows you to identify trends over time: Are protein levels consistently declining? Is falling number consistently below the target range? These insights can pinpoint underlying issues, like soil nutrient deficiencies or pest infestations, allowing you to proactively adjust your practices.
Sharing these results is equally crucial. Clear and concise reports should be distributed to key stakeholders - whether it's your team, your suppliers, or your buyers. Visualizations like graphs and charts can make complex data more accessible and impactful. Don't hesitate to highlight successes, but also transparently address any areas needing attention. Open communication fosters trust and strengthens relationships across the entire grain supply chain. Remember, your data tells a story - make sure it's a compelling one that reflects your commitment to quality.
Resources & Links
- American Association of Cereal Chemists (AACC) : AACC is a leading professional organization for scientists and technologists in the cereal and related industries. Their website provides information on grain quality analysis methods, standards, and publications, crucial for understanding and applying the steps outlined in the checklist. Offers webinars, courses, and publications related to grain quality assessment.
- World Health Organization (WHO) : While not exclusively about grain quality, the WHO's reports on nutrition and food safety provide valuable context for understanding the importance of grain quality in relation to human health and dietary needs. This helps ground the technical aspects within a broader public health perspective.
- Food and Agriculture Organization of the United Nations (FAO) : FAO provides comprehensive information on grain production, storage, and quality, including regional reports and guidelines. This helps understand the bigger picture of grain quality in a global context.
- University of Illinois Department of Crop Sciences (Grain Science) : The University of Illinois has a strong grain science program with extensive research on grain quality. Their website may contain articles, research papers, and educational resources related to the different quality parameters discussed in the checklist, especially regarding starch and protein quality.
- Lab Equipment Suppliers (Various) : Many companies specialize in lab equipment. Websites like this will allow readers to research equipment needed for moisture content measurement, protein content analysis, oil content determination and more. Examples include Denver Instruments, Perten Instruments, and others.
- Rural Industries Research and Development Corporation (RIRDC) : RIRDC (primarily for Australia) conducts research and provides resources on grains and agricultural products. Their publications can offer practical insights into grain quality assessment techniques and challenges.
- University of Minnesota Extension : This extension service often provides practical guides and resources on grain handling, storage, and quality for farmers and agricultural professionals. They often cover topics relevant to the 'pest & disease detection' and 'test weight' aspects.
- Queensland Department of Agriculture and Fisheries (DAF) : Government agricultural departments (like this one) often provide region-specific information on grain quality standards, regulations, and best practices. Useful for understanding local context and compliance requirements. Many similar departments exist for other regions.
- USDA National Agricultural Library : The USDA's National Agricultural Library provides access to a vast collection of agricultural information, including publications and datasets related to grain quality. Provides baseline data and deeper understanding.
- UK Mycotoxin Survey Group : Specifically relates to 'Pest & Disease Detection'. Mycotoxins can be a significant concern in grain. This site provides information and resources on identifying and managing mycotoxin contamination, a crucial aspect of grain quality.
Frequently Asked Questions
What is grain quality and why is it important?
Grain quality refers to the physical and chemical characteristics of grains like wheat, corn, rice, and oats that determine their suitability for different uses (e.g., milling, animal feed, industrial processing). It's important because it directly affects yield, processing efficiency, final product quality, and ultimately, profitability. Poor grain quality can lead to reduced yields, higher processing costs, and a lower value product.
Who is this checklist for?
This checklist is designed for farmers, grain handlers, millers, feed producers, and anyone involved in the production, storage, or processing of grains. It aims to provide a practical guide for assessing and improving grain quality.
What are the main areas covered in the grain quality checklist?
The checklist covers key aspects including visual inspection (cleanliness, damage, mold), moisture content, test weight, kernel size and shape, protein content (for some grains), and presence of foreign material. It also addresses storage conditions.
How accurate do I need to be when performing moisture content testing?
Moisture content is a critical factor. Use calibrated instruments and follow the manufacturer's instructions carefully. A slight variation can significantly impact storage stability and grain quality. Aim for accuracy within +/- 0.5-1%.
What does 'test weight' measure and why is it important?
Test weight measures the weight of a known volume of grain. It's an indicator of grain density and kernel plumpness. Higher test weight generally indicates better quality and a greater yield.
What constitutes 'damage' in the visual inspection section, and what does it signify?
'Damage' includes cracked kernels, broken kernels, insect-damaged kernels, and kernels with physical defects. It indicates potential for spoilage, increased susceptibility to pests, and reduced milling or processing efficiency.
What should I do if I find mold on my grain?
If you find mold, immediately isolate the affected grain to prevent further contamination. Thoroughly clean and disinfect the storage area before storing any more grain. Contact a grain specialist or agricultural extension agent for guidance.
How often should I be performing these checks?
The frequency of checks depends on the storage conditions and the type of grain. We recommend regular checks (weekly or bi-weekly) during storage, more frequent checks during periods of high humidity or insect activity, and before shipping or processing.
Where can I find more detailed information on specific grain quality parameters?
For more in-depth information on specific grain quality parameters and testing methods, consult your local agricultural extension office, grain handling specialists, or reputable agricultural resources (e.g., university websites, industry publications).
Are there any tools or equipment I will need to perform this checklist?
You'll need basic equipment such as a moisture meter, scales, measuring cups/buckets, a visual inspection surface (light-colored cloth or table), and potentially some specialized equipment like a grain analyzer depending on the level of detail you need.
Found this Article helpful?
Agriculture Management Solution Demo
Running a farm or agricultural business is complex. ChecklistGuro's Work OS platform simplifies your operations, from crop planning and irrigation management to livestock tracking and harvest scheduling. Increase efficiency, reduce waste, and boost yields! See how ChecklistGuro can revolutionize your agriculture business.
Related Articles

10 Simple Steps to a Healthy Drainage System: Your Checklist Template

Mastering the Daily Crop Scouting Report: Your [Specific Crop] Checklist Template
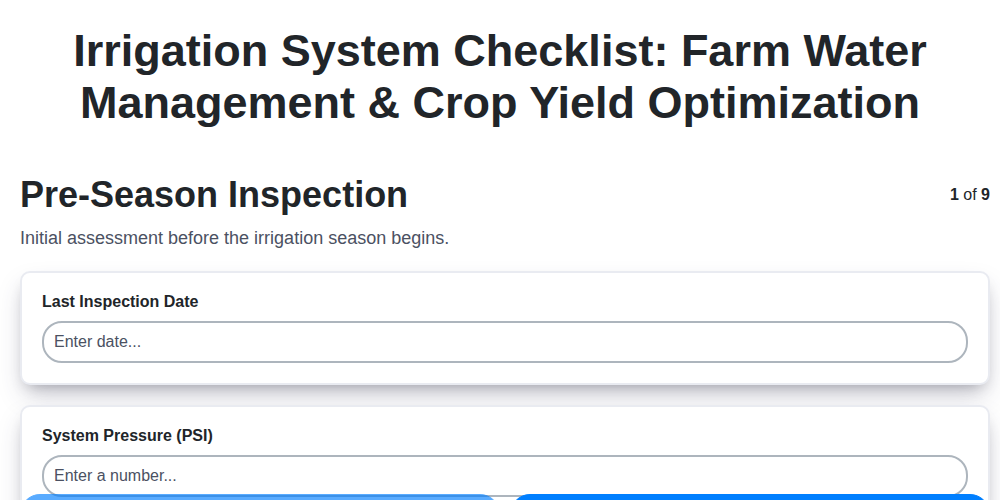
Irrigation System Checklist: Farm Water Management & Crop Yield Optimization

Unlock Your Garden's Potential: A Soil pH Verification Checklist

PPE Usage Checklist Template: Your Guide to Safety

Water Discharge Permit Compliance Checklist Template

The Ultimate GPS & Precision Farming Calibration Checklist Template

Water Runoff Analysis Checklist Template
We can do it Together
Need help with
Agriculture?
Have a question? We're here to help. Please submit your inquiry, and we'll respond promptly.