 ChecklistGuro
Bus Route Planning & Optimization Audit Checklist - Public Transit
Ensure efficient and cost-effective bus routes! This audit checklist helps you analyze route performance, identify bottlenecks, and optimize schedules for maximum passenger satisfaction and operational excellence. Download now and revolutionize your public transit network.
This Template was installed 5 times.
Route Network Analysis
Assessment of overall route coverage, redundancy, and efficiency.
Total Route Miles
Number of Routes Served
Average Route Length (Miles)
Route Network Density (High/Medium/Low)
Route Redundancy (High/Medium/Low)
Description of Route Network Structure
Date of Last Network Review
Rider Demand & Performance Data Review
Examination of ridership data, on-time performance, and service frequency across routes.
Average Daily Ridership (Last 7 Days)
Peak Hour Ridership (AM)
Peak Hour Ridership (PM)
Date of Last Ridership Data Collection
Time of Peak Ridership (AM)
Time of Peak Ridership (PM)
Ridership Trend (Last 3 Months)
On-Time Performance (%)
Route Alignment & Infrastructure Assessment
Evaluation of route alignment, road conditions, traffic signals, and potential obstructions.
Identify locations of road surface issues (potholes, cracks) along the route.
Average speed of buses along the route (mph).
Describe any observed traffic signal timing issues impacting bus travel time.
Number of pedestrian crosswalks along the route.
Note any observed obstructions (e.g., parked cars, construction) affecting bus maneuverability.
Condition of bus shelters along the route?
Date of last infrastructure inspection of the route.
Accessibility & Equity Considerations
Review of route accessibility for individuals with disabilities and equitable service provision across different communities.
Are bus stops ADA compliant (ramps, detectable warnings)?
Number of routes serving low-income areas
Level of consultation with disability advocacy groups during route planning?
Describe any observed accessibility barriers for riders with disabilities.
Is service frequency adequate in areas with a high proportion of seniors?
Percentage of ridership within a defined equity focus area (e.g., low-income, minority populations)
Describe any identified gaps in service to underserved communities.
Integration with Other Transportation Modes
Analysis of connections to other transit systems, bike paths, and pedestrian walkways.
Proximity to Rail Stations
Distance to Nearest Bike Share Station (miles)
Coordination with Park & Ride Facilities
Modes Integrated With (Select all that apply)
Location of Key Transfer Points (Map)
Description of Transfer Procedures
Operational Efficiency and Cost Analysis
Assessment of fuel consumption, driver productivity, and overall route operating costs.
Average Fuel Consumption (Gallons/Mile)
Driver Hours per Route (Average)
Maintenance Costs per Bus (Annual)
Route Operating Cost per Rider
Bus Utilization Rate (%)
Average Layover Time (Minutes)
Total Route Mileage
Passenger Feedback and Complaints
Review of passenger feedback regarding route convenience, reliability, and safety.
Describe the issue you experienced.
Rate your overall satisfaction with the route (1-5, 1 being very dissatisfied, 5 being very satisfied).
What best describes the nature of your complaint?
Which aspects of the route/service need improvement?
Date of the incident/experience
Time of the incident/experience
Location of the incident (if applicable)
Compliance with Regulations and Standards
Verification of adherence to applicable local, state, and federal regulations regarding route planning and operation.
Applicable Local Route Planning Ordinances Reviewed?
Compliance with ADA (Americans with Disabilities Act) Route Standards?
Minimum Safe Following Distance (feet) – Confirmed adherence to regulations?
Date of Last Regulatory Review
Summary of Deviations and Corrective Actions
Supporting Documentation (e.g., permits, approvals)
Compliance with State Route Design Manual?
Future Growth and Adaptation
Planning considerations for population growth, land use changes, and evolving transportation needs.
Projected Population Growth (5-year)
Anticipated Land Use Changes & Impact
Potential New Route Corridors Identified?
Date of Next Route Review/Revision
Potential New Transportation Technologies to Consider?
Notes on Potential Service Expansion Areas
Technology Integration & Data Utilization
Evaluation of the use of technology (e.g., GPS tracking, real-time passenger information) to optimize route planning and improve efficiency.
Percentage of buses equipped with GPS tracking
Real-time passenger information system implemented?
Data sources utilized for route optimization (Select all that apply)
Date of last data analytics platform update
Description of data analytics methods used for route optimization
Use of predictive analytics for ridership forecasting?
Upload screenshot of dashboard displaying key performance indicators (KPIs)
Frequently Asked Questions
Can I customize this template after installing it?
Absolutely. Once installed, you can add, remove, or reorder tasks, add custom fields, and adjust deadlines to fit your specific workflow.
Can I add images or photos to these checklist items?
Yes. Our platform allows you to attach photos, signatures, and notes to any checklist item for better verification and proof of completion.
Can I create a custom checklist from scratch instead of using a template?
Yes. You can use our "Create your own checklist" feature to build a unique workflow tailored exactly to your operational requirements.
Can I add dependencies between tasks?
Yes, you can set up conditional logic and dependencies to ensure your team follows the correct sequence of operations.
Can I assign specific checklist items to different team members?
Yes. You can assign individual tasks to specific employees, ensuring clear accountability across your entire team.
Can I use these checklists on mobile devices in the field?
Yes. Our platform is fully responsive, allowing your team to complete, update, and upload photos to checklists directly from any smartphone or tablet.
How do I notify my manager when a checklist is completed?
You can set up automated notifications (via email, push notification, or in-app alerts) to trigger whenever a checklist is finished or if an item fails inspection.
Can multiple people work on the same checklist simultaneously?
Yes, the platform supports real-time updates, allowing multiple users to contribute to a single live checklist.
Where is the data from completed checklists stored?
All completed checklists are stored securely in your Work OS dashboard, creating a permanent, searchable audit trail of your operations.
Can I generate reports based on my checklist results?
Yes. You can track completion rates, identify recurring issues, and monitor team performance through our integrated reporting and analytics tools.
How can I use these checklists for compliance or auditing purposes?
Because our checklists capture timestamps, photos, and digital signatures, they serve as a robust digital paper trail for regulatory compliance and internal audits.
Can I export my completed checklist data for use in other tools?
Yes. You can export your data in various formats (CSV, Excel, etc.) to integrate your operational insights with your other business software.
Comments
There are no comments yet. Be the first to add one!
Public Transport Management Solution Demo
Optimize public transport operations & enhance passenger experience! ChecklistGuro streamlines route planning, vehicle maintenance, and incident reporting. Improve efficiency, safety, and reliability. Manage it all with our Work OS.
Related Checklist Templates
Public Transport Noise Reduction Measures Audit Checklist Template
Train Signal System Inspection Checklist Template
Bus Route Deviation and Stop Accuracy Audit Checklist - Public Transit
Public Transport Accessibility for Passengers with Disabilities Audit Checklist Template
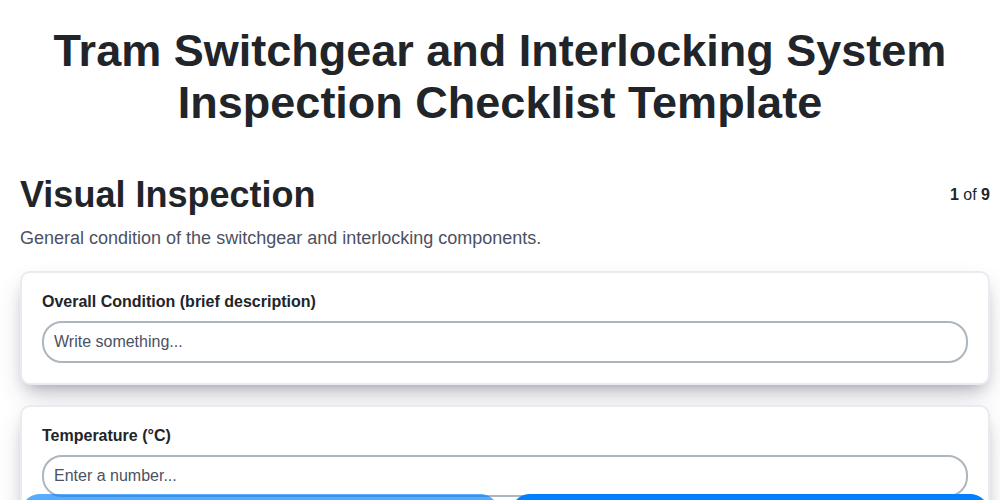
Tram Switchgear and Interlocking System Inspection Checklist Template
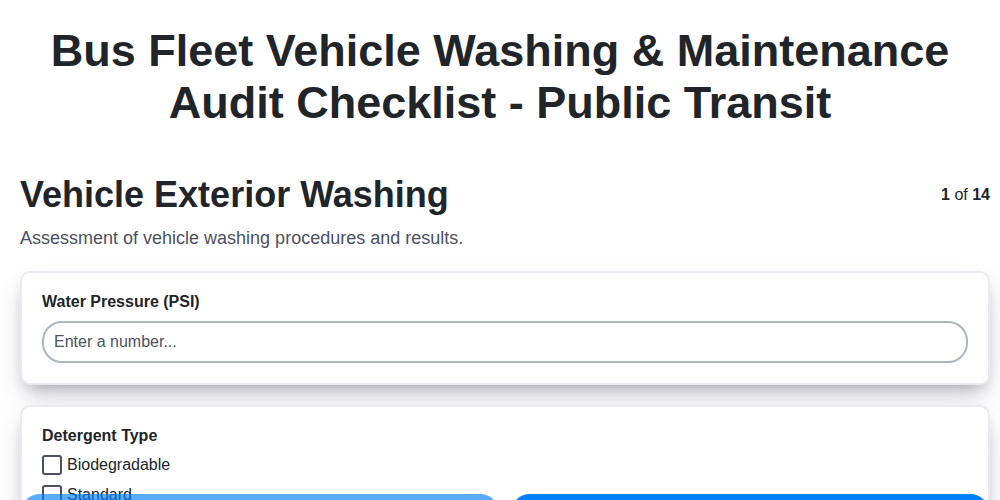
Bus Fleet Vehicle Washing & Maintenance Audit Checklist - Public Transit
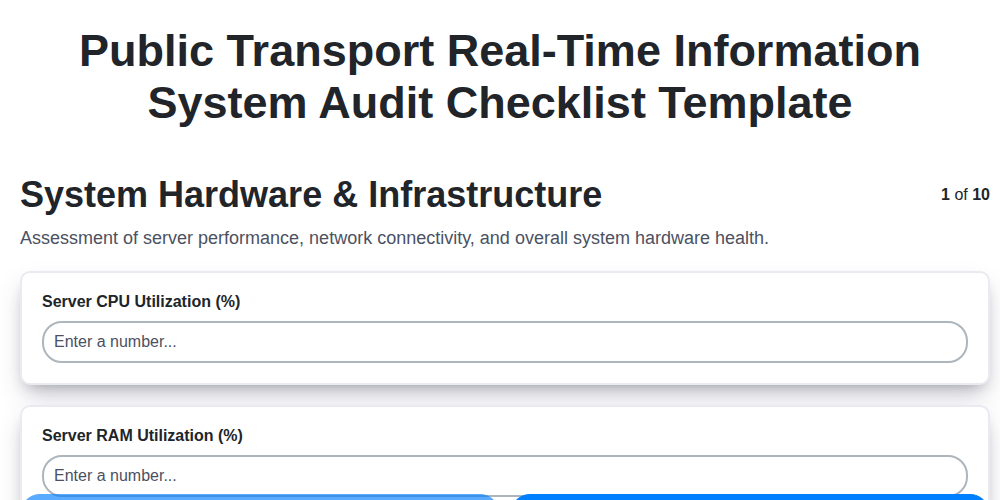
Public Transport Real-Time Information System Audit Checklist Template
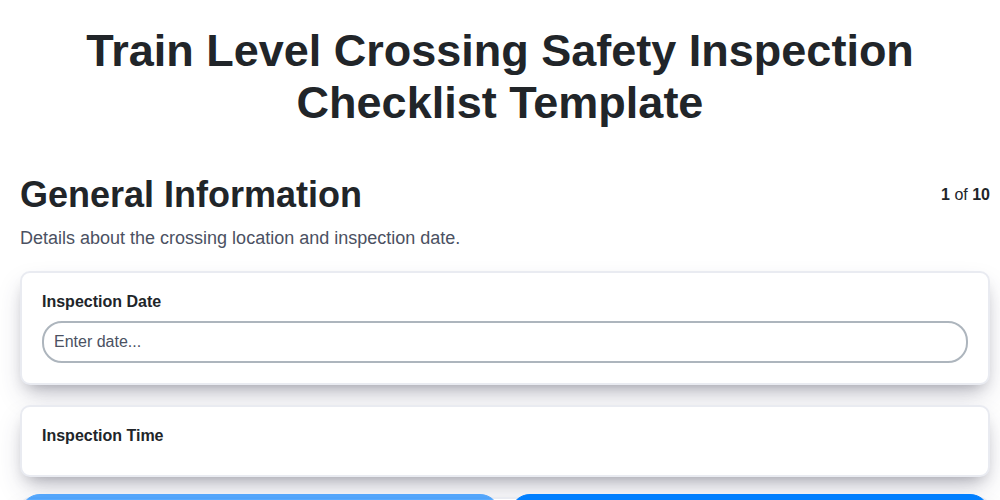
Train Level Crossing Safety Inspection Checklist Template
Need help with
Public Transport Management?
Have a question? We're here to help. Please submit your inquiry, and we'll respond promptly.