 ChecklistGuro
WMS System Performance Monitoring Checklist
Ensure peak warehouse efficiency! Our WMS System Performance Monitoring Checklist helps you proactively identify bottlenecks, optimize workflows, and keep your WMS running smoothly. Download now for faster picking, reduced errors, and a more responsive supply chain.
This Template was installed 1 times.
System Availability & Uptime
Verifies the consistent operation of the WMS and associated infrastructure.
Uptime Percentage (Last 24 Hours)
Last Outage Start Date
Last Outage End Date
Duration of Last Outage
Description of Last Outage (if applicable)
Is System Currently Online?
Number of System Restarts (Last 24 Hours)
Notes on System Stability (e.g., unusual behavior)
Transaction Response Times
Evaluates the speed and efficiency of key WMS processes (e.g., receiving, picking, shipping).
Receiving Time (Seconds)
Putaway Time (Seconds)
Picking Time (Seconds)
Packing Time (Seconds)
Shipping Time (Seconds)
Inventory Lookup Time (Seconds)
Typical Order Processing Time
Database Performance
Checks database query speeds, storage utilization, and overall health.
Average Query Execution Time (ms)
Database Storage Utilization (%)
Number of Active Database Connections
Transaction Log Size (GB)
Recent Slow Query Analysis (if any)
Last Database Maintenance Date
Database Server Version
Interface Performance (Integrations)
Assesses the reliability and speed of data exchange with other systems (ERP, TMS, etc.).
ERP Integration Response Time (seconds)
TMS Integration Response Time (seconds)
ERP Integration Status
TMS Integration Status
Last Successful Data Synchronization (ERP)
Any Recent Integration Errors/Issues?
Integration Error Logs (if applicable)
Synchronization Frequency (minutes)
Resource Utilization (CPU, Memory)
Monitors server resource consumption to identify potential bottlenecks.
Current CPU Utilization (%)
Peak CPU Utilization (Last 24 Hours) (%)
Average Memory Utilization (%)
Free Memory (GB)
Disk Space Utilization (%)
Last Monitoring Timestamp
Notes/Comments on Resource Usage
Error Logs & Alerts
Reviews error logs and confirms proper alert configuration for critical events.
Review Recent Error Log Entries
Number of Errors Detected (Past 24 Hours)
Severity Level of Critical Errors
Date of Last Critical Alert
Time of Last Critical Alert
Alert Channels Configured (e.g., Email, SMS, Dashboard)
Summary of Recent Alert Trends
Scheduled Jobs & Batch Processes
Confirms successful execution and timely completion of scheduled tasks.
Scheduled Job Start Time
Number of Records Processed
Last Successful Run Date
Job Output/Log Summary
Job Status (Success/Failure/Warning)
Error Count
Error Details (if applicable)
User Experience & System Responsiveness
Gathers feedback and evaluates the overall user experience within the WMS.
Average Task Completion Time (seconds)
Overall System Ease of Use
Describe any usability issues encountered
Number of User Support Tickets Related to Usability (last week)
Clarity of On-Screen Instructions
Which areas of the WMS need UI improvements?
Network Performance
Evaluates network latency and bandwidth impacting WMS operations.
Average Network Latency (ms)
Peak Bandwidth Utilization (%)
Packet Loss Rate (%)
Time of Peak Network Utilization
Network Connection Type (Wired/Wireless)
Description of Recent Network Events
Security Audit Trail Review
Examines audit trails for suspicious activity and access violations.
Date of Audit Review
Number of User Access Records Reviewed
Were suspicious login attempts detected?
Details of any suspicious activity found
Were user permissions reviewed?
Explanation/Details regarding user permissions review
Number of privilege escalation events recorded
Frequently Asked Questions
Can I customize this template after installing it?
Absolutely. Once installed, you can add, remove, or reorder tasks, add custom fields, and adjust deadlines to fit your specific workflow.
Can I add images or photos to these checklist items?
Yes. Our platform allows you to attach photos, signatures, and notes to any checklist item for better verification and proof of completion.
Can I create a custom checklist from scratch instead of using a template?
Yes. You can use our "Create your own checklist" feature to build a unique workflow tailored exactly to your operational requirements.
Can I add dependencies between tasks?
Yes, you can set up conditional logic and dependencies to ensure your team follows the correct sequence of operations.
Can I assign specific checklist items to different team members?
Yes. You can assign individual tasks to specific employees, ensuring clear accountability across your entire team.
Can I use these checklists on mobile devices in the field?
Yes. Our platform is fully responsive, allowing your team to complete, update, and upload photos to checklists directly from any smartphone or tablet.
How do I notify my manager when a checklist is completed?
You can set up automated notifications (via email, push notification, or in-app alerts) to trigger whenever a checklist is finished or if an item fails inspection.
Can multiple people work on the same checklist simultaneously?
Yes, the platform supports real-time updates, allowing multiple users to contribute to a single live checklist.
Where is the data from completed checklists stored?
All completed checklists are stored securely in your Work OS dashboard, creating a permanent, searchable audit trail of your operations.
Can I generate reports based on my checklist results?
Yes. You can track completion rates, identify recurring issues, and monitor team performance through our integrated reporting and analytics tools.
How can I use these checklists for compliance or auditing purposes?
Because our checklists capture timestamps, photos, and digital signatures, they serve as a robust digital paper trail for regulatory compliance and internal audits.
Can I export my completed checklist data for use in other tools?
Yes. You can export your data in various formats (CSV, Excel, etc.) to integrate your operational insights with your other business software.
Comments
There are no comments yet. Be the first to add one!
WMS - Warehouse Management System Solution Demo
Optimize your warehouse operations & boost efficiency! ChecklistGuro's WMS streamlines inventory management, order fulfillment, and shipping. Reduce errors, improve accuracy, & maximize space utilization. Manage it all with our Work OS.
Related Checklist Templates
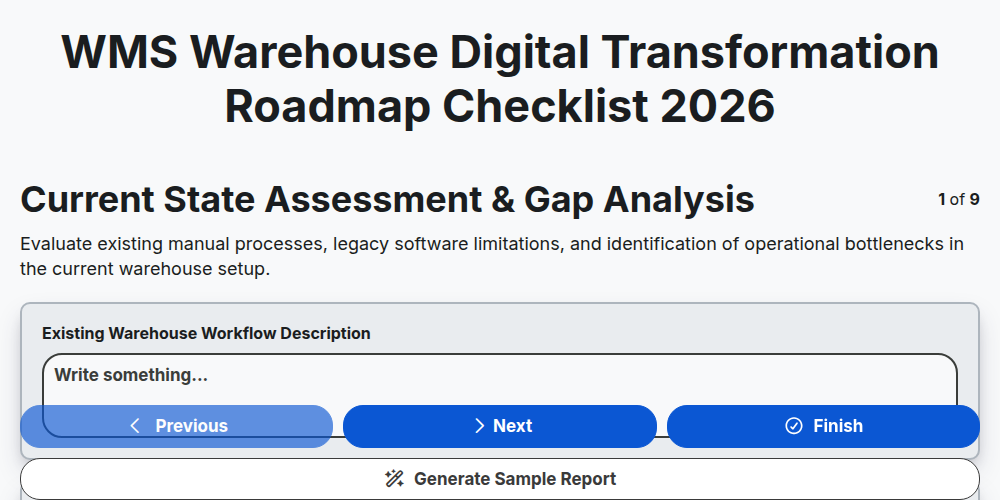
WMS Warehouse Digital Transformation Roadmap Checklist 2026
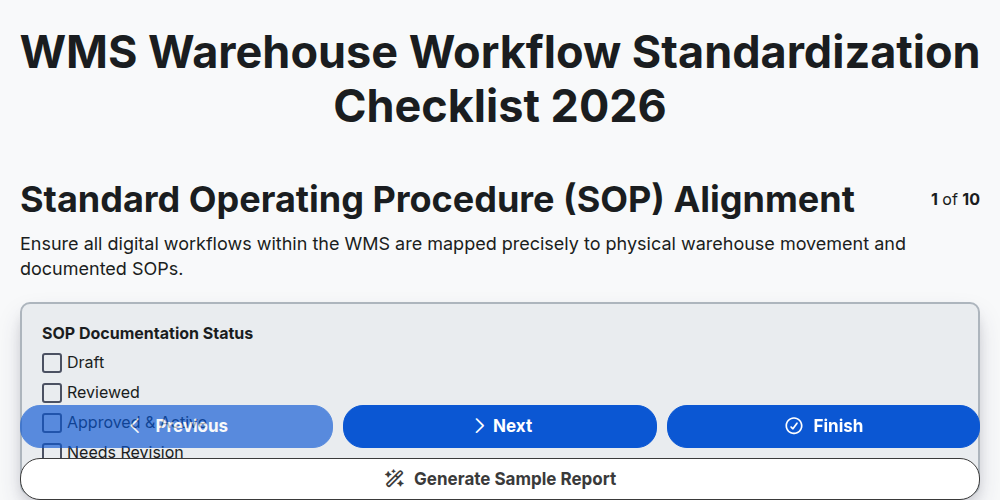
WMS Warehouse Workflow Standardization Checklist 2026
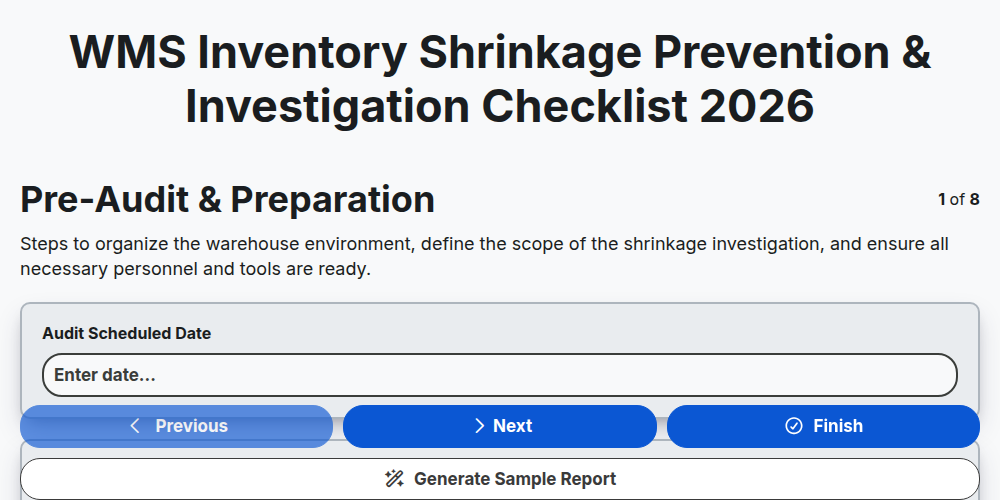
WMS Inventory Shrinkage Prevention & Investigation Checklist 2026
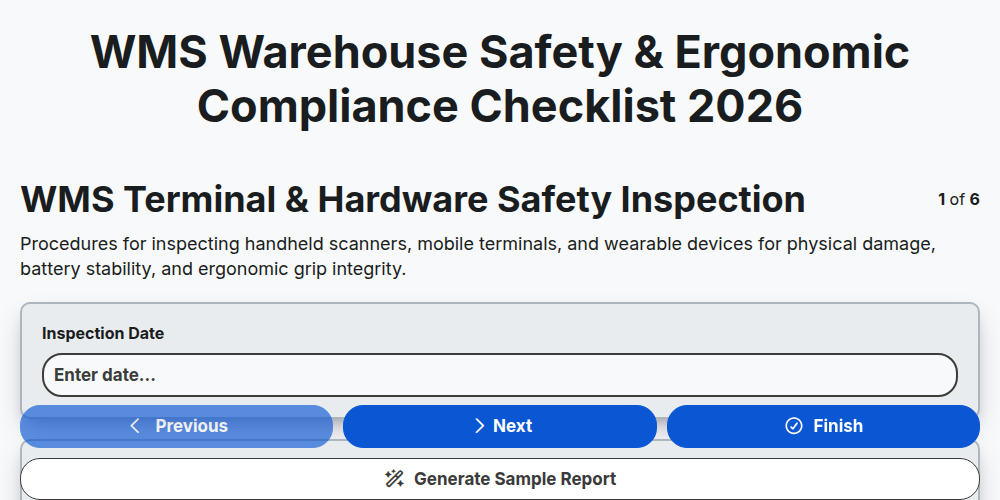
WMS Warehouse Safety & Ergonomic Compliance Checklist 2026
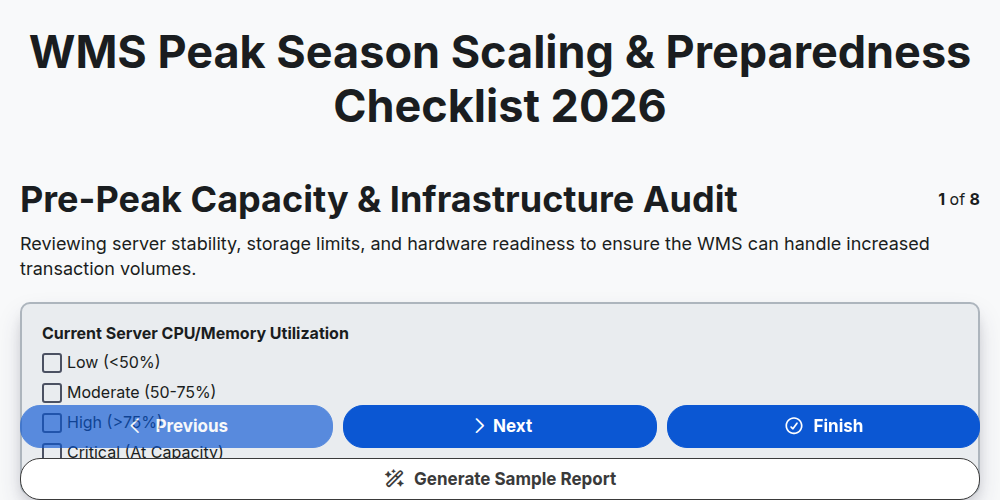
WMS Peak Season Scaling & Preparedness Checklist 2026
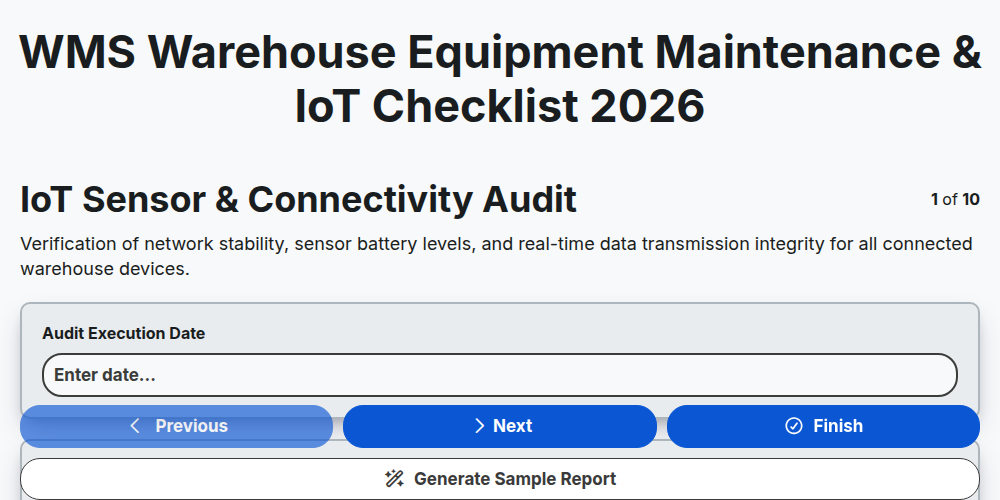
WMS Warehouse Equipment Maintenance & IoT Checklist 2026
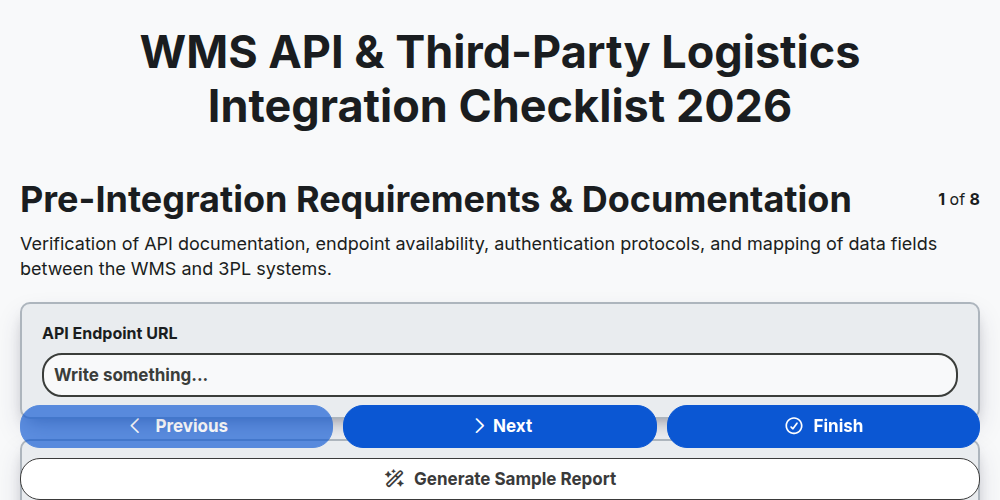
WMS API & Third-Party Logistics Integration Checklist 2026
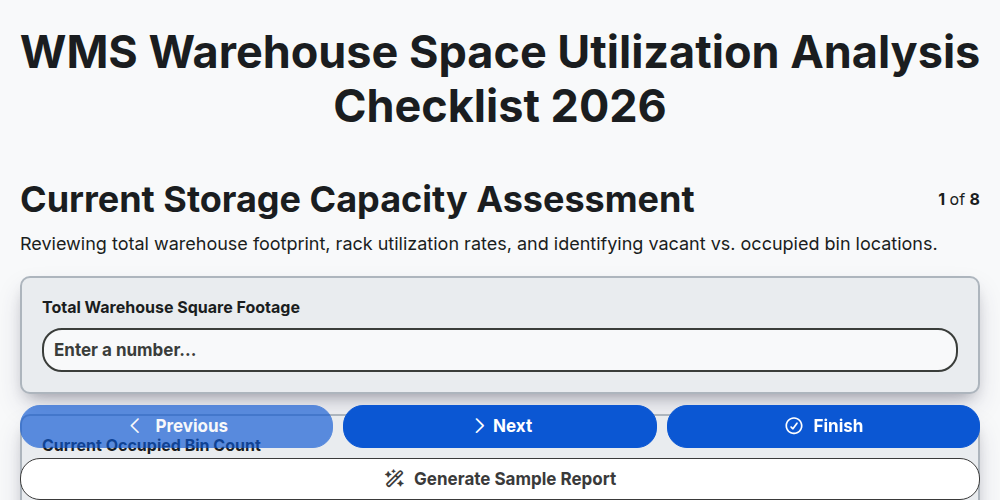
WMS Warehouse Space Utilization Analysis Checklist 2026
Need help with
Warehouse Management System (WMS)?
Have a question? We're here to help. Please submit your inquiry, and we'll respond promptly.