WMS System Performance Monitoring Checklist: A Comprehensive Guide
Published: 12/20/2025 Updated: 12/21/2025
Table of Contents
- Introduction: Why WMS Performance Monitoring Matters
- 1. System Availability & Uptime: Ensuring Continuous Operation
- 2. Transaction Response Times: Keeping Processes Swift
- 3. Database Performance: The Foundation of Your WMS
- 4. Interface Performance (Integrations): Smooth Data Flow
- 5. Resource Utilization (CPU, Memory): Identifying Bottlenecks
- 6. Error Logs & Alerts: Proactive Problem Detection
- 7. Scheduled Jobs & Batch Processes: Monitoring Background Tasks
- 8. User Experience & System Responsiveness: Keeping Users Happy
- 9. Network Performance: Assessing Connectivity
- 10. Security Audit Trail Review: Maintaining Data Integrity
- 11. Performance Thresholds: Defining Acceptable Levels
- 12. Monitoring Tools and Techniques
- Conclusion: Optimizing Your WMS Performance
- Resources & Links
TLDR: Keep your Warehouse Management System (WMS) running smoothly! This checklist provides a step-by-step guide to monitor key areas - from uptime and response times to security and network performance - ensuring efficient warehouse operations and proactive problem detection. Use it regularly to prevent costly downtime and optimize your WMS.
Introduction: Why WMS Performance Monitoring Matters
A Warehouse Management System (WMS) is the central nervous system of your warehouse operations. It manages everything from receiving and putaway to picking, packing, and shipping. When it falters, so does your entire operation. Delays, errors, and inefficiencies ripple through the supply chain, impacting customer satisfaction, increasing costs, and potentially disrupting your business.
Proactive performance monitoring isn't just a nice-to-have; it's a need-to-have for any warehouse relying on a WMS. Reactive troubleshooting after issues arise is costly and time-consuming. A robust monitoring program helps you identify potential problems before they impact users and shipments. This allows for preventative maintenance, optimized configurations, and ultimately, a more efficient and reliable warehouse. This checklist provides a framework to ensure your WMS is operating at peak performance, minimizing disruption and maximizing return on investment.
1. System Availability & Uptime: Ensuring Continuous Operation
A Warehouse Management System (WMS) is the backbone of your warehouse operations. Any downtime can translate directly into lost productivity, order fulfillment delays, and ultimately, dissatisfied customers. This is why meticulous monitoring of system availability and uptime is paramount.
Here's what to check:
- Uptime Percentage: Track the percentage of time the WMS is operational over a defined period (daily, weekly, monthly). Aim for a consistently high percentage (ideally 99.9% or better).
- Downtime Incidents: Document every instance of downtime, noting the start and end times, duration, and root cause. Recurring downtime events require immediate investigation.
- Scheduled Maintenance Windows: Verify that scheduled maintenance windows are clearly defined, communicated, and executed efficiently with minimal disruption.
- Redundancy & Failover: Confirm that redundancy measures (e.g., backup servers, database replication) are functioning correctly and that failover processes are tested regularly. Run failover drills to ensure a smooth transition in case of a primary system failure.
- Automated Monitoring Tools: Implement automated monitoring tools that continuously track system uptime and alert relevant personnel immediately upon detection of any outages.
- Vendor SLAs: Review your WMS vendor's Service Level Agreements (SLAs) to understand their commitment to uptime and the remedies available in case of non-compliance.
2. Transaction Response Times: Keeping Processes Swift
Slow transaction response times are a major pain point in any warehouse, leading to frustrated users, delayed order fulfillment, and potential lost revenue. Monitoring these times isn't just about knowing if things are slow; it's about proactively identifying bottlenecks and ensuring a smooth, efficient workflow.
Here's what to monitor and consider:
- Key Transactions: Identify the most critical transactions in your WMS - receiving, putaway, picking, packing, shipping, inventory adjustments, cycle counts. Focus your monitoring on these first.
- Baseline Establishment: Establish a baseline for acceptable response times for each key transaction. This requires initial observation and data collection during periods of normal operation.
- Regular Measurement: Regularly measure transaction response times (at least daily, if not more frequently) and compare them to your established baseline. Look for trends and deviations.
- Granular Breakdown: Don't just look at overall transaction time. Break it down. Is the delay in the WMS application itself? In the database query? In an integration?
- User Perception: Correlate measured response times with user feedback. What feels slow to your warehouse staff? Their perception is valuable.
- Thresholds and Alerts: Set up thresholds that trigger alerts when response times exceed acceptable levels. This allows for proactive intervention before issues escalate.
- Impact Analysis: When slow response times are observed, investigate the root cause and quantify the impact on warehouse operations. This helps prioritize fixes and justify investments.
By diligently monitoring transaction response times, you can pinpoint and resolve performance bottlenecks, contributing to a faster, more efficient, and more productive warehouse operation.
3. Database Performance: The Foundation of Your WMS
Your Warehouse Management System (WMS) relies heavily on a robust and efficient database. Slow database performance can cripple your entire operation, leading to delays, inaccuracies, and frustrated users. This isn't just about speed; it's about ensuring data integrity and the overall reliability of your WMS.
Here's what to examine regarding your WMS database performance:
- Query Execution Times: Regularly monitor the time it takes to execute common queries. Long query times are a red flag and point to potential indexing issues or inefficient SQL. Utilize database profiling tools to pinpoint the problem queries.
- Index Optimization: Ensure all frequently used columns in queries have appropriate indexes. Missing or poorly designed indexes are a major cause of slow query performance. Regularly review and rebuild indexes as needed.
- Database Size and Growth: Track database size and growth rate. An excessively large database can impact performance. Consider archiving or purging old, irrelevant data.
- Fragmentation: Database fragmentation can slow down data access. Defragment the database regularly according to your database platform's recommendations.
- Resource Allocation: Verify that the database server has adequate resources (CPU, memory, disk I/O) to handle the WMS workload.
- Database Health Checks: Utilize the database management system's built-in health check tools to identify potential issues, such as corrupt data pages or connection leaks.
- Connection Pooling: Ensure proper connection pooling is implemented to minimize the overhead of establishing and closing database connections.
4. Interface Performance (Integrations): Smooth Data Flow
Your Warehouse Management System (WMS) rarely operates in a silo. It likely integrates with your ERP, shipping carriers, marketplaces, and other critical business applications. These integrations are vital for seamless data exchange and operational efficiency, but they're also a common source of performance bottlenecks.
This section of your monitoring checklist focuses on these interfaces. Here's what you need to check:
- Integration Latency: Monitor the time it takes for data to be transmitted between your WMS and integrated systems. High latency can indicate network issues, overloaded APIs, or inefficient data transformations. Set thresholds and proactively alert on deviations.
- Error Rates: Track the frequency of errors occurring during data exchange. These can range from connection failures to data validation issues. Analyze error logs to pinpoint root causes and implement corrective measures.
- Data Integrity Verification: Implement periodic checks to ensure the data being passed between systems is accurate and consistent. Data discrepancies can lead to fulfillment errors, inaccurate reporting, and ultimately, customer dissatisfaction.
- API Endpoint Health: Regularly test the availability and responsiveness of external APIs your WMS relies on. Unexpected downtime or sluggish responses can cripple your warehouse operations.
- Message Queue Monitoring (if applicable): If your WMS utilizes message queues for asynchronous communication, monitor queue lengths and processing times. Build-up in queues signals processing bottlenecks.
- Version Compatibility: Ensure your WMS and integrated systems are running compatible versions of software and APIs. Incompatibilities are a common cause of integration failures.
Regular review of these integration performance metrics will help you identify and resolve issues before they impact your warehouse operations.
5. Resource Utilization (CPU, Memory): Identifying Bottlenecks
Keeping a close eye on your WMS system's resource utilization - specifically CPU and memory - is critical for proactive problem identification and prevention. Unexpected spikes or consistently high usage can signal underlying issues that will eventually impact performance and user experience.
What to Monitor:
- CPU Utilization: Track overall CPU usage across all WMS servers. Sustained high CPU usage (typically above 80%) warrants investigation. Look for patterns; is it consistently high or only during specific times or processes?
- Memory Utilization: Monitor both total memory usage and available memory. Excessive memory usage, leading to frequent swapping, severely impacts performance.
- Page Faults/Swapping: A high number of page faults or excessive swapping indicates the system is struggling to keep data in memory.
- Process-Level CPU & Memory: Dive deeper to identify which specific processes within the WMS are consuming the most resources. This might point to inefficient code, database queries, or poorly optimized integrations.
How to Investigate:
- Baseline Establishment: Establish a baseline for normal CPU and memory usage during peak and off-peak hours. This allows you to easily identify deviations.
- Performance Monitoring Tools: Utilize performance monitoring tools (like Prometheus, Grafana, Datadog, or built-in WMS monitoring) to collect and visualize resource utilization data.
- Code Profiling: For processes consuming significant resources, consider code profiling to pinpoint performance bottlenecks within the application logic.
- Database Query Optimization: Resource-intensive processes often correlate with inefficient database queries. Analyze query execution plans and optimize indexes.
Addressing High Utilization:
- Vertical Scaling: Increase the resources (CPU, RAM) of existing servers.
- Horizontal Scaling: Distribute the workload across multiple servers.
- Code Optimization: Review and optimize inefficient code.
- Configuration Tuning: Adjust WMS configuration parameters to improve performance.
6. Error Logs & Alerts: Proactive Problem Detection
Ignoring error logs and alerts is like driving with your eyes closed. They're your early warning system, providing crucial insights into potential issues before they escalate into full-blown outages or disruptions. A robust WMS system performance monitoring checklist must include a thorough review of these vital components.
Here's what to look for:
- Regular Log Review: Don't just wait for alerts - schedule regular reviews of error logs. Automated tools can help filter and prioritize errors based on severity.
- Alert Thresholds: Ensure alert thresholds are appropriately configured. Too sensitive, and you'll be overwhelmed with false positives. Too lax, and critical issues might slip through. Regularly review and adjust these thresholds.
- Log Correlation: Correlate errors across different logs (application, database, system). A seemingly isolated error in one area might be triggered by an underlying problem elsewhere.
- Error Categorization: Establish a system for categorizing errors - are they frequent, sporadic, application-specific, or database-related? This aids in identifying patterns and root causes.
- Alerting System Integration: Integrate your WMS error logs with a centralized alerting system (e.g., PagerDuty, Slack, email). This ensures the right people are notified immediately.
- Documentation: Document all identified errors, resolutions, and preventative measures. This builds a valuable knowledge base for future troubleshooting.
By prioritizing error log and alert analysis, you move from reactive firefighting to proactive performance management.
7. Scheduled Jobs & Batch Processes: Monitoring Background Tasks
Warehouse Management Systems (WMS) often rely heavily on scheduled jobs and batch processes to handle tasks like inventory reconciliation, report generation, data imports/exports, and order processing. Failures or performance bottlenecks in these background tasks can have a cascading effect, impacting overall system health and potentially causing significant delays.
Here's what to check within your WMS performance monitoring for scheduled jobs and batch processes:
- Job Completion Status: Regularly verify that all scheduled jobs complete successfully and within their expected timeframe. Implement automated checks where possible to flag failures immediately.
- Execution Time Trends: Track the execution time of each job over time. Unexpected increases in duration can indicate underlying issues like data growth, inefficient code, or resource contention.
- Error Handling and Retries: Ensure the system has robust error handling for batch jobs and that appropriate retry mechanisms are in place. Monitor the frequency of retries; excessive retries point to recurring problems.
- Resource Consumption During Batch Jobs: Batch processes can be resource-intensive. Monitor CPU, memory, and disk I/O usage during their execution to identify potential bottlenecks.
- Dependencies and Sequencing: Understand the dependencies between different batch jobs. A failure in one job can often halt subsequent processes. Monitor the overall sequence of operations.
- Logging & Audit Trails: Ensure comprehensive logging for all scheduled jobs, including start and end times, success/failure status, and any errors encountered. These logs are crucial for troubleshooting.
- Deadlock Detection: Batch processes often involve multiple database transactions. Monitor for deadlocks that can halt progress and require manual intervention.
8. User Experience & System Responsiveness: Keeping Users Happy
A powerful WMS is only truly effective if your users want to use it. Slow response times, clunky interfaces, and frustrating workflows will lead to workarounds, decreased productivity, and ultimately, user dissatisfaction. This section of the performance monitoring checklist focuses directly on the user's perspective.
Here's what to look for:
- Task Completion Times: Track how long it takes users to complete common tasks like receiving goods, picking orders, or performing inventory counts. Significant increases in these times indicate performance bottlenecks.
- Page Load Speeds: Measure the time it takes for key screens and reports to load. Anything consistently over 2-3 seconds needs investigation.
- User Feedback: Regularly solicit feedback from warehouse staff. Their anecdotal experiences are invaluable in identifying usability issues that may not be apparent in metrics alone. Conduct short surveys or hold quick feedback sessions.
- Screen Freezing/Hanging: Observe if users frequently experience screens freezing or systems becoming unresponsive. This can point to underlying performance problems.
- Interface Clarity & Navigation: While not strictly a performance issue, poor navigation and confusing interfaces can feel slow and frustrating. Consider occasional usability testing.
- Mobile Device Performance: If your WMS supports mobile devices, ensure performance is adequate on these platforms, accounting for potential network limitations.
Prioritizing user experience is not just about keeping people happy; it's about maximizing the return on your WMS investment.
9. Network Performance: Assessing Connectivity
The Warehouse Management System (WMS) rarely operates in isolation. It relies on a robust network to communicate with various components - barcode scanners, mobile devices, conveyors, shipping systems, and often, external partners. Network performance bottlenecks can manifest as slow response times, dropped connections, and overall system instability, severely impacting warehouse operations.
This checklist item focuses on verifying the health and stability of that network. We're not just looking at overall bandwidth but also latency, packet loss, and connection stability.
Here's what to check:
- Bandwidth Availability: Run bandwidth tests during peak warehouse hours to ensure sufficient capacity to support all connected devices and data transfers. Compare results to documented requirements.
- Latency: Measure latency between the WMS server and key devices (scanners, printers, mobile devices). High latency leads to sluggish performance and user frustration. Tools like
pingand traceroute are invaluable here. - Packet Loss: Significant packet loss indicates network congestion or equipment failure. Use network monitoring tools to identify and address packet loss issues.
- Wireless Signal Strength: For wireless devices, verify signal strength across the warehouse. Weak signals can cause intermittent connectivity and data loss.
- Firewall Performance: Ensure firewall rules aren't unnecessarily restricting WMS traffic and impacting response times.
- Network Device Health: Check the health of routers, switches, and access points. Look for errors, high utilization, or firmware updates required.
- VPN Performance (if applicable): If remote users connect via VPN, assess VPN latency and throughput.
- DNS Resolution: Verify DNS servers are resolving correctly and quickly. Slow DNS resolution can impact all network-dependent operations.
Addressing network performance issues proactively prevents costly downtime and maintains operational efficiency within the warehouse.
10. Security Audit Trail Review: Maintaining Data Integrity
A robust Warehouse Management System (WMS) handles sensitive data - inventory levels, order details, user access, and more. Regular security audit trail reviews are paramount to ensuring data integrity and identifying potential vulnerabilities. This isn't just about compliance; it's about safeguarding your operations.
Here's what a thorough review should encompass:
- User Activity Tracking: Examine logs detailing user logins, logouts, and actions performed within the WMS. Look for unusual activity, such as logins from unfamiliar locations or unauthorized access attempts.
- Data Modification Audits: Focus on records detailing data changes - inventory adjustments, order modifications, user permission changes. Verify that these changes were authorized and legitimate.
- Access Control Reviews: Confirm that user permissions align with job responsibilities and the principle of least privilege. Identify and rectify any overly permissive access rights.
- System Configuration Changes: Audit any modifications made to WMS system configurations, including parameter adjustments and new user additions.
- Integration Logs: Review logs related to integrations with other systems (ERP, shipping platforms) to ensure data flow integrity and identify any unauthorized connection attempts.
- Anomaly Detection: Implement automated anomaly detection tools to flag suspicious patterns in audit trails, enabling proactive investigation.
- Regular Review Frequency: Schedule routine reviews (e.g., weekly, monthly) and document findings. Implement a remediation plan for identified vulnerabilities.
A vigilant approach to audit trail review is a cornerstone of a secure and reliable WMS environment, preventing data breaches, fraud, and operational disruptions.
11. Performance Thresholds: Defining Acceptable Levels
Simply monitoring metrics isn't enough; you need to know what constitutes good performance. This is where defining performance thresholds becomes critical. These thresholds act as your baseline - the levels at which your WMS is expected to operate effectively.
Start by establishing thresholds for each of the metrics you're tracking. For example:
- System Availability & Uptime: 99.9% uptime is a common target.
- Transaction Response Times: Define acceptable ranges for common actions like order entry, picking, and receiving. What's considered "fast enough" for a user to avoid frustration?
- Database Performance: Establish limits for query execution times and overall database load.
- Interface Performance: Set maximum latency and error rates for integrations.
- Resource Utilization: Define acceptable CPU and Memory usage percentages. Anything consistently above 70-80% warrants investigation.
- Error Logs & Alerts: Define which error levels trigger immediate action vs. those that are logged for later analysis.
Dynamic Thresholds are Key: Recognize that acceptable levels might fluctuate based on factors like seasonality, promotions, or system upgrades. Consider implementing dynamic thresholds that automatically adjust based on these conditions.
Collaboration is Essential: These thresholds shouldn't be set in a vacuum. Collaborate with warehouse operations teams, IT, and system administrators to establish realistic and achievable targets that reflect business needs and user experience. Regularly review and adjust these thresholds as your business evolves.
12. Monitoring Tools and Techniques
Effective WMS performance monitoring isn't just about knowing what to check; it's about having the right tools to do it. Fortunately, a wide range of options are available, catering to different budgets and levels of technical expertise.
Built-in WMS Tools: Many WMS vendors offer basic performance monitoring dashboards and reporting features as part of their standard offering. These are a good starting point for understanding high-level trends and identifying immediate issues. However, they may lack the granularity and customization needed for in-depth analysis.
Infrastructure Monitoring Suites: Tools like Datadog, New Relic, Dynatrace, and SolarWinds provide comprehensive infrastructure monitoring capabilities that can be applied to your WMS. These tools excel at collecting metrics across servers, databases, and networks, allowing you to correlate WMS performance with underlying infrastructure health. They often feature alerting capabilities and historical trend analysis.
Database Performance Monitoring (DPM) Tools: Given the critical role of the database, dedicated DPM tools (e.g., QuerySurge, Redgate SQL Monitor) can provide deep insights into query performance, locking, and other database-specific metrics that directly impact WMS responsiveness.
Log Management and Analysis Platforms: Tools like Splunk, ELK Stack (Elasticsearch, Logstash, Kibana), and Sumo Logic are essential for centralizing and analyzing error logs and alerts generated by the WMS and related systems. They help identify root causes of problems that may not be immediately obvious from simple dashboards.
Open-Source Options: For those with limited budgets or a preference for customization, open-source tools like Prometheus, Grafana, and Zabbix offer powerful monitoring capabilities. They often require more technical expertise to set up and maintain but provide a high degree of flexibility.
Choosing the Right Tools: The ideal toolset will depend on your organization's size, technical capabilities, and the complexity of your WMS environment. A layered approach, combining vendor-provided tools with more specialized monitoring solutions, often yields the best results. Remember to consider training requirements and ongoing maintenance when selecting your monitoring stack.
Conclusion: Optimizing Your WMS Performance
Regularly implementing a comprehensive WMS performance monitoring checklist, as outlined above, isn't just about identifying problems; it's about proactively safeguarding your entire supply chain. By consistently tracking key metrics and addressing potential bottlenecks, you ensure your Warehouse Management System operates smoothly, efficiently, and reliably. This proactive approach minimizes disruptions, maximizes throughput, reduces operational costs, and ultimately contributes to a more resilient and competitive business. Don't view this checklist as a one-time task, but as a cornerstone of ongoing WMS optimization - a commitment to continuous improvement and a strategic investment in your warehouse's future.
Resources & Links
- Oracle : Oracle offers a wide range of WMS solutions and resources, including documentation on performance monitoring and optimization within their platforms. Their website provides a starting point for understanding their offerings and related best practices.
- SAP : Similar to Oracle, SAP is a major player in WMS and supply chain management. Their website contains information about SAP's WMS performance and optimization features.
- BluePrism (now part of UiPath) : While focused on RPA, BluePrism (now UiPath) often interacts with WMS systems. Understanding performance of RPA integrations can be a key monitoring area. This site offers resources related to robotic process automation and its impact on system performance.
- ServiceNow : ServiceNow's platform provides IT service management (ITSM) capabilities, which can be extended to monitor WMS performance, especially concerning integrations and incidents. Their website offers information on ITOM and performance management.
- Amazon Web Services (AWS) : If your WMS is hosted in the cloud, AWS provides various monitoring services (CloudWatch, etc.). This link points to AWS's homepage, offering resources related to cloud infrastructure monitoring.
- Microsoft Azure : Similar to AWS, Azure provides cloud-based monitoring services. Useful if your WMS resides on Azure. Homepage offering general cloud services and documentation.
- Dynatrace : Dynatrace is a comprehensive application performance monitoring (APM) platform. Their site contains information about APM best practices and potential WMS monitoring solutions.
- New Relic : New Relic is another popular APM tool used to monitor application performance. Offers insights into transaction times, resource utilization, and other key metrics.
- SolarWinds : SolarWinds offers a suite of IT management and monitoring tools, including options relevant to WMS performance. Focuses on network and infrastructure performance monitoring.
- IBM : IBM offers various enterprise software and consulting services, including potentially relevant WMS solutions. Homepage for navigating IBM's offerings and resources.
- Gartner : Gartner provides research and insights on various technology areas, including supply chain management and WMS. Their site can provide analyst reports and vendor comparisons (often require subscription).
- Smartsheet : While not a WMS vendor, Smartsheet's capabilities for creating checklists and tracking performance data can be applied to implement and manage the monitoring processes outlined in the blog post. Homepage for general project management and task tracking.
- Sumo Logic : Sumo Logic is a cloud-native SIEM and log management platform that provides centralized log collection, analysis, and monitoring capabilities which can be used to manage the Error Logs & Alerts section of the checklist.
Frequently Asked Questions
What is a WMS and why is performance monitoring important?
A Warehouse Management System (WMS) is software that manages and optimizes warehouse operations, including receiving, putaway, picking, packing, and shipping. Performance monitoring is crucial to ensure the WMS is operating efficiently, minimizing errors, maximizing throughput, and identifying areas for improvement. Poor performance can lead to delays, increased costs, and decreased customer satisfaction.
Who should use this checklist?
This checklist is designed for warehouse managers, IT professionals, operations supervisors, and anyone responsible for maintaining and optimizing a WMS system. It's useful for both initial setup and ongoing performance management.
What are the key areas covered in this checklist?
The checklist covers areas such as system resource usage (CPU, memory, disk I/O), database performance, network latency, hardware health, user experience, task completion times, error rates, and reporting accuracy. It also touches on security and data integrity.
What metrics should I be tracking regularly?
Regularly tracking metrics like transaction processing time, picking accuracy rate, putaway cycle time, order fulfillment time, system uptime, server response time, and error counts is vital. Specific metrics will vary based on your warehouse operations and WMS configuration.
How can I identify performance bottlenecks?
Bottlenecks can be identified by analyzing performance data. Look for consistently high resource utilization, slow transaction times, frequent errors, and user complaints about system responsiveness. Profiling tools and database query analysis can help pinpoint specific problem areas.
What's the difference between proactive and reactive performance monitoring?
Proactive monitoring involves continuously tracking metrics and setting up alerts for unusual behavior, allowing you to address issues before they impact operations. Reactive monitoring involves responding to reported problems. This checklist advocates for proactive monitoring.
What role does network latency play in WMS performance?
Network latency, or the delay in data transmission, significantly impacts WMS performance, especially for warehouses with wireless devices or remote locations. High latency can cause slow response times and dropped connections. Testing and optimizing network infrastructure are essential.
How often should I review this checklist?
This checklist should be reviewed at least quarterly, or more frequently if you're experiencing performance issues or making significant changes to your warehouse operations or WMS configuration. Regular reviews ensure ongoing optimization.
What should I do if I consistently find a metric outside of acceptable ranges?
If a metric consistently falls outside of acceptable ranges, investigate the root cause. This might involve examining system configuration, hardware, network infrastructure, or user processes. Consult with your WMS vendor or IT support for assistance.
Are there any automated tools that can help with WMS performance monitoring?
Yes, various performance monitoring tools can automate data collection, analysis, and alerting. These tools can integrate with your WMS and provide real-time insights into system health and performance. Examples include application performance monitoring (APM) platforms and database monitoring tools.
Found this Article helpful?
WMS - Warehouse Management System Solution Demo
Optimize your warehouse operations & boost efficiency! ChecklistGuro's WMS streamlines inventory management, order fulfillment, and shipping. Reduce errors, improve accuracy, & maximize space utilization. Manage it all with our Work OS.
Related Articles

Ensuring Success: Your WMS Automation Validation Checklist Template

Mastering Your Yard: A Warehouse WMS Yard Management Checklist Template
The Ultimate Supply Chain Inventory Accuracy Audit Checklist: A Step-by-Step Guide
Mastering Warehouse Labeling: Your WMS Process Checklist Template
Warehouse WMS Error Handling Checklist: A Proactive Guide to Minimizing Disruptions
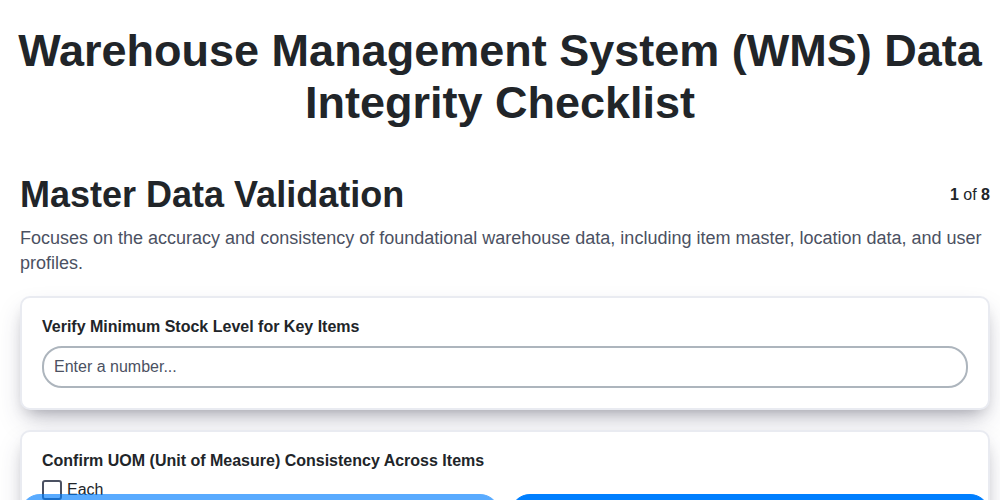
Warehouse Data Integrity: Your WMS Checklist Template
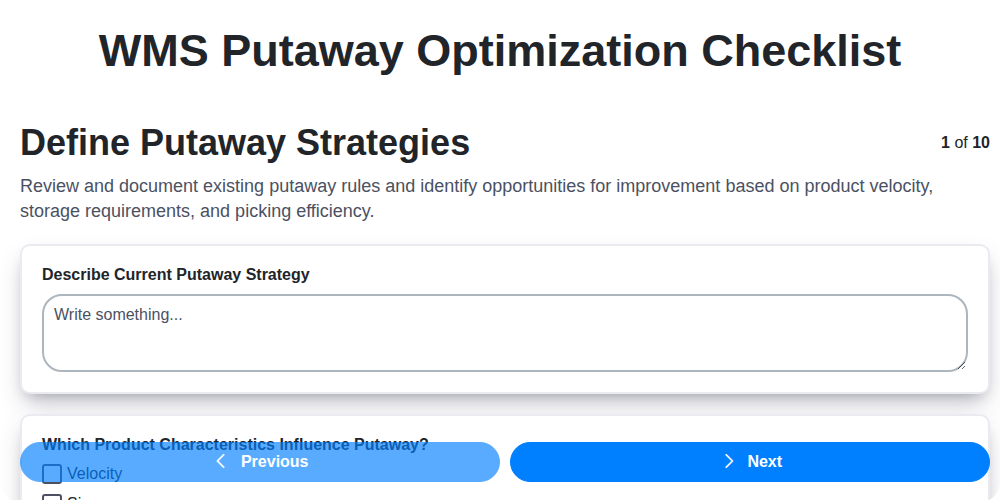
Mastering Putaway: Your WMS Optimization Checklist
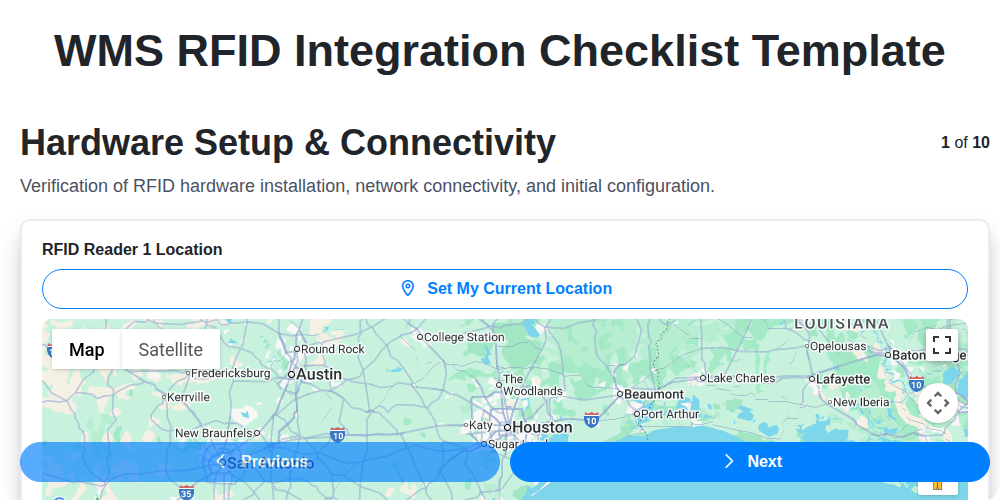
Seamless RFID Integration: Your WMS Checklist Template for Success
We can do it Together
Need help with
Warehouse Management System (WMS)?
Have a question? We're here to help. Please submit your inquiry, and we'll respond promptly.