Energy Demand Forecasting Process: A Step-by-Step Guide to Accurate Load Prediction
Published: 06/18/2026 Updated: 06/19/2026
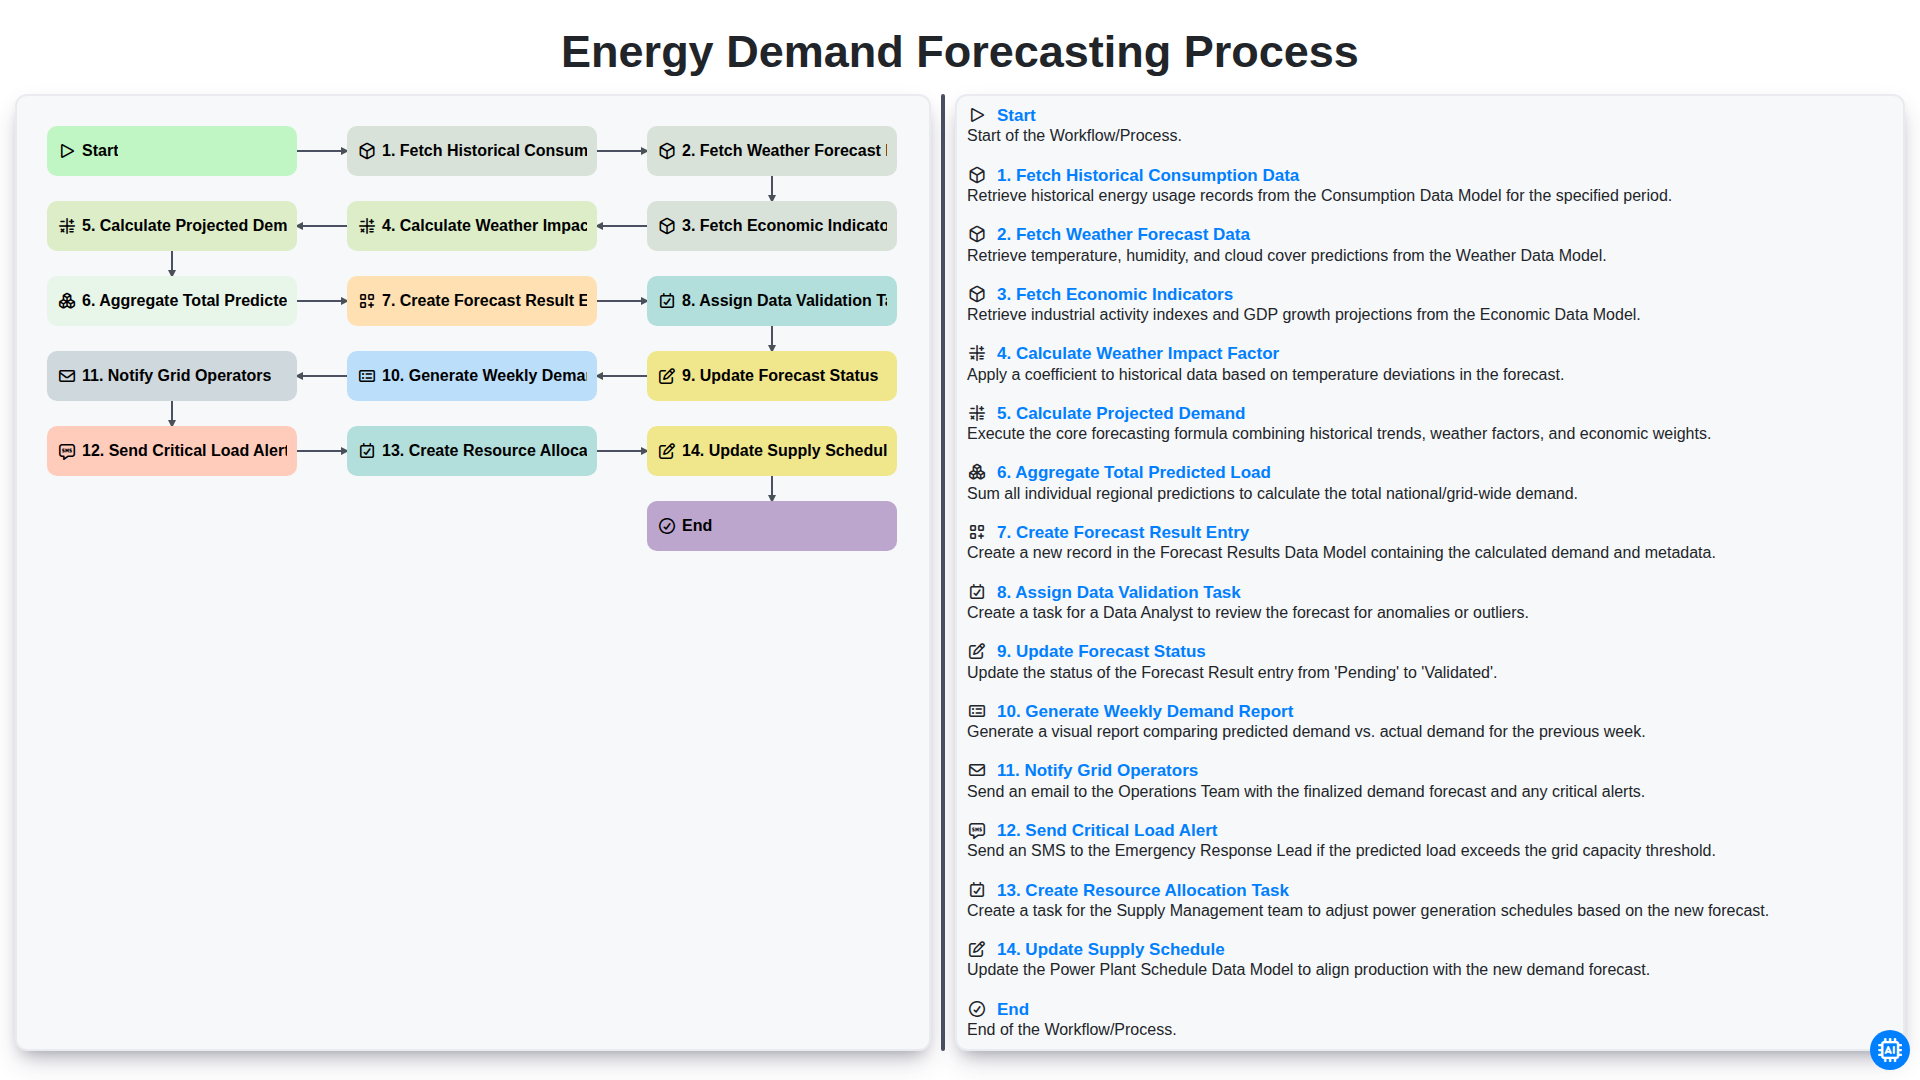
Table of Contents
- Introduction to Energy Demand Forecasting
- Phase 1: Data Acquisition and Integration
- Step 1: Fetching Historical Consumption Data
- Step 2: Integrating Weather Forecast Data
- Step 3: Incorporating Economic Indicators
- Phase 2: Analytical Modeling and Computation
- Step 4: Calculating the Weather Impact Factor
- Step 5: Calculating Projected Demand
- Step 6: Aggregating the Total Predicted Load
- Phase 3: Data Finalization and Validation
- Step 7: Creating Forecast Result Entries
- Step 8: Data Validation and Status Updates
- Phase 4: Reporting and Operational Response
- Step 9: Generating Reports and Alerting Stakeholders
- Step 10: Resource Allocation and Supply Optimization
- Resources & Links
TLDR: This guide explores the automated Energy Demand Forecasting Process, a structured workflow designed to predict power grid requirements. Learn how the system integrates historical consumption, weather forecasts, and economic indicators to calculate load predictions, automate validation, and trigger critical alerts for grid operators to ensure efficient resource allocation and grid stability.
Introduction to Energy Demand Forecasting
In an era of increasing grid volatility and the rapid transition toward renewable energy, the ability to predict power requirements with precision is no longer a luxury-it is a necessity. Energy demand forecasting serves as the analytical backbone of modern grid management, providing the foresight needed to balance supply and demand in real-time. By leveraging historical patterns, meteorological trends, and socio-economic drivers, utility providers can move from a reactive stance to a proactive strategy.
A robust forecasting workflow is much more than a simple mathematical projection; it is a complex, multi-stage ecosystem of data ingestion, algorithmic processing, and automated communication. When executed correctly, this process minimizes the risk of costly overgeneration, prevents catastrophic blackouts, and optimizes the integration of intermittent energy sources like wind and solar. Understanding the systematic progression of this workflow is essential for anyone involved in energy infrastructure, from data scientists to grid operators, as it ensures that every prediction is grounded in validated, actionable intelligence.
Phase 1: Data Acquisition and Integration
The foundation of an accurate energy demand forecast lies in the quality and comprehensiveness of the underlying data. The initial phase of our workflow focuses on gathering a multi-dimensional dataset that captures the various drivers of energy consumption. This process begins with Fetching Historical Consumption Data, where we analyze past usage patterns to identify seasonal trends and baseline behaviors.
However, energy demand does not exist in a vacuum, which is why the integration of external variables is critical. We simultaneously Fetch Weather Forecast Data, as temperature, humidity, and wind speed are primary drivers of heating and cooling loads, and Fetch Economic Indicators, such as industrial activity levels and inflation rates, to account for broader shifts in energy-consuming behaviors. By consolidating these diverse data streams into a unified repository, we create a robust, high-fidelity dataset that serves as the bedrock for all subsequent predictive modeling.
Step 1: Fetching Historical Consumption Data
The foundation of any accurate energy demand forecast lies in the quality and depth of the historical data used for modeling. The first step in our workflow involves retrieving comprehensive historical consumption records, which serve as the baseline for understanding consumption patterns. This process entails extracting time-series data from smart meters, substation sensors, and utility databases, covering various granularities such as hourly, daily, and monthly intervals.
By analyzing past usage, the system can identify cyclical trends, such as seasonal peaks during summer cooling periods or winter heating surges, as well as daily patterns like the duck curve effect. This step is not merely about gathering numbers; it is about ensuring the integrity of the dataset by identifying and addressing any gaps or outliers in previous readings. Without a robust historical baseline, the subsequent predictive models would lack the necessary context to distinguish between a temporary anomaly and a recurring demand trend.
Step 2: Integrating Weather Forecast Data
Once the historical consumption patterns are established, the next critical phase of the workflow is to Fetch Weather Forecast Data. Energy consumption is rarely static; it is heavily influenced by external environmental variables that dictate how much power is needed for heating, cooling, and lighting.
To build a high-fidelity model, the system automatically pulls real-time meteorological data from trusted weather services. This includes integrating variables such as:
- Ambient Temperature: The primary driver for HVAC-related energy spikes.
- Humidity Levels: A key factor in determining the heat index and the subsequent demand for air conditioning.
- Solar Irradiance: Essential for predicting the behavior of solar-dependent loads and potential renewable energy fluctuations.
- Wind Speed: Critical for predicting both wind energy availability and the thermal wind chill effect on heating needs.
By integrating these live forecasts, the workflow moves beyond looking at what happened in the past and begins to account for what is about to happen in the atmosphere. This step ensures that the forecasting model is not just reactive, but predictive, allowing for a much more precise calculation of the upcoming energy load.
Step 3: Incorporating Economic Indicators
While weather patterns and historical trends provide the fundamental baseline for energy forecasting, they do not account for the underlying drivers of human activity. To achieve a truly high-fidelity model, we must Fetch Economic Indicators.
Energy consumption is not an isolated phenomenon; it is deeply intertwined with the economic vitality of a region. By integrating macroeconomic data points-such as industrial production indices, manufacturing output, and even consumer spending trends-the forecasting engine can account for shifts in demand that weather alone cannot predict. For example, a sudden surge in industrial manufacturing activity will drive up electricity demand regardless of the temperature. By incorporating these indicators, the workflow moves beyond simple pattern recognition and begins to understand the economic forces that shape the energy landscape, allowing for a more proactive and structurally sound prediction model.
Phase 2: Analytical Modeling and Computation
Once the essential datasets-historical consumption, weather forecasts, and economic indicators-have been successfully ingested, the workflow moves into its most critical stage: Analytical Modeling and Computation. This phase transforms raw, disparate data points into actionable intelligence through a series of precise mathematical operations.
The process begins with the calculation of the Weather Impact Factor. In this step, the system analyzes the relationship between meteorological variables (such as temperature, humidity, and wind speed) and historical load fluctuations. By quantifying how specific weather shifts influence energy usage, the model can predict how upcoming heatwaves or cold fronts will deviate the baseline demand.
Following this, the engine performs the Calculation of Projected Demand. This involves layering the weather impact factors onto the historical trends and economic drivers to simulate future usage patterns. Once these individual projections are computed, the system executes the Aggregation of Total Predicted Load, merging all processed variables into a unified, high-fidelity demand estimate.
The final output of this phase is the generation of a Forecast Result Entry, a structured data record that serves as the single source of truth for all subsequent automated downstream actions. At this point, the raw numbers have been transformed into a reliable, computed forecast ready for validation and operational deployment.
Step 4: Calculating the Weather Impact Factor
Once the historical consumption, weather forecasts, and economic indicators have been gathered, the next critical phase is determining how environmental variables will influence energy usage. The Calculation of the Weather Impact Factor serves as the analytical bridge between raw meteorological data and actual energy demand.
In this step, the system applies complex algorithms to correlate historical temperature, humidity, wind speed, and solar radiation levels with past fluctuations in energy consumption. For instance, the model evaluates how a specific rise in temperature correlates to increased air conditioning usage (cooling degree days) or how a sudden drop in temperature drives heating demand (heating degree days). By quantifying these correlations, the system generates a specific multiplier-the Impact Factor-that adjusts the baseline demand according to the upcoming weather patterns. This ensures that the forecast is not just a reflection of past trends, but a dynamic projection that accounts for the real-world volatility of the elements.
Step 5: Calculating Projected Demand
Once the weather impact factors have been determined, the workflow moves into the core computational phase: Calculating Projected Demand. This is the stage where raw data and environmental variables are transformed into actionable intelligence.
In this step, the system integrates the historical consumption patterns with the newly calculated weather impact factors. The algorithm applies mathematical models-such as regression analysis or machine learning architectures-to adjust the baseline historical load by the predicted temperature, humidity, and wind speed fluctuations. For example, if the weather impact factor indicates an upcoming heatwave, the calculation logic will mathematically scale the baseline load to account for the surge in air conditioning usage. This precise calculation ensures that the forecast is not merely a reflection of the past, but a proactive adaptation to upcoming environmental shifts.
Step 6: Aggregating the Total Predicted Load
Once the individual demand projections have been calculated-accounting for both historical trends and real-time environmental variables-the next critical phase is the aggregation of the total predicted load. This step involves consolidating all disparate data points into a single, unified load profile.
Aggregation is more than just a simple summation; it is the process of merging various localized or segmented forecasts into a holistic view of the entire network's requirements. By summing the projected demand from all monitored sectors, the system produces a comprehensive macro-level forecast. This unified figure serves as the single source of truth for the entire grid management system, providing the foundational metric needed to drive all subsequent decision-making, from resource scheduling to risk mitigation. Without an accurate aggregation, the transition from raw data processing to actionable operational intelligence would be impossible.
Phase 3: Data Finalization and Validation
Once the raw datasets have been processed and the projected demand has been aggregated, the workflow moves into the critical stage of ensuring data integrity and operational readiness. This phase is not merely about closing the calculation loop, but about transforming raw numbers into actionable, high-confidence intelligence.
The process begins with the creation of the Forecast Result Entry, where the aggregated load predictions are formally logged into the central database. However, to prevent errors from cascading into the grid management system, an automated Data Validation Task is assigned. This step subjects the newly generated figures to rigorous quality checks, comparing the current projections against historical patterns and error margins to identify any statistical anomalies.
Simultaneously, the system initiates a status update, transitioning the Forecast Status from Processing to Validated or Pending Review. This ensures that all stakeholders are working with a single, verified source of truth. By implementing this rigorous validation layer, the workflow ensures that the subsequent distribution of information is based on reliable, high-fidelity data, minimizing the risk of operational errors in the power grid.
Step 7: Creating Forecast Result Entries
Once the complex calculations for projected demand and total predicted load are finalized, the workflow moves into the critical phase of data persistence. In this step, the system automatically generates a Forecast Result Entry within the centralized database.
This entry serves as the single source of truth for the entire grid management ecosystem. Rather than just being a standalone number, this entry encapsulates the processed datasets, the specific timeframes covered, and the calculated load predictions in a structured format. By creating a formal entry, the system ensures that all subsequent automated processes-such as validation, reporting, and alerting-have a consistent and traceable data point to reference. This step transforms raw computational output into a permanent, auditable record that forms the foundation for all downstream operational decisions.
Step 8: Data Validation and Status Updates
Once the initial forecast results are generated, the workflow transitions from raw computation to quality assurance. This phase is critical to ensure that the predicted load is both accurate and actionable. The process begins with Assigning a Data Validation Task, where a dedicated validation step is triggered to cross-reference the newly created forecast entry against historical patterns and error margins. This serves as a vital safeguard against anomalies or sensor errors that may have entered the system during the data fetching stage.
Following the validation check, the system automatically moves to Update Forecast Status. Depending on the outcome of the validation, the forecast is marked as either Verified or Flagged for Review. This status update ensures that downstream processes-such as grid management and resource planning-only act upon high-confidence data, maintaining the overall integrity of the energy management ecosystem.
Phase 4: Reporting and Operational Response
Once the forecasting calculations are complete, the process transitions from data processing to actionable intelligence. This final phase is critical, as the value of a forecast lies not just in its accuracy, but in how effectively that information is communicated to the stakeholders responsible for grid stability.
The workflow follows a structured sequence to ensure that the predicted demand translates into real-world preparedness:
- Automated Documentation: The system begins by creating a Forecast Result Entry to serve as a permanent record of the prediction. To ensure the integrity of these numbers, a Data Validation Task is automatically assigned, allowing engineers to verify that the output aligns with historical patterns and current sensor readings.
- Status Management: Once verified, the system performs an Update Forecast Status to reflect that the data is Live and ready for use by the operations team.
- Insight Distribution: To maintain high-level visibility, the system will Generate a Weekly Demand Report, providing a longitudinal view of trends, while simultaneously performing real-time communication by Notifying Grid Operators of the immediate upcoming load.
- Emergency Protocols: In scenarios where the forecast detects anomalies, the workflow triggers a Send Critical Load Alert, ensuring that sudden surges or drops in demand are met with immediate human intervention.
- Resource Orchestration: The final, most vital step is turning foresight into action. The system will Create a Resource Allocation Task to prepare backup generation or demand-response programs and Update the Supply Schedule, ensuring that power generation is precisely synchronized with the predicted load to maintain a perfect balance between supply and demand.
Step 9: Generating Reports and Alerting Stakeholders
Once the forecast has been validated and the data entries are finalized, the workflow transitions from data processing to actionable intelligence. This phase is critical because a forecast is only as valuable as the speed and clarity with which it is communicated to those managing the grid.
The process begins with the generation of the Weekly Demand Report, which synthesizes the complex datasets into a digestible format for long-term planning. This report provides a high-level view of expected trends, allowing for strategic oversight of upcoming energy requirements.
However, real-time responsiveness is equally vital. To ensure immediate operational readiness, the system automatically triggers two distinct notification streams:
- Grid Operator Notification: An automated briefing is sent to the control center, ensuring that personnel are aware of the upcoming load profiles and can prepare for any anticipated surges.
- Critical Load Alert: In instances where the projected demand approaches predefined threshold limits, a high-priority alert is dispatched. This serves as an early warning system to prevent grid instability and initiate emergency protocols.
By automating these communication loops, the workflow ensures that the transition from data insight to operational action happens instantaneously, minimizing the risk of human error and reducing response latency during periods of high volatility.
Step 10: Resource Allocation and Supply Optimization
Once the predictive models have finalized the forecast, the workflow transitions from data processing to operational execution. This stage is where the analytical insights are transformed into actionable utility management strategies. The primary goal is to ensure that the predicted load is met with the most efficient and cost-effective energy mix available.
During this phase, the system automatically triggers the Create Resource Allocation Task step, which cross-references the predicted demand with your current power generation capacities. This involves determining the necessary ramp-up of fast-acting peaking plants versus the steady-state output of baseload providers. Simultaneously, the system proceeds to Update Supply Schedule, adjusting the dispatch instructions for various energy assets-including renewables, hydro, and thermal plants-to match the anticipated load curves. By automating this integration, the workflow minimizes the risk of human error in manual scheduling and ensures that supply levels are optimized to prevent both energy shortages and costly over-generation.
Resources & Links
- International Energy Agency (IEA): Access global energy statistics, demand analysis, and long-term energy outlooks to understand the macro-economic drivers of energy consumption.
- National Oceanic and Atmospheric Administration (NOAA): A vital resource for retrieving historical weather patterns and high-resolution weather forecast data used for calculating weather impact factors.
- The World Bank DataBank: Explore comprehensive economic indicators, including GDP growth and industrial production indices, which serve as key inputs for demand forecasting models.
- ScienceDirect: A database for accessing peer-reviewed research papers on advanced machine learning algorithms and mathematical modeling used in load prediction.
- Python Software Foundation: The primary programming language resource for implementing data integration, automated data validation, and predictive analytics workflows.
- Pandas Documentation: Essential documentation for handling time-series data, aggregating predicted loads, and managing large datasets during the forecasting process.
- Tableau: Advanced visualization tools used for generating weekly demand reports and creating intuitive dashboards for grid operators and stakeholders.
Found this Article helpful?
Energy Management Solution Demo
Managing operations, safety, and compliance in the energy sector is critical. ChecklistGuro's Work OS platform streamlines your workflow from exploration and production to distribution and maintenance. Enhance safety, improve efficiency, and ensure regulatory adherence. Discover how ChecklistGuro can transform your energy business!
Related Articles
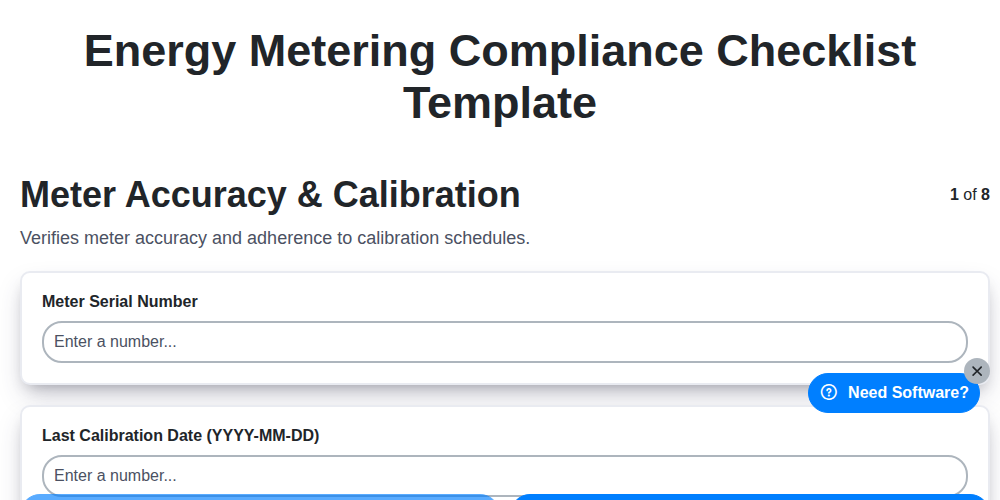
Stay Compliant: Your Energy Metering Compliance Checklist Template
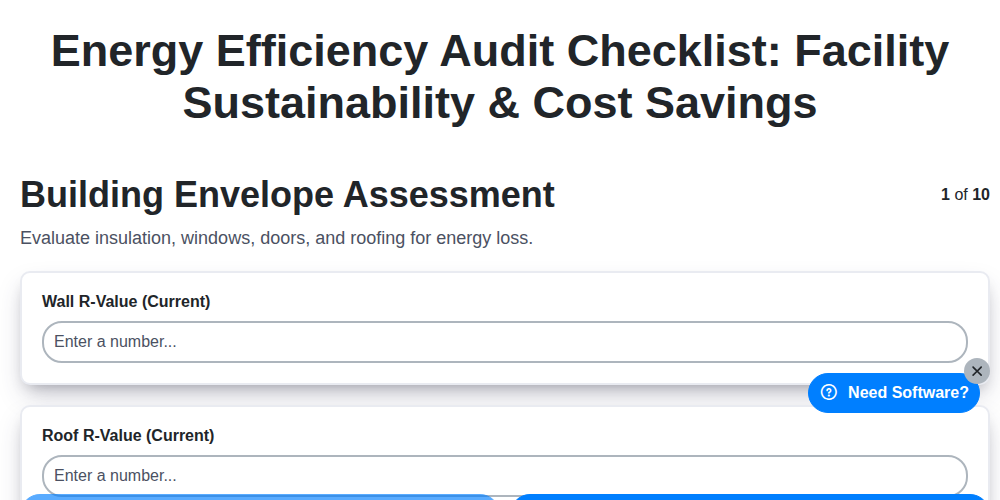
Unlock Savings: Your Complete Energy Efficiency Audit Checklist
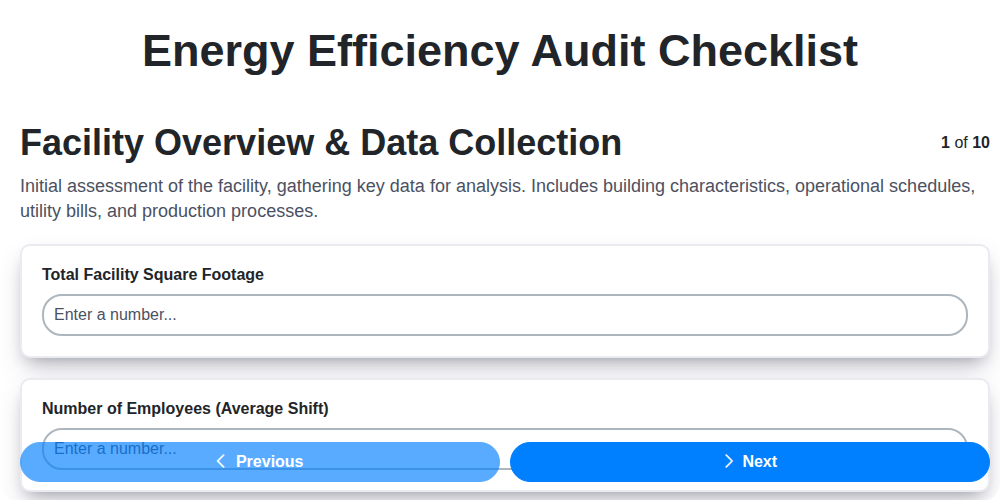
Your Ultimate Energy Efficiency Audit Checklist Template
Power Through: Your Essential Energy Grid Outage Support Checklist
Oil & Gas Well Safety Inspection Checklist: Ensuring a Secure Operation
HVAC System Maintenance Checklist: Building Climate Control & Energy Savings
Renewable Energy Project Checklist Template
Energy Audit Reporting Compliance: Your Checklist for Success
We can do it Together
Need help with
Checklists?
Have a question? We're here to help. Please submit your inquiry, and we'll respond promptly.