Mastering Safety Stock: Your MRP Calculation Checklist
Published: 12/14/2025 Updated: 12/15/2025
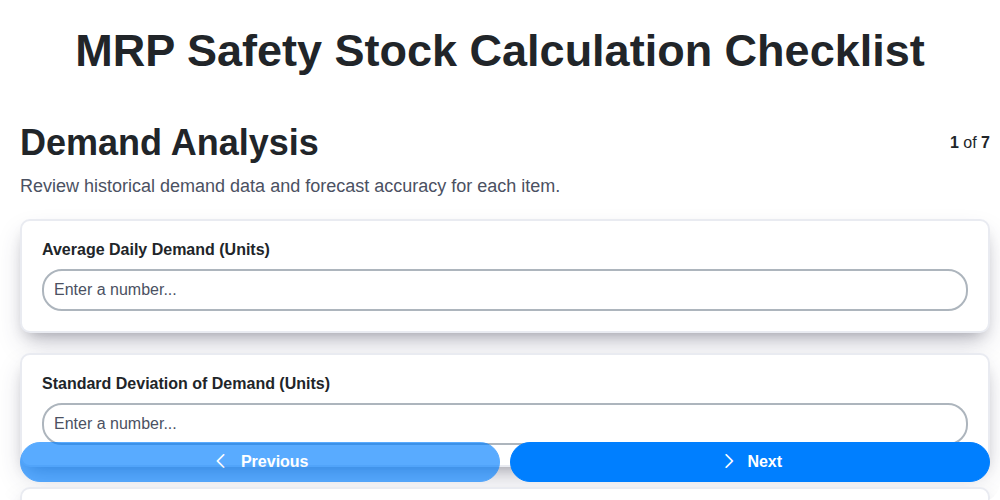
Table of Contents
- Introduction: Why Safety Stock Matters
- 1. Demand Analysis: Laying the Foundation
- 2. Understanding Historical Demand Data
- 3. Identifying Demand Patterns and Trends
- 4. Lead Time Assessment: Mapping the Supply Chain
- 5. Defining Service Level Goals: Balancing Cost and Risk
- 6. Safety Stock Formula Selection: Choosing the Right Approach
- 7. Parameter Calculation: Crunching the Numbers
- 8. Considering Variability: Demand and Lead Time
- 9. Review and Adjustment: Fine-Tuning Your Calculations
- 10. System Implementation: Integrating Safety Stock into Your MRP
- 11. Monitoring and Performance Evaluation
- 12. Continuous Improvement: Adapting to Change
- Conclusion: Maintaining Optimal Safety Stock Levels
- Resources & Links
TLDR: Feeling overwhelmed by safety stock calculations? This checklist breaks down the process into 8 manageable steps - from analyzing demand and lead times to implementing and monitoring your system. It's your guide to preventing stockouts and minimizing excess inventory, ultimately boosting your MRP efficiency!
Introduction: Why Safety Stock Matters
In the world of Materials Requirements Planning (MRP), ensuring a consistent supply of materials is paramount. Disruptions - unexpected surges in demand, supplier delays, manufacturing hiccups - can quickly lead to production bottlenecks, missed deadlines, and ultimately, dissatisfied customers. This is where safety stock comes into play.
Safety stock acts as a buffer, a cushion against these uncertainties. It's the extra inventory you keep on hand to prevent stockouts, ensuring you can meet demand even when things don't go as planned. Properly calculated safety stock doesn't just avoid costly delays; it also optimizes your inventory investment. Too little, and you risk stockouts; too much, and you're tying up valuable capital.
This checklist guides you through a robust process for calculating your MRP safety stock, helping you strike that critical balance and build a more resilient supply chain. Let's dive in!
1. Demand Analysis: Laying the Foundation
Accurate safety stock calculations hinge on a thorough understanding of your demand patterns. It's not enough to just look at historical sales; you need to dig deeper. This stage is about uncovering the why behind the numbers.
Here's what to consider:
- Gather Historical Data: Collect at least 12-24 months of sales data for each item. Longer is generally better, especially for items with seasonal fluctuations.
- Identify Trends & Seasonality: Are there predictable spikes or dips in demand? Seasonality often requires significantly higher safety stock to buffer against peak periods. Look for patterns tied to holidays, weather, promotions, or other external factors.
- Analyze Demand Variability: Calculate metrics like the Coefficient of Variation (CV) - a ratio of standard deviation to the average demand. Higher CV indicates greater demand variability and, consequently, a need for higher safety stock.
- Consider External Factors: Market trends, competitor actions, economic conditions, and even geopolitical events can impact demand. Try to anticipate and factor in these external influences.
- Segment Your Products: Not all products are created equal. Classify your inventory (e.g., ABC analysis) based on demand volume and profitability. Items with higher demand variability and higher value require more attention and potentially higher safety stock levels.
A solid demand analysis provides the critical foundation upon which your entire safety stock calculation will be built. Skimp on this step, and your safety stock will likely be inaccurate, leading to either stockouts or excess inventory.
2. Understanding Historical Demand Data
Accurate safety stock calculations hinge on a solid foundation of historical demand data. Simply put, you can't predict future needs without understanding past patterns. But 'historical data' isn't just about having numbers; it's about interpreting them.
Here's what to consider when analyzing your demand history:
- Data Collection Period: A longer data history (ideally 2-3 years) provides a more robust baseline, accounting for seasonal variations and long-term trends. Shorter periods can be useful for newer products, but be cautious about extrapolating from limited data.
- Data Granularity: Decide on the appropriate level of detail. Daily data offers the most precision for volatile products, while weekly or monthly data might suffice for more stable items.
- Identify Trends: Look for upward or downward trends in demand. Is a product becoming more or less popular? Adjust forecasts accordingly.
- Recognize Seasonality: Many products experience predictable peaks and troughs throughout the year. Extract this seasonality from your data - for example, using moving averages or decomposition techniques.
- Spot Outliers: Identify unusual spikes or dips in demand. Determine the cause - was it a promotion, a supply disruption, or a one-off event? These outliers shouldn't significantly impact your baseline calculation. Consider removing or smoothing them if they represent abnormal events that won't repeat.
- Data Accuracy & Cleansing: Ensure your data is accurate. Errors in historical records will lead to flawed safety stock calculations. Identify and correct any errors or inconsistencies.
- Consider External Factors: Think about factors outside your direct sales data that might influence demand, such as economic conditions, competitor actions, or marketing campaigns.
3. Identifying Demand Patterns and Trends
Understanding your demand is the bedrock of any effective safety stock calculation. Simply put, you can't accurately buffer against something you don't understand. This isn't just about looking at past sales; it's about identifying patterns and trends.
Begin by gathering historical sales data, ideally spanning at least 12 months - longer is better. Then, visually inspect the data for seasonality. Do sales spike during the holiday season or decline during the summer? Next, look for trends - are sales generally increasing, decreasing, or staying relatively flat?
Beyond the obvious, dig deeper. Are there promotional impacts? Do external factors like economic conditions or competitor actions influence demand? Tools like moving averages and exponential smoothing can help smooth out noise and highlight underlying trends. Segmenting your products - by product line, customer type, or region - can reveal demand patterns that would otherwise be masked by aggregation. Finally, consider forecasting methods - even a simple forecast can provide valuable insight into future demand and inform your safety stock calculations. Remember, the more accurate your demand analysis, the more effective your safety stock will be.
4. Lead Time Assessment: Mapping the Supply Chain
Understanding your lead time is absolutely critical for accurate safety stock calculations. It's more than just the time it takes to receive an order - it's a comprehensive assessment of the entire supply chain journey.
Start by meticulously mapping your supply chain, identifying every step from raw material sourcing to product delivery to your customer. This includes supplier lead times, internal processing times (manufacturing, inspection, packaging), transportation times, and any potential delays at each stage.
Don't just rely on averages; investigate the variability in each component. A supplier might typically deliver in 5 days, but what's the range? Are there seasonal fluctuations, potential for disruptions (weather, strikes, etc.), or quality issues that can impact lead time?
Consider these methods for accurate lead time assessment:
- Historical Data Analysis: Review past orders and deliveries. This provides a realistic picture of actual lead times, not just supplier promises.
- Supplier Communication: Directly engage with your suppliers to understand their processes and potential bottlenecks.
- Process Mapping: Create visual diagrams of each step in the process to identify areas for improvement and potential delays.
- Worst-Case Scenario Planning: Consider the longest lead time you're likely to experience, even if it's rare. This helps prepare for unexpected events.
Finally, remember to regularly update your lead time data. Supply chains are dynamic, and what was true last year might not be true today. Accurate lead time data is the foundation for an effective safety stock strategy.
5. Defining Service Level Goals: Balancing Cost and Risk
Setting the right service level is a critical balancing act. It dictates how much safety stock you're holding, and directly impacts both customer satisfaction and inventory costs. A high service level (e.g., 99.9%) means you're aiming to meet nearly all demand instantly, minimizing stockouts and maximizing customer loyalty. However, this comes at a price - higher inventory holding costs, potential for obsolescence, and tied-up capital. Conversely, a lower service level (e.g., 90%) reduces those costs but increases the risk of stockouts and potentially unhappy customers.
How do you decide? There's no one-size-fits-all answer. Consider these factors:
- Product Importance: Critical items with significant impact on production or customer experience should have higher service levels.
- Lead Time: Longer lead times generally require higher service levels to buffer against uncertainty.
- Cost of Stockout: Quantify the cost of a stockout. This includes lost sales, expedited shipping, production downtime, and potential damage to customer relationships. A high cost justifies a higher service level.
- Competitive Landscape: What service levels are your competitors offering?
- Customer Expectations: Understand your customers' expectations regarding product availability.
Start by setting realistic goals. Often, a service level between 92% and 98% provides a good balance for many products. Remember to document your rationale for each service level; this helps with future adjustments and aligns everyone on the strategy. Don't be afraid to start with a conservative target and refine it as you gather more data and experience.
6. Safety Stock Formula Selection: Choosing the Right Approach
Choosing the right safety stock formula is crucial for balancing inventory costs and customer service. There's no one-size-fits-all solution; the best formula depends on your data availability, demand variability, and lead time stability. Here's a breakdown of common approaches, from simple to more complex:
Simple Average Method: This is the easiest, but least accurate. It uses the average demand during the lead time as a buffer. Suitable for very stable demand and short lead times.
Basic Statistical Formula (Standard Deviation-Based): This is a widely used starting point. It considers the standard deviation of demand and the lead time. The formula typically looks like:
Safety Stock = Z * Standard Deviation of Demand During Lead Time. The 'Z' factor represents your desired service level (explained in step 3).Lead Time Demand Variation Formula: This focuses solely on the variation in lead time demand. Useful when demand itself is relatively stable. Formula:
Safety Stock = Z * Standard Deviation of Lead Time Demand.Service Level Dependent Formula: More sophisticated formulas directly incorporate your desired service level into the calculation. These often consider both demand and lead time variability.
Time-Based Safety Stock: Useful for products with seasonal demand. This method involves calculating safety stock based on historical data segmented by time periods.
Simulation-Based Safety Stock: The most complex option, often requiring specialized software. It uses historical data to simulate demand patterns and determines the safety stock level needed to achieve the target service level.
When selecting a formula, prioritize formulas that accurately reflect your specific situation and data. Don't hesitate to start with a simpler formula and iterate as you gather more data and refine your understanding of your supply chain.
7. Parameter Calculation: Crunching the Numbers
This is where the rubber meets the road. You've laid the groundwork with thorough demand analysis, lead time assessment, and service level definition. Now it's time to actually calculate the safety stock quantity. The specific formula you chose in the previous step dictates the data you'll need and the calculations involved. Let's break down common parameters and what they mean:
- Mean Demand: Often pulled directly from your demand analysis. It's the average demand over a defined period.
- Standard Deviation of Demand: This measures the variability of demand. A higher standard deviation indicates greater unpredictability.
- Lead Time: The time it takes to receive an order from your supplier. You're using the lead time assessment you performed earlier.
- Service Factor (Z-Score): Derived from your desired service level. Consult a Z-table (easily found online) to find the corresponding Z-score for your target service level. For example, a 95% service level equates to a Z-score of approximately 1.645.
- Lead Time Demand: This is often calculated as the mean lead time multiplied by the mean demand.
Applying the Formula: Let's illustrate with a simple example using the most common formula:
Safety Stock = Z-score * Standard Deviation of Demand During Lead Time
(Note: If using formulas incorporating lead time demand, substitute your calculated lead time demand where appropriate.)
- Example: Let's say your Z-score is 1.645, and the standard deviation of demand during your typical 2-week lead time is 50 units. Your safety stock would be: 1.645 * 50 = 82.25, which you'd typically round up to 83 units.
Important Considerations:
- Units of Measure: Ensure all data is in consistent units (e.g., units per week, units per month).
- Seasonality: If your demand is seasonal, use seasonal demand data for more accurate calculations.
- Dependencies: Consider the relationships between different items. Safety stock for dependent demand items (components) may be tied to the safety stock of their parent items (finished goods).
Don't be afraid to use a spreadsheet (like Excel or Google Sheets) to automate these calculations and easily adjust parameters to see how they affect your safety stock levels.
8. Considering Variability: Demand and Lead Time
Safety stock isn't about predicting the future perfectly; it's about preparing for the inevitable uncertainties. Demand and lead times rarely behave predictably. Ignoring this variability is a recipe for stockouts and excessive inventory. This section dives into why understanding these fluctuations is critical for accurate safety stock calculation.
Demand Variability: Your historical sales data likely shows peaks, troughs, and unexpected spikes. These aren's random occurrences; they represent variability. Factors influencing demand can range from seasonal trends and promotional activities to economic conditions and competitor actions. Averages are misleading. We need to analyze the spread of this data - the standard deviation - to understand the potential for demand swings. A higher standard deviation signifies more volatility, requiring a larger safety stock.
Lead Time Variability: Lead time - the time it takes to receive an order - is another significant source of uncertainty. It's affected by supplier performance, transportation delays, customs clearance, and even internal processing times. Just like demand, lead time isn't constant. A supplier might consistently promise a 5-day lead time, but reality often involves unexpected delays. Track lead time performance meticulously. Calculate the standard deviation of lead times to quantify this variability. Even seemingly minor fluctuations in lead time can significantly impact safety stock requirements.
The Interplay: It's not enough to consider demand and lead time variability in isolation. They interact. A fluctuating demand pattern combined with a variable lead time creates a situation where stockouts are much more likely. This is why our calculations will incorporate both these elements. Failing to account for this combined effect will result in either insufficient safety stock (stockouts) or excessive safety stock (increased holding costs).
9. Review and Adjustment: Fine-Tuning Your Calculations
Calculating safety stock isn't a set it and forget it process. Market conditions, supplier performance, and even seasonal fluctuations change constantly. Regularly reviewing and adjusting your safety stock levels is crucial to maintaining an optimal balance between minimizing stockouts and avoiding excessive inventory costs.
Here's what you need to do:
- Regular Intervals: Establish a review schedule - quarterly is often a good starting point, but consider monthly or even more frequent reviews for volatile products.
- Performance Indicators: Track key metrics like:
- Stockout Rate: How often are you running out of stock?
- Inventory Turnover Rate: Are you moving inventory efficiently?
- Obsolescence Rate: Are products expiring or becoming outdated?
- Forecast Accuracy: How closely are your forecasts matching actual demand?
- Root Cause Analysis: If you observe significant deviations from your target performance, investigate the root causes. Was the demand forecast inaccurate? Did a supplier experience delays?
- Formula Reassessment: Periodically evaluate if your chosen safety stock formula still aligns with your business needs. As your data matures and your understanding of demand patterns improves, you might explore more sophisticated methods.
- Parameter Updates: Recalculate your safety stock parameters (like standard deviation, lead time, and service level) at each review cycle. Changes in these factors directly impact your safety stock requirements.
- Feedback Loop: Solicit feedback from sales, customer service, and operations teams. They often have valuable insights into real-world stockout experiences and potential areas for improvement.
- Document Changes: Keep a clear record of all adjustments made to your safety stock calculations, including the rationale behind the changes. This documentation will be invaluable for future reference and analysis.
10. System Implementation: Integrating Safety Stock into Your MRP
Getting your calculated safety stock numbers into your MRP system isn't just about plugging in values; it's about ensuring seamless integration and ongoing effectiveness. Here's a breakdown of key implementation steps:
1. Data Mapping & Import: Identify the fields in your MRP system that correspond to your safety stock parameters (e.g., minimum stock level, reorder point). Prepare your calculated safety stock data in a format compatible with the MRP system's import functionality (often a CSV or Excel file). Thoroughly test the import process with a small subset of SKUs to verify data accuracy.
2. Automation (Where Possible): Manually updating safety stock levels across all SKUs is unsustainable. Explore options for automating the process. This could involve scripting, using API integrations, or leveraging features within your MRP system. Even partial automation (e.g., automating updates based on calculated changes) can save significant time and reduce errors.
3. User Training: Ensure that users responsible for managing inventory understand how the safety stock calculations influence the MRP system's behavior. Explain the rationale behind the changes and how they contribute to improved service levels and reduced stockouts.
4. Staged Rollout: Don't implement changes to all SKUs simultaneously. A phased approach allows for testing and refinement. Start with a pilot group of items representing different demand profiles and lead times. Monitor performance closely and adjust the implementation plan as needed.
5. Validation & Verification: After implementation, rigorously validate the MRP system's behavior. Simulate demand fluctuations and observe how the system responds to trigger reorders. Compare actual stockouts and service levels against pre-implementation baselines.
6. Documentation: Document the integration process, including data mapping, formulas used, and any custom modifications. This documentation is invaluable for troubleshooting, future updates, and knowledge transfer.
11. Monitoring and Performance Evaluation
Implementing safety stock isn't a set it and forget it endeavor. Continuous monitoring and evaluation are critical to ensuring your safety stock levels remain effective and aligned with your business needs. Here's how to stay on top of things:
- Track Key Metrics: Regularly monitor metrics like stockout frequency, excess inventory costs, order fulfillment rates, and forecast accuracy. These indicators will highlight areas where your safety stock may be too low, too high, or requiring adjustments.
- Regular Review Cycles: Schedule periodic reviews (e.g., monthly, quarterly) to assess the effectiveness of your safety stock calculations. This is particularly important after significant changes in demand patterns, lead times, or supplier performance.
- Demand Pattern Shifts: Be vigilant for changes in seasonality, promotions, or overall demand trends. These shifts necessitate recalculating safety stock levels to avoid both stockouts and excessive inventory.
- Lead Time Variability: Supplier performance can fluctuate. Monitor lead times closely, and be prepared to adjust your safety stock when lead time variability increases.
- Forecast Accuracy: Consistently evaluate the accuracy of your demand forecasts. Inaccurate forecasts can lead to incorrect safety stock calculations. Refine your forecasting methods as needed.
- Cost Analysis: Track the costs associated with safety stock (holding costs, obsolescence costs) versus the costs of stockouts (lost sales, customer dissatisfaction). This will help optimize safety stock levels.
- System Performance: If you're using a system to manage your safety stock, monitor its performance to ensure it's functioning correctly and accurately reflecting current data.
- Feedback Loop: Encourage feedback from sales, production, and procurement teams to identify potential issues with safety stock levels and improve the process.
12. Continuous Improvement: Adapting to Change
No safety stock calculation is truly "set it and forget it." Market dynamics, supplier performance, and even internal processes are constantly shifting. Regularly revisiting your safety stock levels - ideally at least annually, and more frequently if you're experiencing volatility - is crucial.
Here's what continuous improvement looks like in practice:
- Monitor Key Metrics: Track actual service levels, stockouts, and inventory carrying costs. Deviations from your targets signal a need for review.
- Feedback Loops: Solicit feedback from sales, customer service, and procurement teams. Their insights can reveal issues not reflected in quantitative data.
- Process Changes: Did a new supplier significantly alter lead times? Has demand forecasting accuracy improved (or worsened)? Factor these changes back into your calculations.
- Seasonality Adjustments: Refine safety stock levels based on seasonal demand fluctuations.
- External Factors: Stay informed about industry trends, economic forecasts, and potential disruptions that could impact supply chains.
- Formula Reassessment: As your business matures, consider if your chosen safety stock formula still aligns with your needs. More sophisticated models might become beneficial.
Don't be afraid to experiment with adjustments and carefully evaluate the impact on your key performance indicators. Continuous improvement isn't just about reacting to problems; it's about proactively optimizing your inventory to ensure resilience and customer satisfaction.
Conclusion: Maintaining Optimal Safety Stock Levels
Ultimately, establishing and maintaining optimal safety stock levels isn't a one-time project; it's an ongoing process. This checklist provides a solid foundation, but remember that market conditions, supplier performance, and even internal processes are constantly evolving. Regularly revisiting each step - from demand analysis to system monitoring - ensures your safety stock remains effective in minimizing stockouts while avoiding excessive holding costs. Don't be afraid to adjust your formulas and parameters as you gather more data and refine your understanding of your supply chain. Continuous improvement and proactive management are key to achieving a resilient and cost-effective inventory strategy.
Resources & Links
- APICS (The Association for Supply Chain Management): A leading professional organization for supply chain professionals, offering resources, certifications, and educational materials related to inventory management, including safety stock. Their website provides a wealth of information and best practices.
- Oracle: A major ERP provider. While their site focuses on their specific software, it contains helpful articles and whitepapers on inventory optimization and safety stock management, often from a vendor perspective.
- SAP: Another leading ERP vendor. Similar to Oracle, SAP's website offers industry insights and content about optimizing inventory through their solutions, valuable even if you don't use their software.
- Infor: An ERP and supply chain management software provider, Infor's site features resources and case studies relating to inventory planning and safety stock strategies.
- Tableau: While a data visualization tool, Tableau's blog and resources offer guidance on how to effectively analyze demand data, a crucial step in safety stock calculation. Seeing your data visually can reveal patterns and trends.
- Statgraphics: Statgraphics provides statistical software and resources. Understanding statistical concepts like standard deviation (used in many safety stock formulas) is essential, and their website provides useful background.
- Investopedia: A financial education website. While not solely focused on MRP, Investopedia offers clear explanations of inventory management concepts, including the financial implications of safety stock levels.
- NetSuite: Another popular ERP solution, NetSuite's website offers content on inventory management best practices and how to optimize safety stock. They cover practical application within a software context.
- Mine Safety and Health Administration (MSHA): While seemingly unrelated, understanding the concept of a 'buffer' and risk mitigation, crucial for safety stock, is something MSHA's website touches on. It's a good conceptual tie-in for overall risk management.
- The Lean Enterprise Institute: While focused on Lean principles overall, understanding waste reduction in a supply chain (including excess inventory) aligns with optimizing safety stock. Their resources provide context for inventory efficiency.
Frequently Asked Questions
What is safety stock and why is it important?
Safety stock is extra inventory held to buffer against unexpected demand fluctuations or supply chain disruptions. It's important because it prevents stockouts, maintains customer service levels, and minimizes lost sales, especially when demand is variable or lead times are uncertain.
How does safety stock relate to MRP (Material Requirements Planning)?
MRP systems calculate how much material is needed to meet production schedules. Safety stock complements MRP by ensuring you have enough on hand to cover unexpected demand or delays *before* MRP signals a need to reorder. It's a buffer layer.
What factors should I consider when calculating safety stock?
Key factors include: Demand variability (historical data is crucial), lead time variability, desired service level (target fill rate), cost of stockouts, and cost of holding inventory. Seasonality and promotional activities also play a role.
What's the difference between a simple safety stock calculation and a more sophisticated one?
Simple calculations often use formulas like 'average demand * lead time * safety factor'. Sophisticated methods use statistical methods (like standard deviation) to more accurately account for variability and achieve specific service levels.
What is the role of the 'safety factor' in a basic safety stock calculation?
The safety factor acts as a multiplier to the average demand during lead time. A higher safety factor results in higher safety stock levels, providing a larger buffer against uncertainty. The ideal factor depends on your risk tolerance and desired service level.
How does lead time variability affect my safety stock calculation?
Greater lead time variability requires a higher safety stock level. If lead times fluctuate significantly, you need more inventory to ensure you don't run out while waiting for replenishment.
What is a 'service level' and how does it influence safety stock?
Service level is the probability of meeting customer demand from available inventory. A higher desired service level (e.g., 99% fill rate) necessitates a larger safety stock to minimize the risk of stockouts.
How can I leverage historical data to improve my safety stock calculations?
Analyze past demand patterns and lead times. Calculate the average demand, standard deviation of demand, and lead time variability. Use this data in statistical formulas for more accurate safety stock calculations.
What are some common mistakes people make when calculating safety stock?
Common mistakes include: Ignoring demand variability, using outdated data, setting too low or too high safety factors, failing to account for lead time variability, and not regularly reviewing and adjusting safety stock levels.
How often should I review and adjust my safety stock levels?
Safety stock isn't a 'set it and forget it' metric. Review it at least quarterly, or more frequently if demand patterns or lead times change significantly. Continuous monitoring and adjustments are ideal.
Found this Article helpful?
Related Articles
MRP System Performance Monitoring Checklist: Ensure Peak Efficiency
MRP System Implementation Checklist: Your Step-by-Step Guide

Top 10 MRPeasy Alternatives for 2025

The 5 Best Bill of Materials (BOM) Management Software of 2025
MRP Planning Parameter Setup Checklist: Your Guide to Accuracy & Efficiency

The 10 Best Manufacturing Management Software of 2025
How to improve your Bill of Materials (BOM) Management
MRP User Training Checklist: Ensuring Proficiency & Success
We can do it Together
Need help with
Material Requirements Planning (MRP)?
Have a question? We're here to help. Please submit your inquiry, and we'll respond promptly.