MRP System Performance Monitoring Checklist: Ensure Peak Efficiency
Published: 12/14/2025 Updated: 12/15/2025
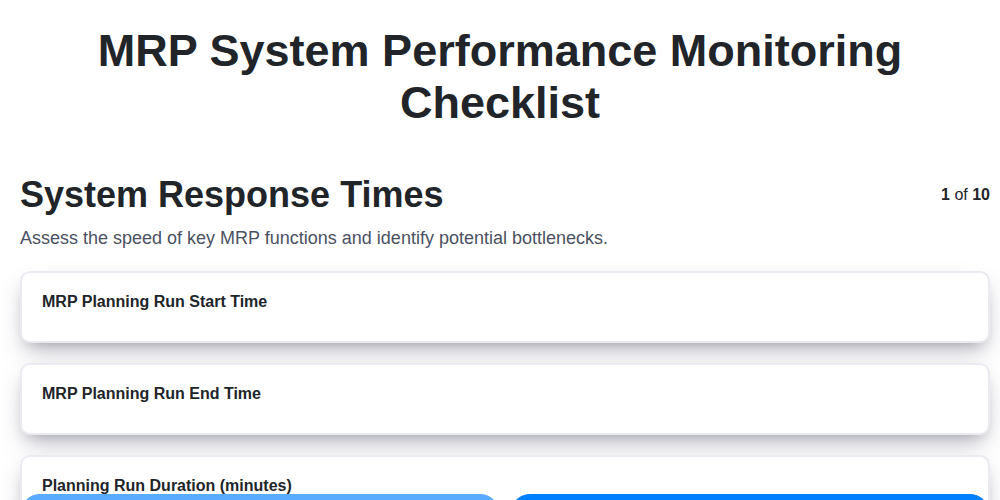
Table of Contents
- Introduction: Why MRP System Performance Matters
- Understanding Key Performance Indicators (KPIs) for MRP Systems
- MRP System Performance Monitoring Checklist
- 1. System Response Times: Speed is Key
- 2. Data Processing Efficiency: Minimizing Bottlenecks
- 3. Report Generation Time: Keeping Stakeholders Informed
- 4. CPU and Memory Utilization: Resource Management
- 5. Database Performance: The Foundation of Your MRP
- 6. Network Latency: Assessing Connectivity
- 7. Concurrent User Performance: Handling Peak Loads
- 8. Error Logs and System Alerts: Proactive Issue Identification
- 9. Scheduled Task Completion: Automation Reliability
- 10. Integration Performance: Seamless Data Flow
- 11. Tools and Technologies for MRP Performance Monitoring
- Conclusion: Continuous Optimization for Maximum ROI
- Resources & Links
TLDR: Is your MRP system running smoothly? This checklist provides a simple, step-by-step guide to monitor key performance indicators - from response times and data processing to database health and error logs - ensuring your MRP system operates at peak efficiency and avoids costly disruptions. Use it to proactively identify and resolve performance bottlenecks.
Introduction: Why MRP System Performance Matters
Your Manufacturing Resource Planning (MRP) system isn't just software; it's the backbone of your operational efficiency. It orchestrates everything from raw material procurement to production scheduling and finished goods delivery. When your MRP system struggles, it impacts every facet of your business - leading to delays, increased costs, and frustrated teams.
Think about it: slow response times mean production bottlenecks. Inaccurate data processing leads to incorrect orders and inventory issues. Delayed reports hinder critical decision-making. Ultimately, poor MRP performance directly translates to lost productivity and potentially, lost revenue.
Regular performance monitoring is no longer optional; it's a necessity for maintaining a healthy and responsive MRP system that fuels your business success. This checklist provides a framework for proactively identifying and addressing potential performance issues before they escalate into major problems. Let's ensure your MRP system is operating at its peak potential.
Understanding Key Performance Indicators (KPIs) for MRP Systems
Monitoring your Manufacturing Resource Planning (MRP) system isn't just about keeping it running; it's about ensuring it's effectively running and contributing to your business goals. To do that, you need to track the right Key Performance Indicators (KPIs). These KPIs provide a window into your system's health, identify bottlenecks, and allow you to proactively address issues before they impact production and delivery.
Think of KPIs as vital signs for your MRP system. Just like a doctor monitors a patient's heart rate and blood pressure, you need to consistently monitor specific metrics within your MRP. Focusing on these indicators allows you to move beyond reactive troubleshooting to a proactive, performance-driven approach. Without these metrics, you're essentially flying blind, potentially missing crucial warning signs of underlying problems that could lead to costly delays and inefficiencies. This checklist outlines critical KPIs to focus on; each one offers a different perspective on your MRP's overall performance. Remember, defining acceptable thresholds for each KPI is crucial - what's good performance will vary depending on your specific system, workload, and business requirements.
MRP System Performance Monitoring Checklist
Maintaining optimal performance from your Manufacturing Resource Planning (MRP) system is crucial for operational efficiency and minimizing disruptions. Reactive troubleshooting is costly and frustrating; proactive monitoring is the key. This checklist outlines essential areas to examine regularly to ensure your MRP system is running smoothly and effectively.
Here's a detailed checklist to guide your performance monitoring efforts:
1. System Response Times:
- Metric: Measure the time it takes for key transactions (e.g., order entry, material requirements planning, production scheduling) to complete.
- Acceptable Range: Define baseline response times and monitor for deviations. Significant increases suggest bottlenecks.
- Action: Investigate slow transactions, analyze user interface performance.
2. Data Processing Efficiency:
- Metric: Track the time taken for batch processes like inventory updates, costing runs, and MRP calculations.
- Acceptable Range: Similar to response times, establish baselines and monitor for performance degradation.
- Action: Optimize batch job parameters, consider indexing strategies.
3. Report Generation Time:
- Metric: Measure the time it takes for frequently used reports (e.g., production reports, inventory aging) to generate.
- Acceptable Range: Identify reports that consistently take a long time and investigate their data sources and calculations.
- Action: Optimize report queries, ensure appropriate data summarization, and review report design.
4. CPU and Memory Utilization:
- Metric: Monitor CPU and memory usage on the application server(s) and database server(s).
- Acceptable Range: High utilization (consistently above 80%) can indicate resource constraints.
- Action: Upgrade server hardware, optimize application code, and review database configuration.
5. Database Performance:
- Metric: Monitor key database metrics like query execution times, index usage, and transaction rates.
- Acceptable Range: Slow queries or inefficient index usage can significantly impact overall performance.
- Action: Analyze slow queries, optimize indexes, and review database configuration.
6. Network Latency:
- Metric: Measure network latency between clients and the application server and between the application server and the database server.
- Acceptable Range: High latency introduces delays in data transmission and impacts responsiveness.
- Action: Investigate network infrastructure, optimize network configuration, and consider load balancing.
7. Concurrent User Performance:
- Metric: Test system performance under different user load scenarios.
- Acceptable Range: Ensure the system handles expected peak loads without significant performance degradation.
- Action: Scale infrastructure, optimize application code for concurrency.
8. Error Logs and System Alerts:
- Metric: Regularly review application and system logs for errors, warnings, and unusual activity.
- Acceptable Range: Zero critical errors and minimal warnings.
- Action: Investigate and resolve errors promptly. Configure alerts for critical errors.
9. Scheduled Task Completion:
- Metric: Verify that all scheduled tasks (e.g., backups, data imports, report distribution) are completing successfully and on time.
- Acceptable Range: 100% successful completion.
- Action: Troubleshoot failed tasks promptly.
10. Integration Performance:
- Metric: Monitor the performance of integrations with other systems (e.g., ERP, CRM, SCM).
- Acceptable Range: Seamless and timely data exchange.
- Action: Investigate and resolve integration errors. Optimize data transformation processes.
Regularly reviewing this checklist will help you proactively identify and address performance issues, keeping your MRP system operating at peak efficiency.
1. System Response Times: Speed is Key
Slow system response times are a major frustration for users and a potential bottleneck in your manufacturing process. Regularly monitoring these times is crucial for ensuring smooth operations and identifying potential issues before they impact productivity. This isn't just about perceived slowness; consistently slow response times can directly impact order processing, inventory management, and overall efficiency.
Here's what to monitor:
- Transaction Response Times: Track the time it takes to complete common tasks like creating work orders, releasing materials, or confirming receipts. Set baseline targets and track deviations.
- Screen Load Times: How long does it take for screens to load? Delays here can impact user productivity.
- Navigation Speed: Assess the time required to navigate between different modules within the MRP system.
- Average Response Time: Establish a benchmark for average response times and proactively address any significant increases.
Tools like system performance monitors or even user feedback can help identify these areas. Implement alerts when response times exceed pre-defined thresholds and investigate the root cause, which could range from network issues to resource constraints on the server.
2. Data Processing Efficiency: Minimizing Bottlenecks
Data processing efficiency within your MRP system is crucial for maintaining smooth operations and ensuring timely decision-making. Slow data processing can lead to delays in order fulfillment, inaccurate inventory levels, and frustrated users. This section focuses on key areas to monitor and potential bottlenecks to address.
What to Look For:
- Batch Job Duration: Monitor the time it takes for key batch jobs to complete, such as inventory updates, costing runs, and forecasting processes. Significant increases in duration are a red flag.
- Transaction Processing Time: Observe the time taken for common transactions like sales order entry, purchase order creation, and goods receipt. Slow transaction times directly impact user productivity.
- Data Transformation Performance: If your MRP system includes data transformations (e.g., from legacy systems or external data sources), track the time taken for these processes.
- Data Volume Impact: Assess how processing times change as data volumes grow. A system that performs well with a small dataset may struggle with a larger one.
- Error Rates During Processing: High error rates during data processing indicate potential data quality issues or underlying system problems.
Potential Bottlenecks & Solutions:
- Inefficient SQL Queries: Slow queries are a common culprit. Analyze query execution plans to identify areas for optimization.
- Lack of Indexing: Proper indexing of database tables is essential for fast data retrieval.
- Data Volume: Large datasets require more processing power. Consider data archiving or partitioning strategies.
- Resource Constraints: Ensure sufficient CPU, memory, and disk I/O are available to handle data processing loads.
- Algorithm Inefficiency: Evaluate the efficiency of algorithms used for data transformations and calculations.
- Blocking and Locking: Investigate potential blocking or locking issues that can slow down processing.
Regularly monitoring these metrics and proactively addressing bottlenecks will help maintain optimal data processing efficiency within your MRP system.
3. Report Generation Time: Keeping Stakeholders Informed
Report generation is a critical function of any MRP system - it's how you communicate insights to stakeholders, track progress, and make informed decisions. Slow or unreliable report generation can frustrate users, delay critical actions, and undermine confidence in the system.
This checklist item focuses on ensuring reports are generated efficiently and accurately. Here's what to consider:
- Establish Baseline: Define acceptable report generation times for key reports (e.g., production schedules, inventory levels, sales forecasts). These baselines should be realistic, considering data volume and complexity.
- Regular Monitoring: Track report generation times consistently. Tools built into your MRP system or third-party monitoring solutions can automate this.
- Investigate Delays: Any deviation from the established baseline warrants investigation. Is the database overloaded? Are there indexing issues? Are query optimizations needed?
- Report Optimization: Regularly review report design and data sources. Can data be pre-calculated or aggregated to reduce processing time?
- User Feedback: Solicit feedback from report users. Are they experiencing delays? Do they have suggestions for improvement?
- Scheduled Report Success: Confirm scheduled reports (daily, weekly, monthly) are completing successfully and within the defined timeframe. Failed or delayed scheduled reports can impact decision-making.
Prioritizing report generation performance isn't just about speed; it's about ensuring your stakeholders have the timely data they need to keep your operation running smoothly.
4. CPU and Memory Utilization: Resource Management
Effective MRP system performance hinges on optimal resource management, and that starts with diligently monitoring CPU and memory utilization. Consistently high CPU usage (above 70-80%) and memory exhaustion (swapping to disk) are red flags, indicating potential bottlenecks and negatively impacting performance.
What to Monitor:
- Average CPU Utilization: Track this over time (hourly, daily, weekly) to identify trends and spikes.
- Peak CPU Utilization: Note the highest levels reached, particularly during batch processing or peak business hours.
- Memory Utilization: Monitor both physical memory and virtual memory. Excessive paging or swapping to disk is a clear performance killer.
- Process-Level CPU Usage: Identify specific MRP processes consuming excessive CPU. This could point to inefficient code, poorly optimized queries, or data volume issues.
- Memory Leaks: Investigate processes that continuously increase memory consumption over time, as this often signals a memory leak.
What to Look For:
- Sustained High Utilization: Indicates the system is struggling to handle the workload. Consider increasing hardware resources or optimizing processes.
- Spikes During Specific Tasks: Pinpoint the tasks driving resource consumption and evaluate if they can be optimized or scheduled for off-peak hours.
- Memory Exhaustion: Implement alerts for low memory conditions and investigate the underlying cause.
Actions to Take:
- Hardware Upgrade: If utilization consistently remains high, consider upgrading CPU, RAM, or storage.
- Process Optimization: Review MRP processes and queries to identify areas for improvement.
- Code Review: Engage developers to review code for inefficiencies.
- Database Tuning: Optimize database indexes and queries.
- Scheduling Adjustments: Redistribute workloads to off-peak hours where possible.
5. Database Performance: The Foundation of Your MRP
Your MRP system's database is its heart. Slow database performance directly impacts every other function - from order entry to production scheduling. Don't assume it's "just working"; proactively monitor it.
Here's what to check:
- Query Response Times: Regularly audit common query execution times. Slow queries are often a symptom of inefficient indexing, outdated statistics, or poorly written SQL. Tools built into your database system (like SQL Server Management Studio or Oracle SQL Developer) can help identify these culprits.
- Index Fragmentation: Fragmented indexes degrade query performance. Schedule regular index rebuilds or reorganizations based on fragmentation levels.
- Database Statistics: Outdated statistics mislead the query optimizer, leading to suboptimal query plans. Ensure statistics are updated regularly, ideally automatically.
- Disk I/O: High disk I/O wait times indicate a bottleneck. Consider faster storage solutions (like SSDs) or optimize data access patterns.
- Transaction Log Size & Growth: Monitor the transaction log's size and growth rate. Excessive growth can impact performance and require more frequent backups.
- Deadlocks & Blocking: Investigate any reported deadlocks or blocking events. These indicate resource contention and require root cause analysis.
- Database Size & Growth: Monitor the database size and identify potential for archiving or purging old data.
6. Network Latency: Assessing Connectivity
Network latency, or the delay in data transfer, can significantly impact MRP system performance, even if the system itself is running optimally. High latency can manifest as slow response times, frustrating users and hindering productivity.
Here's what to look for when assessing network latency related to your MRP system:
- Ping Tests: Regularly conduct ping tests between the MRP server and user workstations. High ping times (above 50ms, ideally much lower) indicate potential network bottlenecks.
- Traceroute Analysis: Use traceroute to identify the specific hops experiencing the most latency. This helps pinpoint if the issue lies within your internal network, with your ISP, or at a specific intermediary point.
- Bandwidth Utilization: Monitor bandwidth usage during peak MRP usage times. Congestion can lead to increased latency.
- Network Device Health: Ensure routers, switches, and firewalls are functioning correctly and have adequate resources. Overloaded devices can introduce delays.
- Wireless vs. Wired: If users are experiencing issues, test connectivity using a wired connection to rule out wireless interference or limitations.
- WAN Link Performance: If your MRP system is hosted remotely, analyze the performance of your Wide Area Network (WAN) connection. Consider a dedicated connection or QoS (Quality of Service) settings.
Addressing network latency issues requires a collaborative approach, potentially involving your IT team, network administrators, and internet service provider.
7. Concurrent User Performance: Handling Peak Loads
One of the most critical aspects of MRP system health is its ability to handle concurrent users - especially during peak periods like month-end closing or order fulfillment rushes. A sluggish system under heavy load can bring operations to a standstill and erode user confidence.
This checklist item focuses on assessing how your MRP system performs when multiple users are actively using it simultaneously. Don't just look at average user experience; consider scenarios that simulate your highest traffic periods.
Here's what to check:
- Simulate Peak Load: Use load testing tools or, if possible, monitor system performance during actual peak usage times.
- Response Times Under Load: Track response times for common transactions (e.g., sales order entry, material requisition, production order creation) with a defined number of concurrent users. Acceptable response times should be defined and monitored.
- Transaction Throughput: Measure the number of transactions the system can successfully process per minute (or hour) with a set number of users.
- Resource Saturation: Monitor CPU, memory, and database resources during concurrent user simulations. Identify bottlenecks.
- User Experience Surveys: Gather feedback from users experiencing the system during peak times to identify perceived performance issues.
- Scaling Capacity: Analyze if your current hardware and infrastructure can comfortably handle anticipated future growth in the number of users. Consider cloud-based options for elastic scaling.
Addressing concurrent user performance proactively ensures your MRP system remains a productive asset, even when under pressure.
8. Error Logs and System Alerts: Proactive Issue Identification
Your MRP system is a complex machine, and like any complex system, it's bound to encounter hiccups. Ignoring error logs and system alerts is like driving with your eyes closed - eventually, something's going to go wrong, and you'll be scrambling to fix it after it impacts operations.
Regularly reviewing error logs and system alerts isn't about finding blame; it's about proactive problem identification and resolution. Here's what to look for and why it's vital:
- Frequency and Severity: Track the frequency of different error types and categorize them by severity (e.g., warning, error, critical). A sudden spike in a specific error, even if individually marked as warning, can indicate an underlying problem.
- Correlated Errors: Look for patterns. Are certain errors occurring in conjunction with each other? This can point to a root cause affecting multiple system components.
- Alert Thresholds: Ensure your system alerts are appropriately configured. Setting too high thresholds can lead to missed critical issues, while excessively low thresholds can create alert fatigue. Regularly review and adjust these thresholds based on system behavior.
- Automated Notifications: Configure automated email or SMS notifications for critical alerts so you're immediately aware of potential issues, even outside of regular working hours.
- Documentation: Meticulously document all errors and alerts, along with the steps taken to resolve them. This builds a valuable knowledge base for future troubleshooting and can help identify recurring problems.
- Centralized Logging: Consider consolidating logs from all MRP modules and related systems into a central location for easier monitoring and analysis.
By consistently monitoring error logs and system alerts, you can shift from reactive firefighting to proactive maintenance, ensuring the stability and efficiency of your MRP system.
9. Scheduled Task Completion: Automation Reliability
Automated tasks are the backbone of many MRP systems, handling everything from inventory updates to order fulfillment. Failures in these scheduled tasks can lead to significant delays, data inaccuracies, and ultimately, operational disruptions. Regularly monitoring their completion is crucial.
What to Check:
- Task Execution History: Review logs for each scheduled task to confirm they are running on schedule and completing successfully. Look for patterns of failure or delays.
- Completion Times: Track the duration of each task. Increasing completion times can indicate underlying performance issues.
- Error Rates: Closely examine error logs specifically related to scheduled tasks. Identify and address the root causes of any errors.
- Dependencies: Understand the dependencies between scheduled tasks. A failure in one task can cascade and impact others. Verify that dependent tasks are also executing correctly.
- Alerting: Configure alerts to notify relevant personnel immediately when a scheduled task fails or experiences significant delays.
- Logging: Ensure adequate logging is enabled for all scheduled tasks, providing detailed information for troubleshooting.
- Frequency of Review: Schedule a regular review (e.g., weekly or monthly) of scheduled task logs and performance metrics.
Addressing any issues promptly maintains the integrity of your MRP system's automation and minimizes the risk of operational setbacks.
10. Integration Performance: Seamless Data Flow
Your MRP system rarely exists in a vacuum. It likely integrates with other critical business applications - CRM, e-commerce platforms, accounting software, and more. This integration is only as good as its performance. Poor integration performance can lead to data discrepancies, delays, and frustrating bottlenecks across departments.
This checklist item focuses on verifying the efficiency of those data exchanges. Regularly monitor the time it takes for data to sync between your MRP and integrated systems. Look for errors in data transformation or mapping during integration. Analyze any failed integration jobs and identify their root causes.
Key considerations here include:
- Synchronization Times: Are data updates happening within acceptable timeframes?
- Error Rates: How frequently are integration jobs failing, and why?
- Data Accuracy: Is the data being transferred accurately and completely?
- Volume Handling: Can the integration handle peak data volumes without degradation?
- API Performance: If using APIs, monitor their response times and error rates.
Regularly auditing integration performance will help ensure a smooth, accurate flow of information, minimizing disruption and maximizing the value of your interconnected systems.
11. Tools and Technologies for MRP Performance Monitoring
Monitoring an MRP system effectively requires leveraging the right tools. While some basic monitoring can be done with standard operating system utilities, dedicated tools offer far greater depth and automation. Here's a look at some options, categorized by functionality:
Real-Time Monitoring & Dashboards:
- SolarWinds Server & Application Monitor: A comprehensive solution offering real-time performance data, alerting, and reporting, specifically suitable for complex environments.
- Datadog: A cloud-based monitoring platform providing visibility into infrastructure, applications, and logs, with strong visualization capabilities.
- New Relic: Similar to Datadog, offering application performance monitoring (APM), infrastructure monitoring, and log management.
- Dynatrace: An AI-powered monitoring platform that automatically discovers and maps your entire IT landscape, providing insights into performance bottlenecks.
Database Performance Monitoring:
- SQL Server Management Studio (SSMS): (For Microsoft SQL Server) - Offers built-in performance monitoring features, including query analysis and index tuning recommendations.
- Oracle Enterprise Manager (OEM): (For Oracle Databases) - Provides comprehensive database monitoring and management capabilities.
- pgAdmin: (For PostgreSQL) - A popular administration and monitoring tool for PostgreSQL databases.
Log Management & Analysis:
- Splunk: A leading platform for collecting, indexing, and analyzing machine-generated data, including MRP system logs.
- ELK Stack (Elasticsearch, Logstash, Kibana): A powerful open-source alternative for log management and analysis. Logstash collects and parses data, Elasticsearch indexes it, and Kibana provides visualizations and dashboards.
- Graylog: Another open-source log management platform with robust search and analysis capabilities.
Scripting & Automation:
- PowerShell: For Windows environments, PowerShell can be used to automate data collection, run performance tests, and generate reports.
- Bash Scripting: For Linux environments, Bash scripting allows for similar automation tasks.
- Python: With libraries like
psutiland database connectors, Python is a versatile option for custom monitoring scripts.
Choosing the right tool depends on your budget, technical expertise, and the specific monitoring needs of your MRP system. A combination of tools-for example, a database performance monitoring tool alongside a broader system monitoring platform-can often provide the most comprehensive view.
Conclusion: Continuous Optimization for Maximum ROI
Ultimately, implementing and adhering to an MRP system performance monitoring checklist isn't a one-and-done task. It's a cornerstone of continuous improvement and a vital investment in maximizing your return on investment. Regularly reviewing these metrics - System Response Times, Data Processing Efficiency, Report Generation Time, CPU and Memory Utilization, Database Performance, Network Latency, Concurrent User Performance, Error Logs and System Alerts, Scheduled Task Completion, and Integration Performance - allows you to proactively identify and address potential bottlenecks before they impact production, delivery, or overall business efficiency. By treating this checklist as a living document, regularly updating it to reflect system changes and evolving business needs, you'll ensure your MRP system continues to be a powerful engine driving your manufacturing operations forward. Don't just implement the checklist; live it.
Resources & Links
- Oracle MRP: Oracle's Manufacturing Resource Planning (MRP) solution overview, including features and benefits. Useful for understanding the scope of MRP systems and potential performance considerations.
- SAP S/4HANA Manufacturing: SAP's S/4HANA Manufacturing Suite - Another major MRP provider, understanding their platform can provide context for general performance monitoring principles applicable across systems.
- NetSuite Manufacturing: NetSuite's Manufacturing solution. Provides perspective on cloud-based MRP and related performance considerations.
- Infor ERP for Manufacturing: Infor's Manufacturing ERP solutions, useful for understanding specific features and related performance implications.
- Gartner: Gartner's research and analysis on ERP and manufacturing technologies. Can provide insights into industry trends and best practices regarding performance.
- TechTarget - What is MRP?: Provides a foundational understanding of MRP and its core functionalities, important for anyone new to the topic.
- AWS CloudWatch: Amazon Web Services (AWS) CloudWatch is a monitoring and observability service. Relevant if your MRP system runs in AWS or utilizes AWS services; demonstrates possibilities for performance monitoring.
- Google Cloud Monitoring: Google Cloud Monitoring is a similar service to AWS CloudWatch. Helpful if your MRP is on Google Cloud Platform.
- Azure Monitor: Microsoft Azure Monitor for similar reasons as above - cloud monitoring tools are vital for performance tracking.
- Dynatrace: A comprehensive application performance management (APM) platform. Provides advanced capabilities for monitoring complex systems, including MRP.
- New Relic: Another popular APM platform offering similar features to Dynatrace, useful for deep-dive performance analysis.
- SolarWinds: SolarWinds offers a suite of IT management tools, including those for performance monitoring and network diagnostics relevant to MRP systems.
- SQL Server Central: A resource for SQL Server administration and performance tuning. Essential for understanding and optimizing the database component of many MRP systems.
- MySQL: If your MRP uses MySQL, this is the official website for documentation, resources, and performance tuning guides.
- PostgreSQL: If your MRP uses PostgreSQL, this is the official website for documentation and resources.
Frequently Asked Questions
What is an MRP system and why is performance monitoring important?
MRP (Material Requirements Planning) systems are software that plan and manage manufacturing processes. Performance monitoring is vital to ensure it's operating efficiently, identifying bottlenecks, optimizing resource allocation, and ultimately, improving overall production output and reducing costs.
Who should use this MRP performance monitoring checklist?
This checklist is designed for MRP system users, including production planners, inventory managers, IT professionals responsible for system maintenance, and operations managers seeking to optimize their manufacturing processes.
What types of metrics are covered in this checklist?
The checklist covers a broad range of metrics, including system response times, data accuracy, data loading performance, BOM (Bill of Materials) accuracy, inventory accuracy, planning cycle time, and user satisfaction. It's categorized by key areas of MRP function.
How often should I be performing this checklist?
The frequency of checks depends on your operations. Critical metrics should be monitored daily or weekly. Less critical areas can be reviewed monthly or quarterly. A good practice is to establish a recurring schedule and document the findings.
What does 'system response time' refer to?
System response time measures how long it takes for the MRP system to respond to user requests, such as running reports, making data changes, or executing planning calculations. Slow response times can impact productivity and user frustration.
What is 'data loading performance' and why is it important?
Data loading performance refers to the time it takes to upload data, such as production orders, inventory levels, or sales forecasts, into the MRP system. Slow data loading can disrupt planning cycles and delay production.
What does 'BOM accuracy' mean and how does it impact my production?
BOM (Bill of Materials) accuracy refers to the correctness of the component lists for each product. Inaccurate BOMs can lead to incorrect material orders, production errors, and delays.
What should I do if I identify a problem during the performance check?
Document the issue thoroughly. Prioritize based on impact - critical issues require immediate attention. Escalate to the appropriate team (IT, MRP specialist, vendor) and track progress toward resolution. Consider implementing corrective actions to prevent recurrence.
How do I interpret 'inventory accuracy' scores?
Inventory accuracy reflects the difference between the actual physical inventory and the records in the MRP system. A high accuracy score (e.g., 98%+) indicates reliable data and efficient inventory management. Low accuracy suggests potential discrepancies needing investigation.
Can I customize this checklist?
Yes! This checklist is a template. Adapt it to your specific MRP system configuration, business processes, and key performance indicators. Add or remove metrics as needed to reflect your unique requirements.
Found this Article helpful?
Related Articles
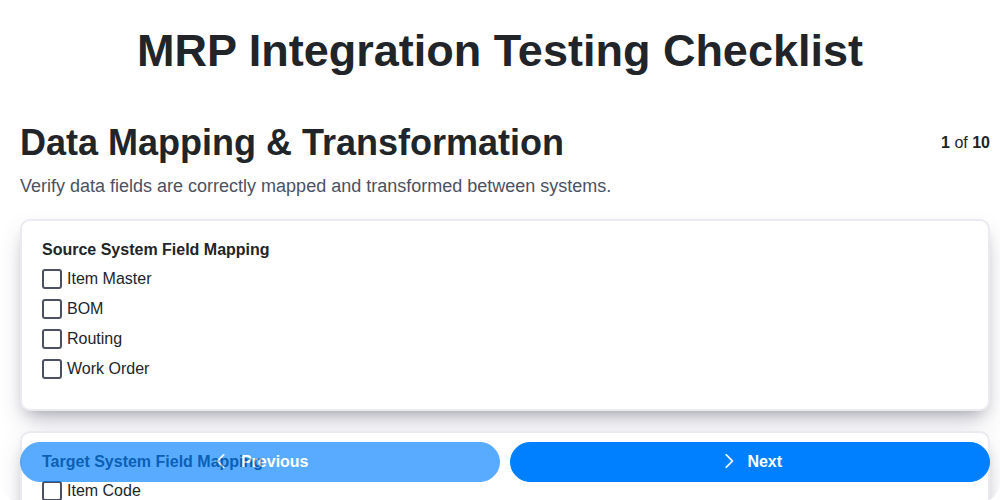
MRP Integration Testing Checklist: A Comprehensive Guide
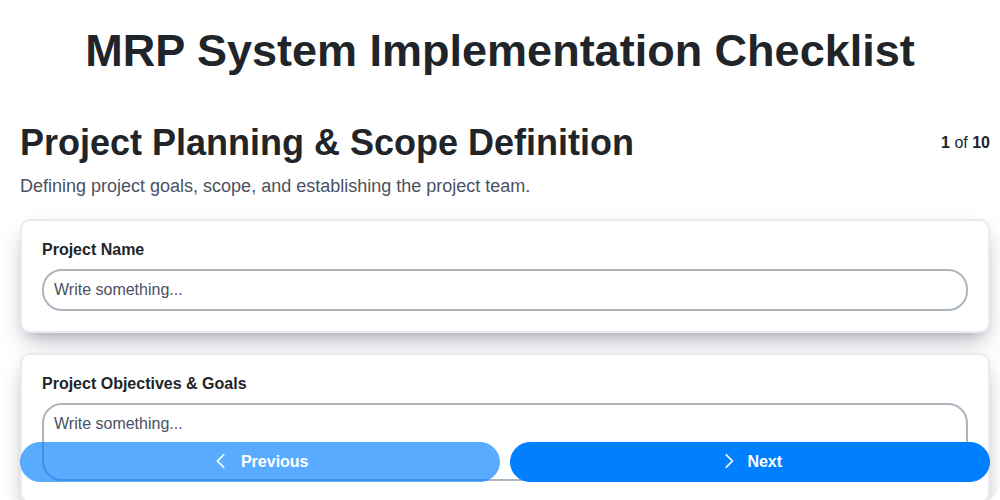
MRP System Implementation Checklist: Your Step-by-Step Guide

Top 10 MRPeasy Alternatives for 2025

The 5 Best Bill of Materials (BOM) Management Software of 2025
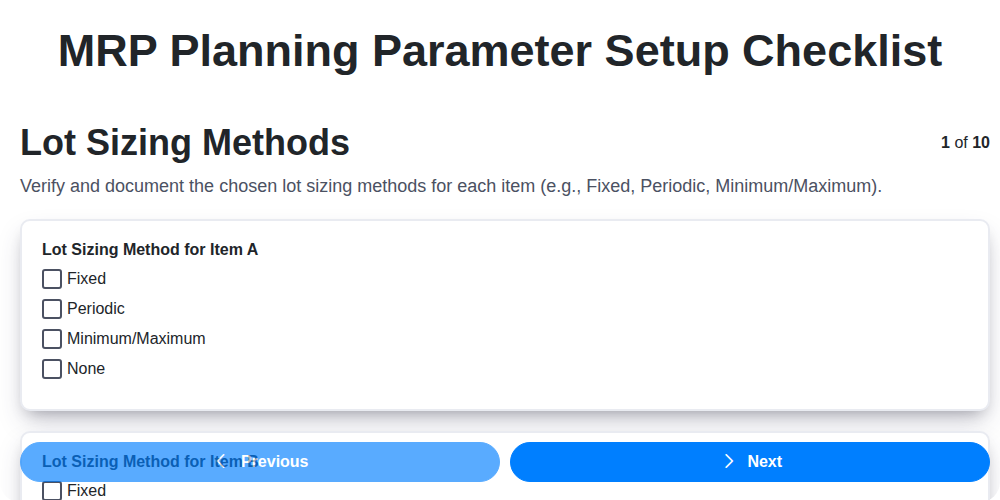
MRP Planning Parameter Setup Checklist: Your Guide to Accuracy & Efficiency

The 10 Best Manufacturing Management Software of 2025
How to improve your Bill of Materials (BOM) Management
MRP User Training Checklist: Ensuring Proficiency & Success
We can do it Together
Need help with
Material Requirements Planning (MRP)?
Have a question? We're here to help. Please submit your inquiry, and we'll respond promptly.