The Ultimate Performance Testing Checklist Template
Published: 08/24/2025 Updated: 12/13/2025
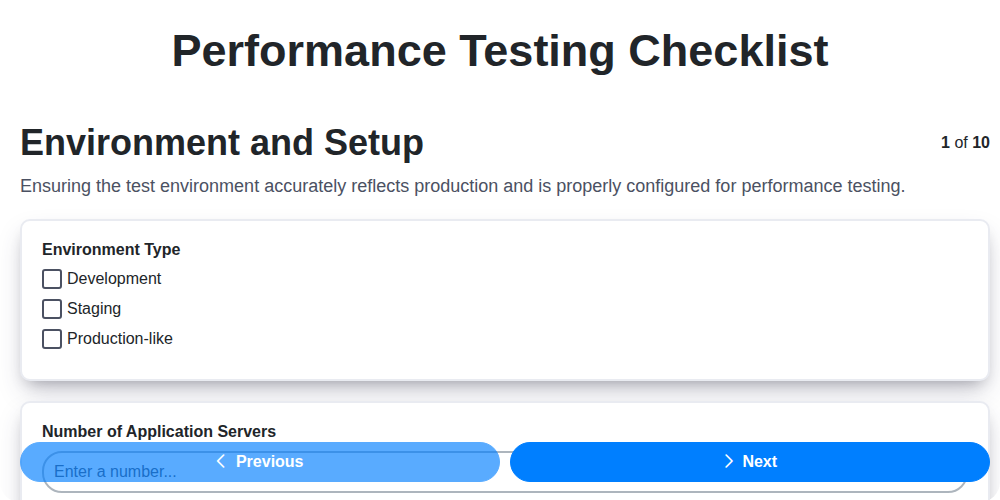
Table of Contents
- Introduction: Why Performance Testing Matters
- 1. Setting the Stage: Environment and Test Data
- 2. Defining Your Load: Workload Modeling
- 3. Test Execution & Monitoring: Observing Performance
- 4. Analyzing Results: Identifying Bottlenecks
- 5. Specialized Testing Types: Scaling, Stress, and Endurance
- 6. Database and Network Performance Considerations
- 7. Checklist Template Summary & Next Steps
- Resources & Links
TLDR: Get your app ready for peak load with our free, comprehensive Performance Testing Checklist Template! It guides you through environment setup, workload modeling, test execution, and analysis, ensuring a robust and scalable application. Download it now to avoid performance bottlenecks and deliver a stellar user experience!
`Introduction: Why Performance Testing Matters
In today's digital landscape, users demand speed and reliability. A slow, unresponsive application isn't just frustrating; it can directly impact your bottom line, damage your brand reputation, and drive customers to competitors. While functional testing ensures your software works, performance testing ensures it works well - under pressure.
Imagine a flash sale announcement goes viral, sending a flood of users to your e-commerce site. If your application isn't prepared, expect slow loading times, abandoned carts, and a deluge of angry customers. This isn't just a temporary inconvenience; it's a lost opportunity and a blow to your credibility.
Performance testing isn't an optional add-on; it's a fundamental part of a robust software development lifecycle. It proactively identifies bottlenecks, optimizes resource utilization, and validates that your application can handle the expected load - and even unexpected spikes. By investing in performance testing, you're investing in a better user experience, increased customer satisfaction, and a more resilient business.
1. Setting the Stage: Environment and Test Data
Before you can reliably measure your application's performance, you need to ensure your test environment accurately reflects production and utilizes realistic data. A mismatch here will render your results misleading and potentially wasted effort.
Environment Replication - As Close as Possible: Ideally, your test environment should be a direct mirror image of your production setup. This includes the operating system, middleware versions, database configurations, server hardware, and network topology. While a 1: 1 replica is often impractical, documenting and mitigating any discrepancies is critical. If your production environment utilizes a cluster of servers, your test environment should aim to simulate that distribution. Consider factors like geographic location and network connectivity, as these can impact latency.
Data is King (and Queen): Performance isn't just about code; it's about data. Avoid using minimal or synthetic datasets. Instead, populate your test environment with a volume of data representative of production. This includes not just the amount of data, but also its variety. Include edge cases, outliers, and a diverse range of data types to uncover potential bottlenecks that might only surface with realistic data. Critically, ensure data masking or anonymization techniques are applied to protect sensitive production data. The closer your test data aligns with reality, the more confidence you can have in your performance test results.
2. Defining Your Load: Workload Modeling
Understanding how your users interact with your application is the cornerstone of effective performance testing. Simply throwing a large number of virtual users at your system won't reveal why performance is suffering; it will just show you it's suffering. Workload modeling is the process of creating a realistic simulation of user behavior, allowing you to identify and address bottlenecks proactively.
Here's how to build a robust workload model:
1. User Personas: Giving Your Users Identity
Start by defining user personas. These are representative profiles of your different user types, outlining their common tasks, frequency of use, and technical proficiency. For example, you might have personas like Power User, Mobile Shopper, or Guest User. Each persona will contribute to a different portion of your workload.
2. Key User Journeys: Mapping the Critical Paths
Identify the most critical and frequently used user journeys within your application. These are the sequences of actions that users take to accomplish key business goals - placing an order, submitting a form, searching for products. Focus your initial modeling efforts on these journeys as they will have the greatest impact on overall system performance.
3. Transaction Mix: Reflecting User Proportions
No single user behaves identically. A realistic workload incorporates a mix of transactions, reflecting the proportions of different activities. If 60% of users primarily browse products, 30% place orders, and 10% manage their accounts, your transaction mix should reflect this distribution. You can gather this data through analytics tools, user surveys, or by observing real user behavior.
4. Think Time & Ramp-Up: Mimicking Reality
User behavior isn't instantaneous. Include realistic think time - the pauses between actions - to avoid creating an unrealistic, overly aggressive load. Ramp-up the load gradually to simulate a more natural increase in user activity, rather than an abrupt surge.
5. Data-Driven Iteration:
Workload modeling isn't a one-time task. Continuously refine your model based on real user data and performance test results. Use analytics to monitor actual user behavior and adjust your simulation accordingly.
3. Test Execution & Monitoring: Observing Performance
During test execution, meticulous observation is paramount. It's not enough to simply run the tests; you need to actively monitor key metrics to understand what's happening under the hood. This involves setting up both real-time and historical monitoring capabilities.
Real-Time Monitoring: Establish a dashboard displaying critical performance indicators. This should include:
- Average Response Time: A general indicator of user experience.
- Throughput (Transactions per Second): Reflects the system's capacity to handle requests.
- Error Rates: Identifies immediate issues and failures.
- Resource Utilization (CPU, Memory, Disk I/O): Highlights potential bottlenecks.
- Database Connection Pool Usage: Indicates database contention.
- Network Latency & Packet Loss: Detects network-related performance problems.
Real-time monitoring allows for immediate intervention if issues arise. A sudden spike in response time or error rate can trigger alerts, allowing engineers to quickly diagnose and resolve problems before they impact users.
Historical Monitoring: Complement real-time monitoring with historical data collection. This allows you to:
- Track Trends: Identify performance degradation over time.
- Compare Results: Assess the impact of code changes or infrastructure updates.
- Establish Baselines: Create benchmarks for future performance testing.
- Capacity Planning: Predict future resource needs.
Ensure your monitoring tools are properly configured to collect and analyze relevant data. Automated alerts are crucial for proactive issue detection. Regularly review monitoring data and adjust your configuration as needed. Logging plays a key role as well; detailed logs provide valuable context for troubleshooting performance issues that are difficult to diagnose solely through metrics.
4. Analyzing Results: Identifying Bottlenecks
The data generated during performance testing isn't valuable until you're able to extract meaningful insights. This phase goes beyond simply recording numbers; it's about detective work - uncovering the root causes of performance limitations. Start by establishing clear baseline metrics before any tests are run - these will serve as your comparison point.
Initial Scrutiny: Response Times & Throughput
Begin with the most visible indicators: average response times and throughput. Spikes in response times or a significant drop in throughput are immediate red flags. Don't just look at averages; examine percentile data (e.g., 95th percentile) to understand the user experience for the majority of users. Averages can be misleading if a few slow transactions significantly skew the results.
Resource Utilization: The Prime Suspects
Next, scrutinize resource utilization metrics. Are your servers consistently pegged at 100% CPU? Is memory being exhausted? Is disk I/O a bottleneck? Network latency or bandwidth limitations can also significantly impact performance. Correlate these resource metrics with the response time and throughput data - a sudden spike in CPU utilization coinciding with slow response times strongly suggests a CPU-bound bottleneck.
Database Deep Dive:
Database performance is a frequent culprit. Analyze slow query logs, examine database connection pooling efficiency, and assess the effectiveness of indexes. Poorly optimized queries, missing indexes, and excessive database connections can cripple application performance.
Code-Level Investigations:
When resource utilization appears normal, the bottleneck likely resides within the application code. Profile your code to identify slow functions and inefficient algorithms. Consider using APM (Application Performance Monitoring) tools for deeper insights into code execution.
Network Analysis:
If the issue isn's application or database related, investigate the network. Use network monitoring tools to pinpoint latency issues, packet loss, and bandwidth constraints. Consider simulating different network conditions to assess the application's resilience.
Correlation is Key:
Don't isolate metrics in a vacuum. Look for correlations between different metrics to identify the underlying causes. For example, a sudden spike in database query time coupled with high CPU utilization on the application server points to a database-related bottleneck impacting the application. Systematic investigation and careful data correlation are essential for successfully pinpointing and resolving performance bottlenecks.
5. Specialized Testing Types: Scaling, Stress, and Endurance
While foundational load testing establishes baseline performance, specialized testing types delve deeper, revealing vulnerabilities and unlocking hidden potential. These three - scalability, stress, and endurance - each serve distinct purposes in ensuring a robust and resilient application.
Scalability Testing: Finding Your Upper Bound
Scalability testing focuses on the ability of your system to handle increasing workloads. It's not enough to handle current demand; you need to know how much you can handle before performance degrades unacceptably. This type of testing involves progressively adding resources (e.g., more servers, increased database capacity) while monitoring key performance indicators like response time, throughput, and resource utilization. The goal is to determine the maximum load the system can sustain while maintaining acceptable performance levels, identifying bottlenecks that will arise with further expansion, and understanding the cost-benefit of adding more resources. Scalability tests help in capacity planning and proactively prevent performance degradation during periods of high demand.
Stress Testing: Breaking Point Identification
Unlike scalability testing which focuses on controlled growth, stress testing deliberately pushes your system beyond its normal operating capacity. The objective is to identify its breaking point - the point at which it fails. This could manifest as application crashes, database connection errors, or unacceptable response times. While unpleasant, stress testing provides invaluable insights into system stability, error handling, and recovery mechanisms. By understanding how the system behaves under extreme conditions, you can implement safeguards to prevent failures and gracefully handle unexpected surges in traffic.
Endurance Testing (Soak Testing): Long-Term Stability
Endurance testing, also known as soak testing, simulates a sustained load over an extended period - often hours or days. This is crucial for uncovering issues that don't surface during short bursts of load. Common problems identified through endurance testing include memory leaks, resource depletion (e.g., database connection exhaustion), and performance degradation over time. Unlike stress testing which aims to break the system, endurance testing seeks to expose subtle, long-term performance drifts. It's a vital component of ensuring your application remains stable and performant under continuous use.
6. Database and Network Performance Considerations
Database and network performance are frequently overlooked but critically important components of overall application performance. Bottlenecks in either area can easily negate optimizations made elsewhere.
Database Performance Tuning:
Inefficient database queries are a common culprit in performance degradation. Start by profiling your most frequently executed queries. Utilize database-specific query analysis tools to identify areas for optimization - poorly written joins, missing indexes, inefficient data types. Consider implementing connection pooling to minimize the overhead of establishing new database connections. Regularly review and optimize stored procedures and triggers. Analyze database schema design; proper normalization and indexing are vital for performance. Keep your database software up-to-date with the latest patches and performance enhancements. Evaluate caching strategies - both at the database level and within your application - to reduce the load on the database server.
Network Performance Optimization:
Network latency, bandwidth limitations, and packet loss can significantly impact application responsiveness. Conduct thorough network latency tests to identify bottlenecks. Optimize network configurations - TCP settings, MTU size - to minimize overhead. Use Content Delivery Networks (CDNs) to serve static assets from geographically closer servers. Employ compression techniques (e.g., gzip) to reduce the size of data transmitted over the network. Implement monitoring tools to track network performance metrics like latency, bandwidth, and packet loss. Consider the impact of firewalls and load balancers on network performance and configure them appropriately. Finally, ensure sufficient network bandwidth to accommodate peak user loads.
7. Checklist Template Summary & Next Steps
Putting this comprehensive performance testing checklist into practice can feel overwhelming, but breaking it down into manageable steps is key. Think of this as a living document - not something to be checked off once and forgotten. Regularly review and update it as your application evolves and your performance needs change.
Here's a condensed view to help get you started:
Quick Start Checklist:
- Environment Replication: Match production as closely as possible.
- Representative Data: Use realistic data volumes and types.
- Key User Journeys: Focus on the most critical workflows.
- Concurrent User Estimation: Accurately determine load levels.
- Real-Time Monitoring: Track performance indicators during execution.
- Error Analysis: Investigate and resolve performance bottlenecks.
- Continuous Improvement: Integrate performance testing into your development lifecycle.
Next Steps:
- Download the Detailed Checklist: We've created a downloadable, more detailed version for your team to use.
- Schedule a Kick-off Meeting: Gather stakeholders to discuss performance goals, test scenarios, and resource allocation.
- Prioritize Testing: Focus on the areas with the highest risk or greatest impact on user experience.
- Automate Where Possible: Automated tests save time and ensure consistency.
- Regular Review & Adjustment: Performance is never "done." Continuously monitor and refine your testing process.
Resources & Links
- BlazeMeter : A comprehensive performance testing platform that supports various open-source tools and offers cloud-based load generation. Their resources cover testing methodologies, tutorials, and case studies related to performance testing.
- LoadView : LoadView provides cloud-based load testing with real browsers, offering geographically distributed load generation. Check their blog for content on performance testing best practices and tutorials.
- JetBrains QMetrix Tools : JetBrains' QMetrix offers performance test management and analysis features. Explore their documentation and resources for insights into performance test organization and reporting.
- G2 Crowd : A review platform. Find user reviews and comparisons of different performance testing tools to help in selection. Search for 'performance testing' to find related products.
- Atlassian (Jira, Confluence) : While not solely focused on performance testing, Atlassian's tools like Jira (for issue tracking) and Confluence (for documentation) are often used to manage and document performance testing processes. Their marketplace often has plugins for integration.
- Perforce : A version control system that helps manage performance test scripts and configuration files, especially in collaborative environments. Explore their resources for best practices in DevOps and testing.
- Dynatrace : Dynatrace is an application performance monitoring (APM) platform that can be used for performance testing and root cause analysis. Their website features many technical articles and webinars.
- New Relic : Another popular APM tool offering performance monitoring and insights. New Relic's blog and knowledge base offer information on identifying and resolving performance issues.
- AppDynamics : Similar to Dynatrace and New Relic, AppDynamics provides application performance management features. Their website offers guides and tutorials on performance monitoring and optimization.
- Datadog : A monitoring and analytics platform. Explore their resources on monitoring infrastructure and application performance. It can provide valuable context around performance test results.
- IBM : IBM offers a suite of software and services. Check their site and associated documentation related to performance testing and APM.
- Microsoft : Microsoft provides a variety of developer tools and monitoring solutions (like Azure Monitor) that can support performance testing efforts. Search for relevant documentation and tutorials on their site.
- Sauce Labs : A cloud-based testing platform. While typically for functional testing, it can be adapted to run performance tests across different browsers and devices. Refer to their documentation and blog for performance testing guidance.
Frequently Asked Questions
What is performance testing and why is it important?
Performance testing evaluates how well a system responds to load and handles performance metrics like speed, stability, and scalability. It's crucial to identify bottlenecks, ensure a good user experience, and prevent crashes under stress before release.
Who should use this performance testing checklist?
This checklist is designed for performance testers, QA engineers, developers, and anyone involved in ensuring the performance of software applications. It's applicable to various industries and project sizes.
What types of performance testing are covered in the checklist?
The checklist addresses various types including load testing, stress testing, endurance testing, spike testing, and volume testing. It aims to provide a comprehensive approach to performance evaluation.
Can I customize the checklist template?
Absolutely! This checklist is meant to be a starting point. You can add, remove, or modify items based on your specific project requirements and application architecture.
What tools can be used to execute the tests outlined in the checklist?
The checklist is tool-agnostic. You can use a variety of performance testing tools like JMeter, LoadRunner, Gatling, k6, or cloud-based solutions, depending on your budget and technical expertise.
What's the difference between load testing and stress testing?
Load testing assesses system behavior under expected load. Stress testing goes beyond the expected load to identify breaking points and system stability under extreme conditions.
How often should performance testing be conducted?
Performance testing should be conducted regularly throughout the development lifecycle, including during initial development, after significant code changes, and before major releases. It's also beneficial to perform regression testing after bug fixes.
What metrics should I track during performance testing?
Key metrics to track include response time, throughput, resource utilization (CPU, memory, network), error rates, and user satisfaction. The specific metrics will vary based on the application being tested.
What do I do if I identify a performance bottleneck?
If you identify a bottleneck, it's important to investigate the root cause. This may involve code profiling, database query optimization, infrastructure adjustments, or architectural changes. Collaboration between developers, testers, and operations is essential.
Found this Article helpful?
Construction Management Solution Demo
Build smarter, not harder! ChecklistGuro streamlines construction projects from planning to closeout. Manage tasks, inspections, safety protocols & more - all in one place. Reduce delays, improve communication, and deliver projects on time & on budget.
Related Articles
The Ultimate Concrete Vibration Checklist Template
Unlock Value: Your Free Value Engineering Checklist Template
The Ultimate HVAC Ductwork Installation Checklist Template

The Ultimate Rebar Placement Checklist Template
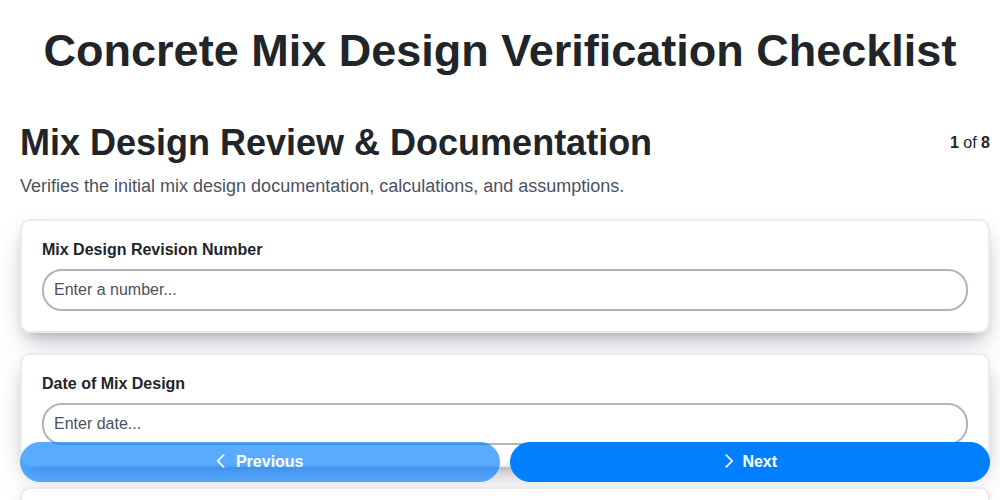
Your Concrete Mix Design Verification Checklist: A Step-by-Step Guide
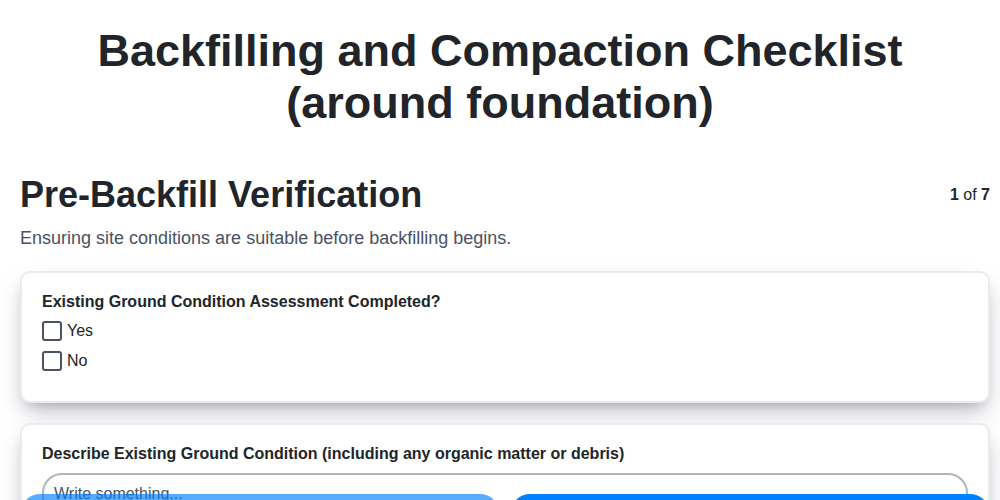
Backfilling & Compaction Checklist: A Foundation's Best Friend
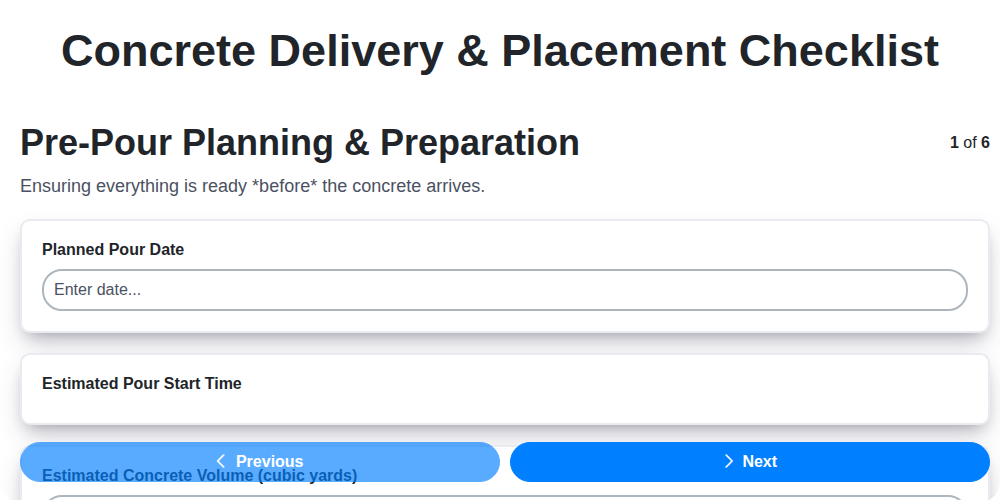
The Ultimate Concrete Delivery & Placement Checklist Template
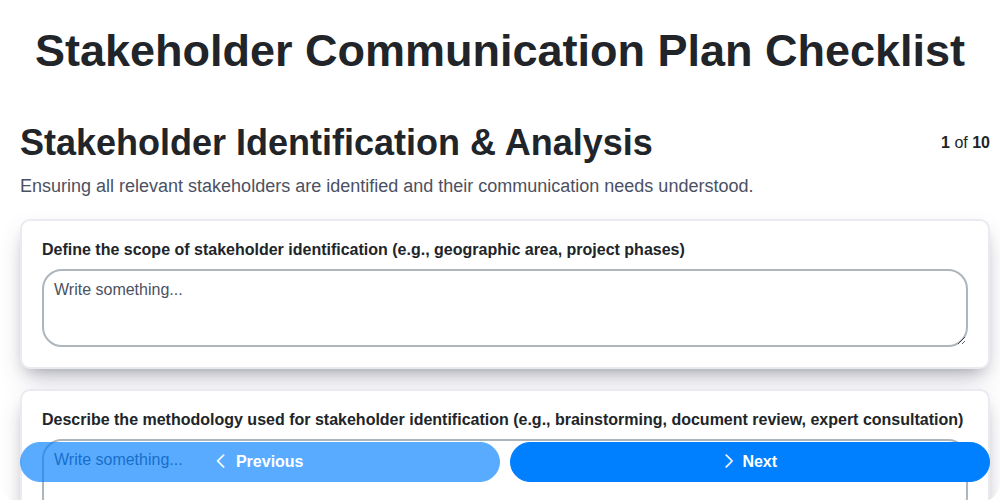
Your Ultimate Stakeholder Communication Plan Checklist Template
We can do it Together
Need help with
Construction?
Have a question? We're here to help. Please submit your inquiry, and we'll respond promptly.