Utility Utility Inspection Workflow: Smart Management for Underground & Overhead Assets
Published: 05/31/2026 Updated: 06/01/2026
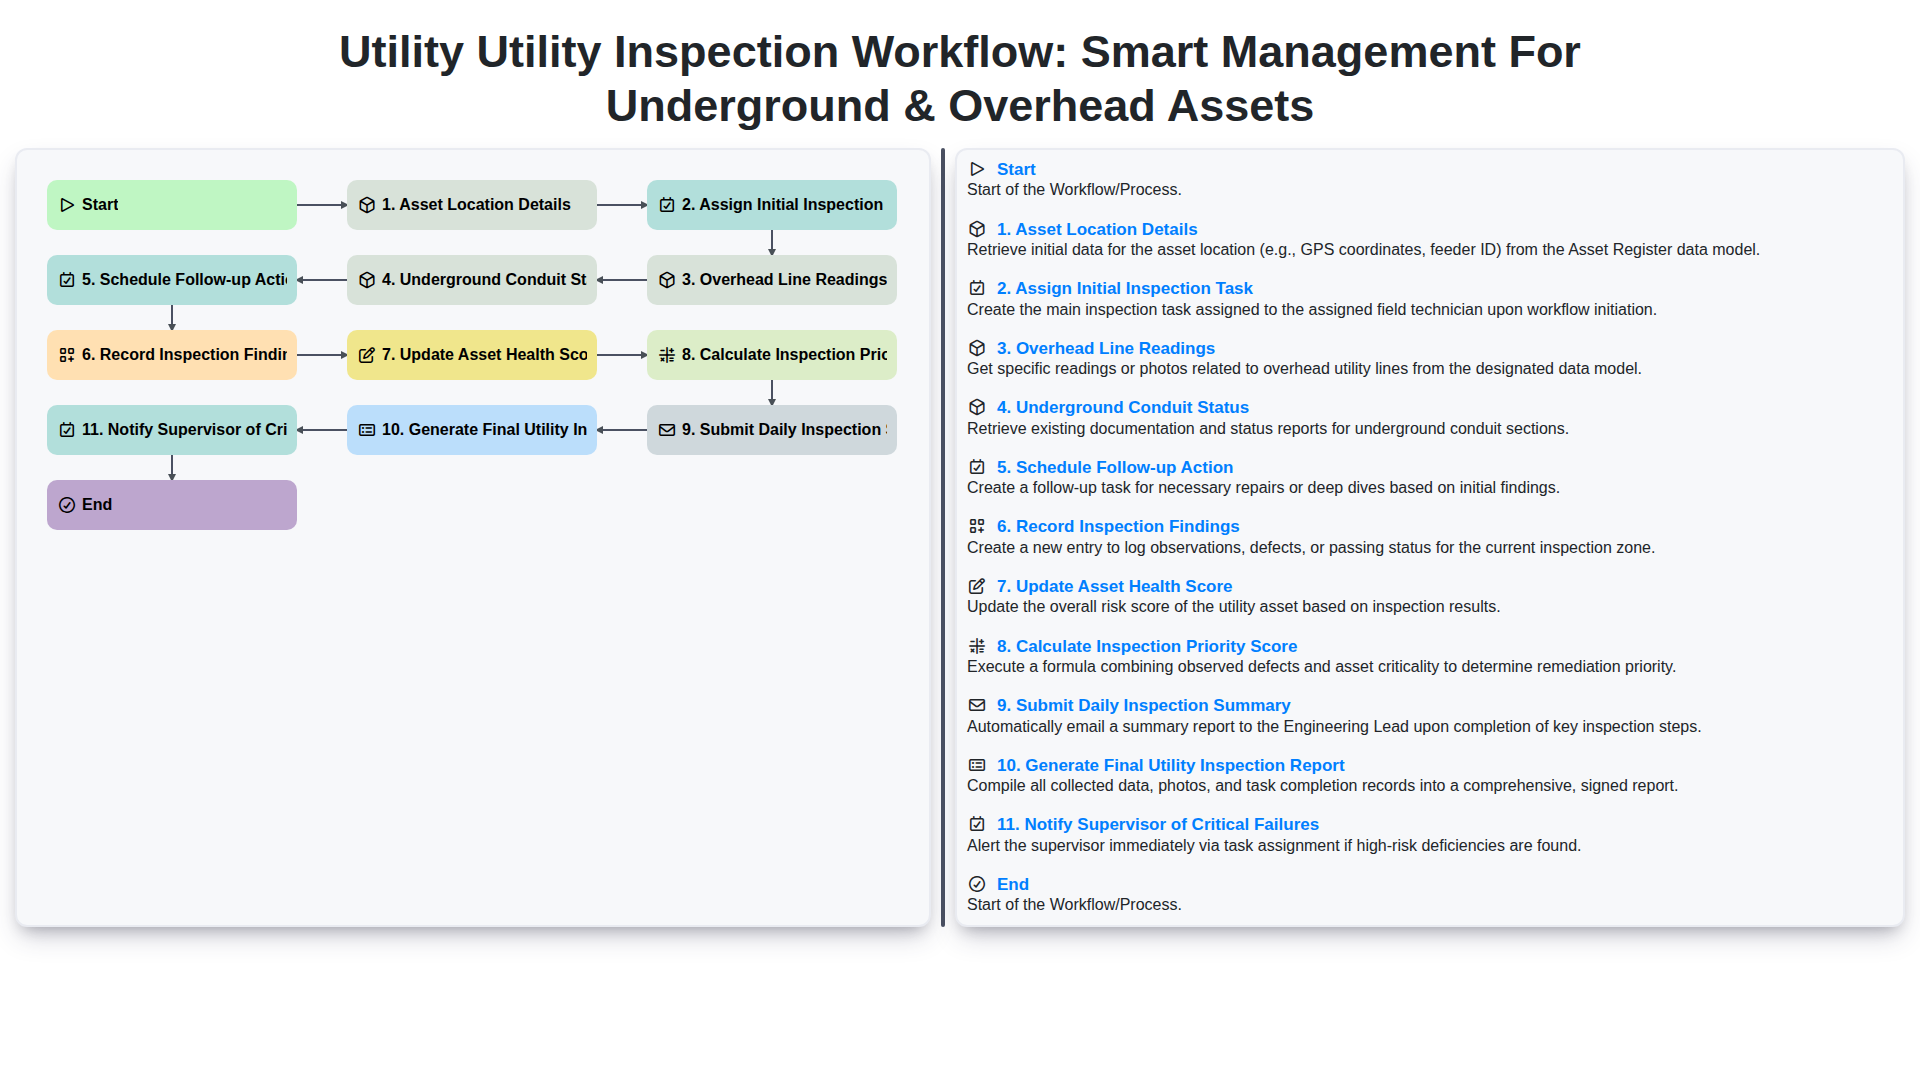
Table of Contents
- Introduction: The Importance of Structured Utility Inspection
- Phase 1: Preparation and Asset Identification
- Step 1: Capturing Precise Asset Location Details
- Step 2: Assigning Initial Inspection Tasks to Field Crews
- Phase 2: Field Execution and Data Collection
- Step 3: Assessing Overhead Line Readings
- Step 4: Evaluating Underground Conduit Status
- Step 5: Recording Detailed Inspection Findings
- Phase 3: Analysis and Risk Assessment
- Step 6: Updating Asset Health Scores
- Step 7: Calculating Inspection Priority Scores
- Phase 4: Reporting and Remediation
- Step 8: Scheduling Follow-up Actions and Repairs
- Step 9: Finalizing Summaries, Reports, and Critical Notifications
- Resources & Links
TLDR: Learn how to streamline your infrastructure maintenance with our automated inspection workflow, designed to manage both underground and overhead assets. This guide covers everything from initial task assignment and real-time data recording-such as overhead line readings and conduit status-to advanced features like automated health scoring, priority calculations, and instant supervisor notifications for critical failures.
Introduction: The Importance of Structured Utility Inspection
In the complex landscape of modern infrastructure, the reliability of utility networks is the backbone of public safety and economic stability. Whether managing sprawling overhead power lines or intricate underground conduit systems, the integrity of these assets determines the resilience of our energy, water, and communication grids. However, as infrastructure ages and environmental pressures increase, traditional, reactive maintenance models are no longer sufficient.
A disorganized approach to inspections-characterized by fragmented data and manual oversight-leaves utilities vulnerable to catastrophic failures, costly emergency repairs, and significant downtime. To mitigate these risks, organizations must transition from a fix-it-when-it-breaks mentality to a proactive, data-driven strategy. A structured inspection workflow is the key to this transformation. By implementing a standardized, systematic process, utility providers can ensure that every asset is scrutinized with precision, every anomaly is documented, and every critical risk is addressed before it escalates into a crisis. This systematic approach does more than just identify damage; it provides the actionable intelligence needed to optimize resource allocation and extend the lifecycle of vital infrastructure.
Phase 1: Preparation and Asset Identification
The foundation of a successful utility inspection lies in the precision of the initial setup. Before any boots hit the ground or drones take flight, the process begins with defining the scope and scope of the field mission. This phase focuses on two critical components: Asset Location Details and the Assign Initial Inspection Task step.
First, the workflow initiates with a comprehensive review of the asset location details. This involves verifying geospatial data, GPS coordinates, and digital mapping to ensure inspectors are directed to the exact coordinates of the underground conduits or overhead lines. Accuracy at this stage is paramount; even a minor error in location data can lead to significant delays and increased operational costs.
Once the targets are clearly identified, the workflow moves into the assignment stage. Through a centralized management system, supervisors Assign Initial Inspection Tasks to the appropriate field crews. This step is not merely about delegation; it is about matching the complexity of the asset with the specific expertise of the inspector. By digitally distributing tasks with specific instructions and safety protocols, the organization ensures that every team member enters the field with a clear, standardized roadmap for the inspection ahead.
Step 1: Capturing Precise Asset Location Details
The foundation of any reliable inspection workflow lies in the accuracy of your starting data. The first step in the process involves capturing precise Asset Location Details, ensuring that every overhead line and underground conduit is mapped to its exact geographic coordinates. By utilizing high-precision GPS integration and spatial data tagging, field technicians can eliminate the ambiguity often associated with aging infrastructure. This stage isn't just about marking a spot on a map; it is about creating a digital twin of the asset's physical position, which allows for seamless integration with GIS (Geographic Information Systems) and ensures that subsequent inspection data is tethered to the correct piece of infrastructure. Without this precise baseline, even the most advanced inspection findings lose their utility.
Step 2: Assigning Initial Inspection Tasks to Field Crews
Once the asset location details are verified, the next critical phase of the workflow begins: Assigning Initial Inspection Tasks to field crews. Efficient utility management relies on getting the right information to the right person at the right time.
Rather than relying on manual dispatch or disorganized communication, a smart workflow automates the distribution of work orders based on real-time data. By digitally pushing precise GPS coordinates and specific inspection parameters directly to mobile devices, you eliminate the guesswork for field technicians. This stage ensures that every crew member arrives at the site with a clear understanding of the scope of work-whether they are tasked with checking overhead line tension or verifying underground conduit integrity-thereby reducing transit time and maximizing the number of inspections completed per shift.
Phase 2: Field Execution and Data Collection
Once the inspection tasks are dispatched, the focus shifts from planning to active fieldwork. This phase is the most critical stage of the workflow, as the accuracy of the entire management system depends on the precision of the data captured on-site.
The execution begins with verifying Asset Location Details, ensuring that inspectors are positioned at the exact GPS coordinates of the target infrastructure. For overhead assets, technicians perform Overhead Line Readings, capturing vital data such as sag, clearance, and insulator condition. Simultaneously, for subsurface assets, the process involves assessing Underground Conduit Status to identify potential blockages, moisture ingress, or structural degradation.
As inspectors move through their routes, they must meticulously Record Inspection Findings within the digital interface, documenting any anomalies or visible defects in real-time. This granular data collection ensures that the transition from physical observation to digital intelligence is seamless, providing the raw material needed for the subsequent analytical phases of the workflow.
Step 3: Assessing Overhead Line Readings
Once the inspection task has been assigned, the focus shifts to the detailed evaluation of overhead infrastructure. Assessing Overhead Line Readings is a critical phase where technicians examine the integrity of conductors, insulators, and support structures. This step involves utilizing specialized tools-such as thermal imaging cameras and high-resolution sensors-to detect anomalies like hot spots, corrosion, or structural fatigue that aren't visible to the naked eye. By capturing precise voltage levels and physical alignment data, teams can identify potential points of failure before they lead to outages, ensuring the stability of the power grid and minimizing the risk of environmental damage or service interruptions.
Step 4: Evaluating Underground Conduit Status
Once the visual inspection of the surface area is complete, the focus shifts to the critical, unseen components of the network. Evaluating underground conduit status involves a detailed assessment of the integrity of the pathways that house essential cabling and piping. During this step, technicians utilize specialized diagnostic tools-such as ground-penetrating radar (GPR), borescope cameras, or acoustic sensors-to detect anomalies within the conduit. The goal is to identify signs of soil erosion, water ingress, structural deformation, or blockages that could compromise the long-term stability of the utility. By accurately documenting the condition of these buried assets, the workflow ensures that potential points of failure are identified before they escalate into costly excavation repairs or service outages.
Step 5: Recording Detailed Inspection Findings
Once the physical inspection of the assets is complete, the focus shifts to documentation. Recording inspection findings is perhaps the most critical stage of the workflow, as the quality of your data directly impacts the reliability of your entire maintenance strategy.
During this step, inspectors must move beyond simple checklists and capture granular, real-time data. For overhead lines, this includes documenting specific observations regarding insulator wear, vegetation encroachment, or hardware corrosion. For underground assets, this involves logging precise conduit status, such as the presence of moisture, structural integrity of casing, or any signs of soil subsidence.
To ensure consistency and eliminate human error, modern workflows utilize digital forms that support:
- Multimedia Evidence: Attaching high-resolution photos and thermal imagery to specific asset IDs.
- Standardized Annotations: Using predefined status codes (e.g., Stable, Degraded, or Critical) to ensure data uniformity across different field crews.
- Contextual Metadata: Automatically capturing GPS coordinates and timestamps to verify the exact time and location of the observation.
By meticulously documenting every anomaly and observation during this phase, you create a digital twin of the asset's current state, providing the foundation for the automated scoring and prioritization that follows in the next steps of the workflow.
Phase 3: Analysis and Risk Assessment
Once the raw data has been collected from the field, the workflow shifts from data collection to intelligent evaluation. This is where the true value of a smart management system is realized. During this phase, the system processes the captured readings and status updates to transform observations into actionable intelligence through several critical sub-steps:
- Update Asset Health Score: Every inspection finding is fed back into the central database to recalibrate the health score of the specific asset. By integrating real-time data-such as the degradation level of an underground conduit or the physical state of an overhead insulator-the system provides a continuous, live view of the infrastructure's integrity.
- Calculate Inspection Priority Score: Not all maintenance needs are equal. The system utilizes the updated health scores alongside environmental factors and criticality levels to calculate a dynamic Priority Score. This ensures that resources are not wasted on low-risk assets, but instead concentrated on the components most likely to cause service interruptions.
- Schedule Follow-up Action: Based on the newly calculated priority, the workflow automatically triggers follow-up tasks. If an asset falls below a specific threshold, the system generates a maintenance work order or a secondary, more detailed inspection request, ensuring that no critical degradation goes unaddressed.
Step 6: Updating Asset Health Scores
Once the raw inspection data is recorded, the workflow moves into a critical analytical phase: Updating the Asset Health Score. This step transforms qualitative observations into quantitative intelligence.
A health score is not merely a static number; it is a dynamic metric that reflects the real-time condition of your infrastructure. By integrating findings from both overhead line readings and underground conduit status, the system automatically recalibrates the health index of each specific asset. For instance, if a technician identifies significant corrosion on an overhead insulator or moisture ingress in an underground conduit, the algorithm processes this degradation and lowers the asset's score accordingly.
Updating these scores in real-time is vital for transitionary maintenance. It moves your team away from gut-feeling repairs and toward a data-driven strategy. This continuous recalculation ensures that your asset registry always provides an accurate, up-to-date snapshot of your network's integrity, allowing you to identify which components are nearing the end of their lifecycle before they result in costly service interruptions.
Step 7: Calculating Inspection Priority Scores
Once the inspection findings are recorded and the health scores are updated, the system moves into the critical phase of data-driven decision-making: Calculating Inspection Priority Scores.
Rather than treating all identified issues with the same level of urgency, this step uses a specialized algorithm to weigh the severity of the inspection findings against the criticality of the asset. By analyzing variables such as the asset's age, the degree of degradation (e.g., corrosion levels in underground conduits or sag in overhead lines), and the potential impact of a failure on the surrounding community, the workflow generates a dynamic priority score.
This automated calculation eliminates guesswork and human bias, ensuring that maintenance crews are directed toward the most high-risk assets first. This transition from raw data to actionable intelligence is what transforms a standard inspection into a truly smart management strategy, allowing utility providers to prevent catastrophic failures before they occur.
Phase 4: Reporting and Remediation
Once the physical inspections are complete, the focus shifts from data collection to actionable intelligence. This phase is where raw field observations are transformed into strategic management decisions through a structured reporting and remediation process.
The workflow follows a systematic sequence to ensure no critical detail is overlooked:
- Record Inspection Findings & Update Asset Health Score: Every observation made during the assessment is logged into the central system. This data is immediately used to recalculate the Asset Health Score, providing a real-time metric of the structural integrity of both overhead lines and underground conduits.
- Calculate Inspection Priority Score: By integrating health scores with asset criticality, the system automatically generates a Priority Score. This allows utility managers to distinguish between routine maintenance and urgent repairs, ensuring resources are allocated where they are needed most.
- Notify Supervisor of Critical Failures: Speed is vital when dealing with infrastructure risks. If an inspection reveals a high-risk anomaly, an automated alert is triggered to Notify Supervisors of Critical Failures, enabling immediate intervention to prevent outages or safety hazards.
- Schedule Follow-up Action: For assets that do not require immediate emergency repair but show signs of degradation, a follow-up task is automatically created in the maintenance queue, ensuring continuous monitoring.
- Submit Daily Inspection Summary & Generate Final Utility Inspection Report: To maintain a complete audit trail, inspectors Submit a Daily Inspection Summary at the end of each shift. This data is then aggregated to Generate the Final Utility Inspection Report, a comprehensive document that provides stakeholders with a transparent, high-level overview of the entire network's status.
By automating the transition from field data to formal reporting, this phase eliminates manual entry errors and ensures that utility providers can move from detection to resolution with unprecedented speed.
Step 8: Scheduling Follow-up Actions and Repairs
Once the inspection data has been analyzed, the workflow transitions from observation to action. The Schedule Follow-up Action phase is critical for ensuring that identified vulnerabilities do not escalate into costly system failures. Based on the real-time data collected during the overhead and underground assessments, maintenance teams can preemptively assign repair crews to specific sites. This step transforms raw inspection data into a proactive maintenance strategy, allowing for the organized deployment of resources to address everything from minor line adjustments to urgent conduit repairs before they impact the wider utility network.
Step 9: Finalizing Summaries, Reports, and Critical Notifications
The final stage of the utility inspection workflow is where raw field data is transformed into actionable organizational intelligence. Once the individual inspection tasks are complete, the process moves into a critical synthesis phase to ensure transparency and rapid response.
First, the system automates the Submission of the Daily Inspection Summary, consolidating all completed tasks from the day into a single, unified overview. This prevents data silos and ensures that the operations team has a real-time pulse on field progress. Following this, the system Generates the Final Utility Inspection Report. This comprehensive document integrates all captured data-from overhead line readings to underground conduit statuses-providing a detailed audit trail that serves as the definitive record for regulatory compliance and long-term asset planning.
However, the most vital component of this final stage is the automated safety net: the system is configured to Notify Supervisors of Critical Failures immediately. If an inspection reveals a high-risk anomaly or a sudden drop in an asset's health score, an instant alert is triggered. This ensures that critical vulnerabilities are never buried in a report, but are instead met with immediate intervention, minimizing the risk of service outages or infrastructure failure.
Resources & Links
- IEEE Standards Association: Industry-standard protocols and technical guidelines for maintaining the safety and reliability of electrical power systems and overhead line maintenance.
- USGS GIS Resources: Essential tools and spatial data frameworks for capturing precise asset location details and mapping underground conduit networks.
- Esri ArcGIS for Utilities: Advanced geospatial technology for managing asset health scores, tracking inspection workflows, and visualizing utility infrastructure.
- OSHA Utility Safety Guidelines: Regulatory compliance resources for field crews performing inspections on overhead lines and high-risk underground assets.
- IBM Watson IoT & Predictive Maintenance: AI-driven insights for calculating inspection priority scores and automating the notification of critical infrastructure failures.
- Autodesk Asset Management Solutions: Digital twin and BIM technologies for tracking the lifecycle and physical status of complex utility networks.
Found this Article helpful?
Audit/Inspection Management Solution Demo
Ensure compliance & improve performance! ChecklistGuro streamlines audit/inspection creation, execution, and reporting. Reduce risk, enhance quality, & maintain consistency. Manage it all with our Work OS.
Related Articles
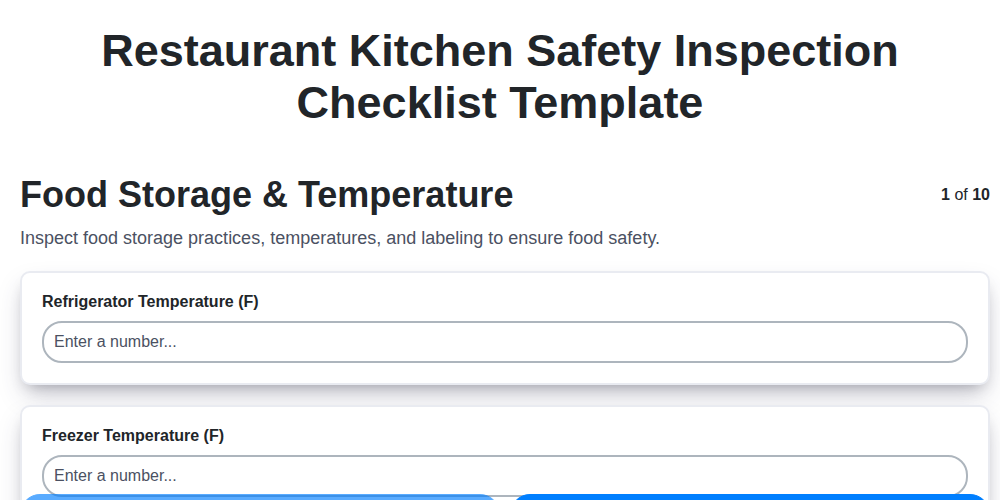
Restaurant Kitchen Safety Inspection Checklist Template
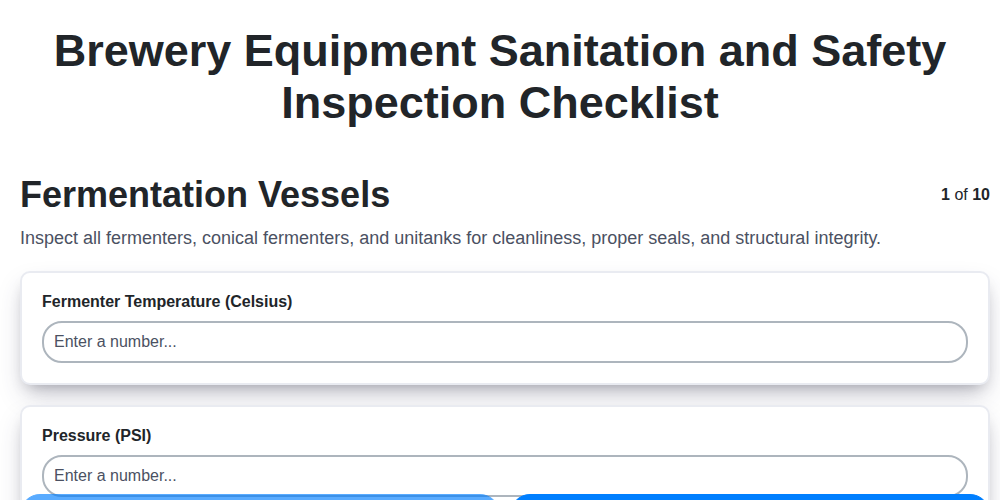
The Ultimate Brewery Equipment Sanitation & Safety Checklist Template
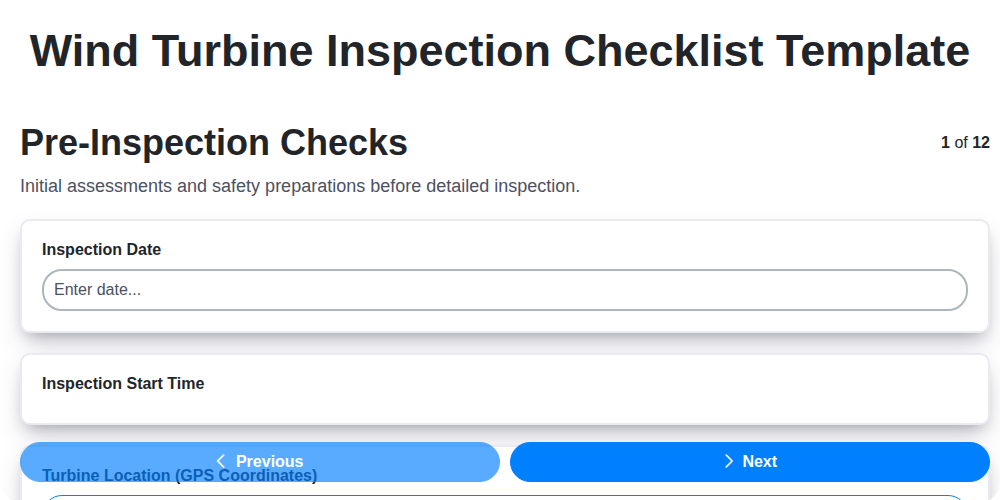
Wind Turbine Inspection Checklist Template: Your Comprehensive Guide
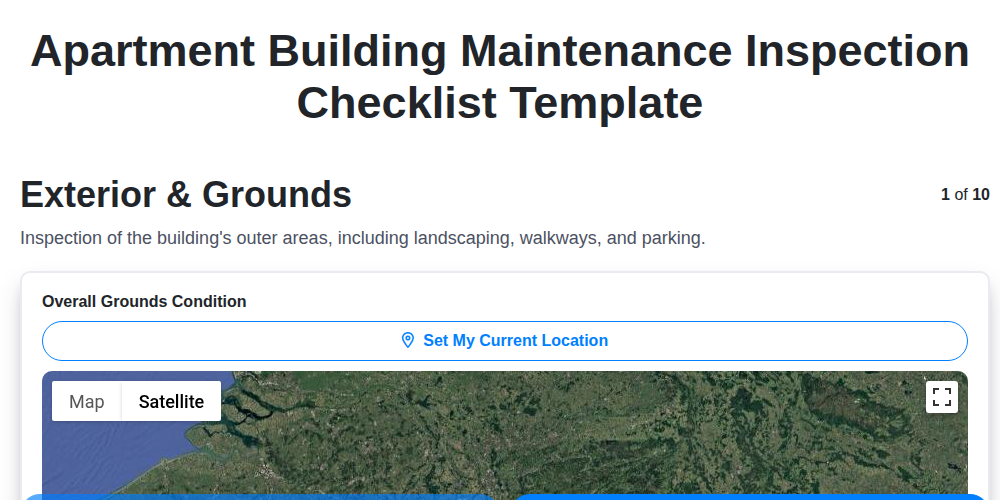
The Ultimate Apartment Building Maintenance Inspection Checklist Template
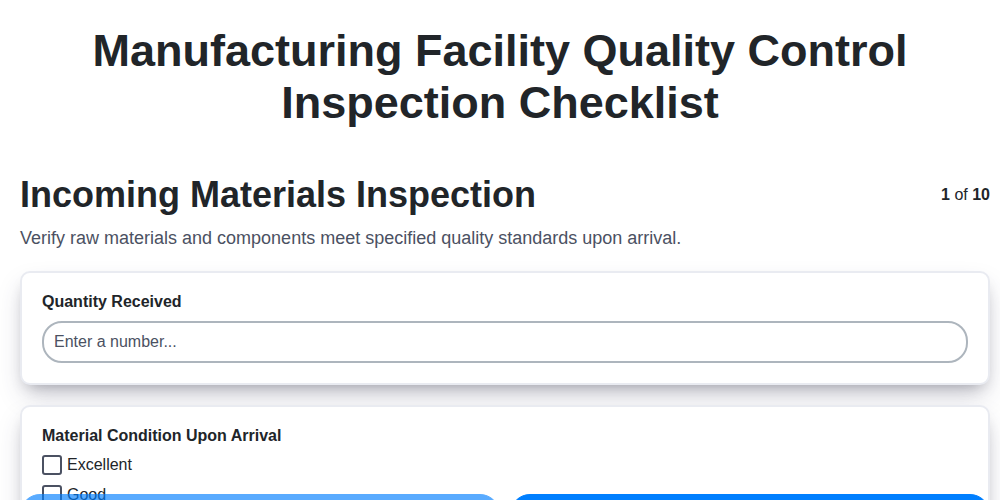
Your Essential Guide to a Manufacturing Quality Control Inspection Checklist
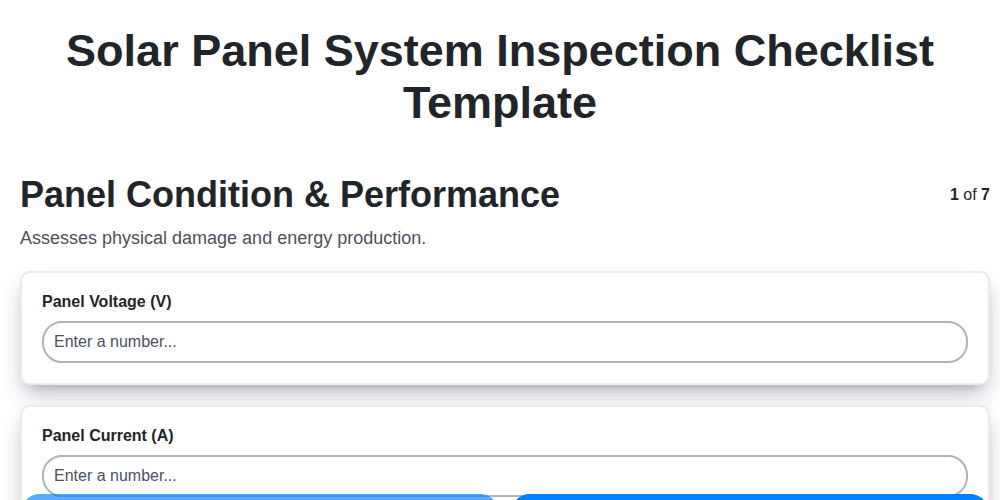
The Ultimate Solar Panel Inspection Checklist Template
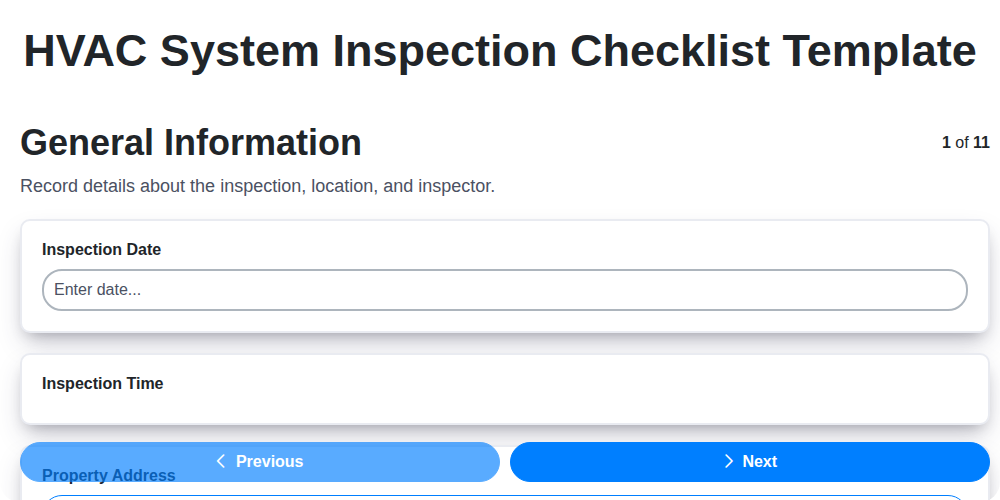
Your Ultimate HVAC Inspection Checklist Template
The Ultimate Data Center Inspection Checklist Template
We can do it Together
Need help with
Checklists?
Have a question? We're here to help. Please submit your inquiry, and we'll respond promptly.