Mastering Forecast Accuracy: Your MRP Review Checklist Template
Published: 12/14/2025 Updated: 12/15/2025
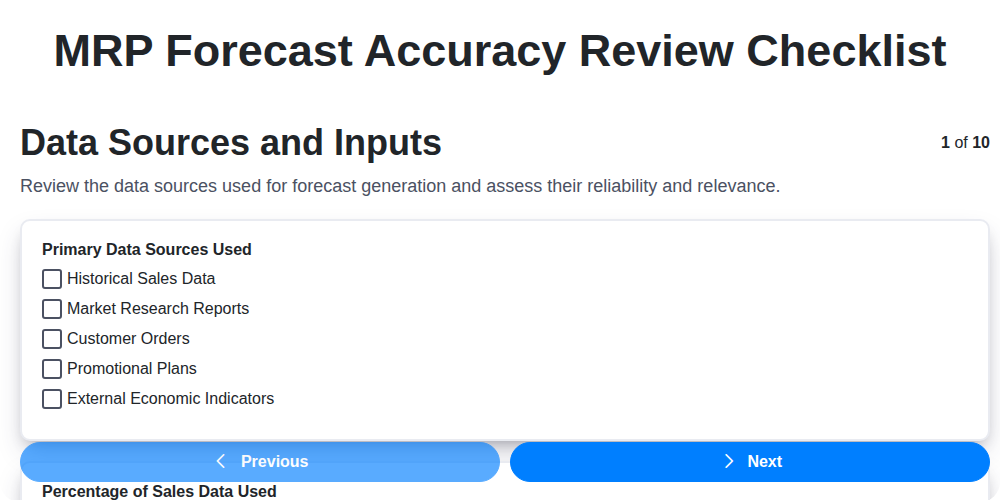
Table of Contents
- Introduction: Why MRP Forecast Accuracy Matters
- 1. Data Sources and Inputs: The Foundation of Accurate Forecasts
- 2. Understanding Your Forecast Methodologies
- 3. Deep Dive: Historical Data Analysis
- 4. Measuring Performance: Forecast Error Metrics
- 5. The Power of Collaboration: Collaborative Forecast Review
- 6. Validating Demand Signals: Are Your Assumptions Correct?
- 7. System Configuration Audit: Is Your System Working as Expected?
- 8. Exception Reporting: Identifying Forecast Anomalies
- 9. Root Cause Analysis: Digging Beneath the Surface
- 10. Continuous Improvement: A Cycle of Refinement
- 11. Key Roles and Responsibilities in Forecast Accuracy
- 12. Documenting Your Forecast Review Process
- Conclusion: Achieving MRP Forecasting Excellence
- Resources & Links
TLDR: Struggling with inaccurate MRP forecasts? This checklist template guides you through a comprehensive review, from data sources and forecasting methods to error metrics and root cause analysis. It's your roadmap to boosting forecast accuracy, minimizing waste, and optimizing your production planning - all in one easy-to-follow format!
Introduction: Why MRP Forecast Accuracy Matters
Accurate Material Requirements Planning (MRP) is the backbone of efficient production and inventory management. At its core lies the forecast - a prediction of future demand. While forecasting is inherently imperfect, consistently inaccurate forecasts can trigger a cascade of negative consequences. Think stockouts leading to lost sales and frustrated customers, or conversely, excess inventory tying up capital and risking obsolescence.
Beyond the immediate financial impact, poor forecast accuracy disrupts the entire supply chain, impacting supplier relationships, increasing production costs, and ultimately eroding profitability. This isn't just about numbers; it's about operational efficiency, customer satisfaction, and the overall health of your business. Regularly reviewing and refining your MRP forecast accuracy is not just a best practice, it's a necessity for sustainable success. This post will guide you through a comprehensive checklist to ensure your forecasts are as reliable as possible.
1. Data Sources and Inputs: The Foundation of Accurate Forecasts
Garbage in, garbage out. This old adage rings especially true when it comes to Material Requirements Planning (MRP) forecasts. Your forecast is only as good as the data feeding it. A rigorous review of your data sources and inputs is the vital first step in ensuring forecast accuracy.
Let's dive into what to examine:
- Internal Sales Data: This is your core. Scrutinize historical sales data by product, location, and time period. Are there any inconsistencies, missing data, or unusual spikes that need explanation?
- Marketing Promotions: Did past promotions significantly impact sales? Ensure these promotional periods are accurately captured and accounted for in your historical data and future projections. Don't forget to include planned upcoming promotions!
- Pricing Changes: How have past pricing adjustments affected demand? Document these changes and their impact on sales volume.
- New Product Introductions: New product launches inherently disrupt historical patterns. How were these initial sales treated? Are they influencing ongoing forecasts?
- External Market Data: Consider relevant external data like economic indicators, industry trends, competitor activities, and seasonality. How are these factors incorporated, or could they be?
- Customer Input: Gather information directly from your key customers regarding upcoming demand or potential shifts. This qualitative data can be invaluable.
- Data Integrity Checks: Are data sources reliable? Are there automated validation checks in place to identify and correct errors before they impact the forecast?
A thorough assessment of these inputs, and a documented process for their management, is crucial for establishing a solid foundation for accurate MRP forecasting.
2. Understanding Your Forecast Methodologies
Your choice of forecasting methodologies is the bedrock of accurate MRP forecasts. It's rarely a one-size-fits-all situation; different products, regions, and time horizons often demand different approaches. This section isn't just about which methodologies you use, but why you chose them.
Let's break down key considerations:
- Methodology Variety: Are you relying solely on simple moving averages, or do you incorporate more sophisticated techniques like exponential smoothing, ARIMA models, or even machine learning algorithms? A diversified approach, tailored to different product categories (e.g., mature vs. new items), is often best.
- Statistical vs. Qualitative: Do you lean heavily on statistical forecasting, or do you incorporate expert judgment and sales team insights? A balanced blend typically yields superior results. Document how qualitative adjustments are applied and who is responsible for making them.
- Software Capabilities: Does your MRP system support the methodologies you want to employ? Understand its limitations and explore potential integrations with specialized forecasting tools if necessary.
- Justification & Documentation: Crucially, document why you selected each methodology for each product or product group. This documentation should include the assumptions you made and how those assumptions were validated. Future review will be easier with a clear understanding of the initial logic.
- Regular Evaluation: Methods aren't static. Regularly assess their effectiveness. Are they still delivering accurate forecasts? Are underlying assumptions still valid? Be prepared to adjust or replace methodologies as needed.
3. Deep Dive: Historical Data Analysis
Before you can even begin to assess your forecast accuracy, you need to understand the data driving it. Historical data analysis is more than just looking at numbers; it's about uncovering patterns, identifying trends, and spotting anomalies that can significantly impact your forecast.
Here's what a thorough historical data analysis should involve:
- Data Segmentation: Don't treat all your data the same. Segment your historical data by product category, region, customer segment, or any other relevant factor. This allows you to identify unique demand profiles.
- Trend Identification: Use visualizations (charts, graphs) to visually confirm upward or downward trends over time. Are sales generally increasing, decreasing, or fluctuating seasonally?
- Seasonality Assessment: Identify recurring seasonal patterns (e.g., peak holiday sales, summer dips). Quantify the magnitude of these patterns to build them into your forecasts.
- Outlier Detection: Look for unusual spikes or drops in demand. Investigate these outliers - were they due to promotions, disruptions, or one-off events? Document them, as they can inform future forecasts.
- Data Integrity Check: Ensure data accuracy and completeness. Missing or inaccurate data can skew historical trends and lead to flawed forecasts. Look for data entry errors, system glitches, or inconsistent units of measure.
- Consider External Factors: Beyond internal sales data, examine external factors that might have influenced demand - economic indicators, competitor actions, marketing campaigns, or even weather patterns. Correlating these external factors with historical sales data can improve forecast accuracy.
- Data Aging: Be mindful of data aging. Demand patterns change over time. Very old data might not be relevant to current forecasts. Determine a reasonable timeframe for your historical data based on product lifecycle and market volatility.
Ultimately, the insights gleaned from historical data analysis form the foundation for a more accurate and reliable forecasting process.
4. Measuring Performance: Forecast Error Metrics
Understanding how accurate your MRP forecasts are requires more than just a feeling - you need concrete metrics. These metrics provide quantifiable evidence of forecast performance, allowing you to identify areas for improvement and track the effectiveness of your changes. Here's a breakdown of key metrics to consider:
- Mean Absolute Deviation (MAD): This calculates the average absolute difference between the forecasted values and the actual demand. It's easy to understand and provides a general indication of forecast error magnitude. Lower MAD values indicate better accuracy.
- Mean Squared Error (MSE): MSE gives more weight to larger errors, penalizing significant discrepancies more heavily than smaller ones. It's useful when large errors are particularly costly.
- Root Mean Squared Error (RMSE): The square root of MSE, RMSE brings the metric back into the original units of measurement, making it easier to interpret. Like MSE, it emphasizes larger errors.
- Mean Absolute Percentage Error (MAPE): This metric expresses forecast error as a percentage of actual demand. It's useful for comparing forecast accuracy across different products or time periods with varying demand volumes. Important note: MAPE can be misleading when actual demand is close to zero.
- Bias: This assesses whether the forecasts consistently over- or under-predict demand. A positive bias means forecasts are consistently too high, while a negative bias indicates consistent underestimation.
- Tracking Signal: This measures the consistency of your forecast errors. A high tracking signal suggests unpredictable errors, potentially indicating issues with the forecasting model itself.
Remember to establish baseline values for these metrics and track them over time to monitor your progress. Don't just look at the numbers - analyze the trends and patterns to understand what's driving the errors.
5. The Power of Collaboration: Collaborative Forecast Review
Forecasting isn's a solo act. Silos breed inaccuracy. Truly effective MRP forecasting relies heavily on collaborative review sessions involving diverse teams. This isn't just about presenting numbers; it's about sharing insights and leveraging collective expertise.
Who should be involved? Think beyond just the forecasting team. Sales, marketing, operations, supply chain, and even key customer representatives can offer invaluable perspectives. Sales can provide insights into upcoming promotions, marketing can highlight campaign impacts, and operations can flag potential production constraints.
These reviews should be a two-way street. The forecasting team needs to actively solicit feedback, listen to concerns, and incorporate new information. Encourage open dialogue and challenge assumptions. Ask questions like: Are there any upcoming events we're not accounting for?, How will this promotional activity affect demand?, and Are there any known supply chain risks that might impact availability?.
The outcome isn't just a refined forecast, but a shared understanding of the underlying drivers of demand and a stronger alignment across departments. Document these collaborative decisions and the rationale behind them - this transparency is crucial for future reference and learning. Remember, the goal is to move beyond individual forecasts to a collaborative demand plan.
6. Validating Demand Signals: Are Your Assumptions Correct?
Your forecast is only as good as the information feeding into it. While sophisticated methodologies and historical data are crucial, ignoring the pulse of actual customer demand is a recipe for disaster. This is where demand signal validation comes in. It's about critically evaluating real-time information and ensuring it aligns with your forecasts.
What constitutes a demand signal? It's any information that provides insight into future customer demand. Think beyond just sales history. Consider:
- Point-of-Sale (POS) Data: Real-time sales data from retailers, often broken down by SKU and location.
- Customer Orders/Backorders: A direct indication of immediate demand and potential future needs.
- Marketing Promotions: Planned promotions heavily influence demand - integrate them into your forecasting process and monitor their actual impact.
- Sales Team Feedback: Your sales team is on the front lines. Their insights on customer conversations, planned deals, and competitor activity are invaluable.
- Social Media & Web Analytics: While trickier to quantify, these platforms can reveal emerging trends and shifts in customer sentiment.
- External Data: Economic indicators, weather forecasts (for relevant industries), and competitor activity can all influence demand.
How to Validate:
- Regularly Compare: Don't just look at demand signals; compare them to your forecast. Are they converging or diverging? Significant deviations warrant investigation.
- Establish Thresholds: Define acceptable ranges of deviation. When signals fall outside these ranges, it's a red flag.
- Question Assumptions: When deviations occur, challenge the assumptions underpinning your forecast. Were promotional plans accurate? Did you factor in a new competitor?
- Feedback Loop: Create a process for sales and marketing to directly contribute to forecast adjustments based on observed demand signals.
7. System Configuration Audit: Is Your System Working as Expected?
Your MRP system is only as good as its configuration. A seemingly minor misconfiguration can silently erode forecast accuracy, leading to stockouts, excess inventory, and ultimately, lost revenue. This audit isn't about blaming the system, but ensuring it's truly supporting your forecasting process.
Here's what to check:
- Parameter Settings: Review critical parameters like forecast horizon, smoothing constants, and weighting factors used in your chosen forecasting algorithms. Are these still appropriate given recent demand patterns and product lifecycle stages?
- Data Integration: Verify the accuracy and timeliness of data feeds from all your data sources (sales data, POS data, promotional calendars, etc.). Errors or delays here directly impact forecast quality.
- User Access and Permissions: Ensure the right people have the right level of access. Overly restrictive access hinders collaboration, while excessive access can lead to accidental data corruption.
- Algorithm Selection: Are you using the optimal forecasting algorithm for each SKU? Some products might be better suited to moving averages, while others might require more complex methods.
- Seasonality Settings: Correctly define seasonality patterns - weekly, monthly, or annual - for each product. Incorrect settings will render your forecasts unreliable.
- Exception Handling: Are system-generated exceptions (e.g., statistical warnings, forecast overrides) handled appropriately and investigated regularly?
Regularly scheduled system configuration audits, ideally combined with user feedback, will keep your MRP system aligned with your evolving business needs and contribute significantly to improved forecast accuracy.
8. Exception Reporting: Identifying Forecast Anomalies
Exception reporting is your early warning system for forecast inaccuracies. It's not enough to just run a monthly review; you need automated alerts that highlight when the forecast deviates significantly from actuals or established thresholds. This proactive approach allows you to investigate and address potential problems before they impact production, inventory, and ultimately, customer satisfaction.
What constitutes an exception? Define clear parameters based on your business needs. Examples include:
- Significant Variance: Forecasts that differ by a defined percentage (e.g., +/- 10%) from actual sales or production.
- Trend Changes: Unexpected shifts in demand patterns that aren't reflected in the current forecast.
- Seasonality Discrepancies: Deviations from expected seasonal trends.
- Promotional Impacts: Unexpected performance during promotional periods.
- New Product/Phase-in Issues: Significant differences between forecasted and actual demand for newly introduced products.
Your system should automatically generate these alerts, categorized by severity. Don't just flag every minor fluctuation; focus on the exceptions that require immediate attention. Document these exceptions meticulously, noting the item, date range, variance, and potential causes. This documentation forms a valuable historical record for trend analysis and root cause identification. Regularly review exception reports with stakeholders - supply planners, sales, marketing - to ensure prompt investigation and corrective action.
9. Root Cause Analysis: Digging Beneath the Surface
Once exceptions are flagged and reviewed, simply fixing the immediate issue isn't enough. A robust MRP forecast accuracy review process demands a deep dive - a Root Cause Analysis (RCA). This isn't about blame; it's about identifying why the forecast went wrong and preventing recurrence.
Start by forming a cross-functional team - include representatives from sales, marketing, planning, and even production. Use the data gathered during previous checklist steps (historical data, error metrics, collaborative reviews) to build a timeline of events leading up to the forecast deviation.
Techniques for RCA can include:
- The 5 Whys: Repeatedly asking "Why?" to drill down to the fundamental cause.
- Fishbone Diagram (Ishikawa Diagram): Visually mapping out potential causes categorized by areas like manpower, methods, materials, machinery, environment, and measurement.
- Pareto Analysis: Identifying the vital few causes contributing to the majority of the errors.
Consider these common root causes:
- Data Quality Issues: Inaccurate or incomplete data feeding the forecasting models.
- Lack of Communication: Siloed departments not sharing crucial market intelligence.
- Model Limitations: Using outdated or inappropriate forecasting methodologies.
- External Factors: Unexpected events (economic shifts, competitor actions, supply chain disruptions) not factored into the forecast.
- Process Weaknesses: Gaps in the forecast review process or a lack of defined escalation procedures.
Document your findings and, crucially, define specific, measurable, achievable, relevant, and time-bound (SMART) corrective actions. Assign ownership for these actions and track their implementation to ensure the identified root causes are truly addressed.
10. Continuous Improvement: A Cycle of Refinement
The MRP forecast accuracy journey isn't a destination; it's a continuous cycle. Implementing the previous steps-data validation, methodology reviews, error analysis-provides a valuable snapshot of your current performance. However, the real gains come from actively using those insights to drive ongoing improvement.
This means establishing a structured process for incorporating lessons learned. Schedule regular reviews (perhaps quarterly, or even more frequently if needed) to discuss:
- What worked well? Identify successes and document them to replicate.
- What didn't work? Don't shy away from acknowledging shortcomings.
- What adjustments can we make? This could involve refining forecast models, improving data quality, adjusting weighting factors, or revisiting assumptions.
- Who is responsible for these changes? Assign ownership and deadlines to ensure accountability.
- How will we measure the impact of these changes? Track key metrics to quantify the effectiveness of your improvements.
Foster a culture of experimentation and learning. Encourage team members to propose new ideas and be willing to test them (in a controlled environment, of course). Document all changes made, the rationale behind them, and the resulting impact. This creates a valuable knowledge base that can be leveraged for future improvements. Remember, a proactive, iterative approach is key to achieving and maintaining high forecast accuracy.
11. Key Roles and Responsibilities in Forecast Accuracy
Achieving accurate MRP forecasts isn't a solo effort; it requires a collaborative team with clearly defined roles. Here't a breakdown of essential contributors and their responsibilities:
- Demand Planner: The central figure, responsible for developing and maintaining the forecast. They aggregate data, select appropriate methodologies, and translate demand signals into actionable forecasts. They own the forecast accuracy performance and drive improvement initiatives.
- Sales Team: Provides critical insights into upcoming promotions, new product launches, customer orders, and market trends. Their ground-level understanding is invaluable for adjusting the baseline forecast and identifying potential biases.
- Marketing Team: Shares marketing plans, advertising campaigns, and promotional activities. This information directly impacts demand and must be incorporated into the forecast.
- Supply Chain Manager: Ensures the forecast aligns with production capacity, inventory levels, and overall supply chain constraints. They contribute to demand signal validation and exception reporting.
- Production Planning: Uses the forecast to create production schedules and manage manufacturing resources. Feedback from production regarding accuracy issues is vital for forecast refinement.
- Master Data Owners: Responsible for maintaining the accuracy and integrity of product data, customer information, and other critical inputs used in the forecasting process.
- IT/System Administrator: Ensures the forecasting system is properly configured, maintained, and integrated with other enterprise systems. They assist with data access and troubleshooting.
- Finance Team: Provides financial context and may participate in demand planning review meetings to understand the implications of forecast changes on revenue and profitability.
Defining these roles and fostering open communication across departments is essential for a successful MRP forecasting process.
12. Documenting Your Forecast Review Process
A robust MRP forecast accuracy review isn't just about identifying errors; it's about understanding why they occurred and ensuring consistent, repeatable improvements. That's where meticulous documentation becomes invaluable. Your documentation should act as a living record of your review process, readily accessible to the team and easily updated as your methodologies evolve.
Here's what to include:
- Checklist Record: A clear record of each review, noting the date, attendees, and a summary of the checklist items completed (referencing specific findings from each).
- Decisions & Actions: Critically, document all decisions made during the review, along with the specific actions assigned to individuals and their deadlines. Don't just note the problem; note the solution and who's responsible for implementing it.
- Methodology Updates: Whenever a forecast methodology is adjusted - even a minor tweak - document the rationale behind the change, the expected impact, and who approved it. This prevents future confusion and allows you to assess the effectiveness of changes.
- Data Source Changes: Document any changes to the data sources feeding your forecasts. Explain the reason for the change and any potential impact on accuracy.
- Exception Reporting Template: Maintain a standardized template for exception reporting that ensures consistent data collection and analysis across all products or categories.
- Process Flow Diagram: A visual representation of your forecast review process can be extremely helpful for onboarding new team members and ensuring everyone understands their roles and responsibilities.
Proper documentation isn't about creating unnecessary paperwork; it's about fostering accountability, facilitating knowledge sharing, and building a foundation for continuous improvement in your MRP forecasting process.
Conclusion: Achieving MRP Forecasting Excellence
Ultimately, achieving MRP forecasting excellence isn't a one-time project - it's an ongoing journey. This checklist serves as a powerful roadmap, but its true value lies in consistent application and adaptation. Regularly revisiting each point, and incorporating learnings from your root cause analyses, will drive continuous improvement in your forecast accuracy. Remember, a small, consistent effort across these areas leads to significant gains in inventory optimization, reduced stockouts, and a more responsive supply chain. Embrace the checklist as a living document, refining it as your business evolves and your understanding of demand deepens. Your commitment to this process will translate directly into a more efficient and profitable operation.
Resources & Links
- Oracle: Oracle offers MRP and forecasting solutions, and their site provides information on best practices and tools.
- SAP: Similar to Oracle, SAP provides comprehensive ERP systems including MRP and forecasting modules. Their website offers resources and case studies.
- Microsoft Dynamics 365 Supply Chain Management: Provides cloud-based supply chain management solutions, including forecasting and demand planning capabilities.
- Demand Planning Software (Various Vendors): A resource directory and information portal focused on demand planning and forecasting software. Can help compare different vendors.
- Gartner: Gartner provides research and analysis on various technologies, including supply chain management and forecasting. Their reports can offer insights into industry trends.
- APICS (now ASCM): ASCM (Association for Supply Chain Management) provides training, certifications, and resources related to supply chain management, including forecasting.
- Investopedia - MRP Definition: Provides a clear and concise definition of MRP (Material Requirements Planning) for those new to the concept.
- University of Pittsburgh Statistics Department: While not directly MRP focused, understanding statistical methods is crucial for accurate forecasting. Pitt's Stat department offers resources and information.
- Tableau: Data visualization tool useful for presenting and analyzing forecast data and identifying trends. Many MRP systems integrate with Tableau.
- Microsoft Power BI: Another powerful data visualization tool similar to Tableau, helping to monitor and improve forecast accuracy through visual dashboards.
- Smartsheet: A work management platform that could be used to create and manage the MRP Forecast Accuracy Review Checklist itself, and track progress.
Frequently Asked Questions
What is MRP and why is forecast accuracy important for it?
MRP (Material Requirements Planning) is a system used to manage and plan production processes. Accurate forecasts are crucial for MRP because they drive material orders and production schedules. Inaccurate forecasts lead to either shortages (lost sales, production delays) or excess inventory (increased costs, obsolescence).
What is the purpose of this MRP Review Checklist Template?
The template provides a structured approach to regularly review and improve your forecast accuracy within your MRP system. It helps identify areas of weakness, track progress, and ensure forecasts are aligned with business needs.
Who should use this checklist template?
This checklist is beneficial for anyone involved in MRP planning, including production planners, supply chain managers, demand planners, and anyone responsible for inventory management.
How often should I use this MRP Review Checklist Template?
We recommend conducting this review at least monthly, but the frequency should be adjusted based on the volatility of your demand and the criticality of your materials. Some materials might require weekly or even daily reviews.
What are the key sections covered in the checklist template?
The template covers several key areas, including forecast bias analysis, error measurement, review of influencing factors (marketing promotions, seasonality), process reviews, and action item tracking.
What does 'forecast bias' mean and why is it important to check?
Forecast bias refers to a systematic over- or under-estimation of demand. Identifying and correcting bias ensures your forecasts are more consistently accurate. The checklist helps you analyze bias using metrics like Mean Absolute Bias (MAB).
What are common error measurement metrics mentioned in the checklist?
The checklist focuses on metrics like Mean Absolute Deviation (MAD), Mean Squared Error (MSE), and Mean Absolute Percentage Error (MAPE). These metrics quantify the difference between forecasted and actual demand, allowing you to track accuracy trends.
The checklist mentions 'Influencing Factors'. Can you give me some examples?
Examples include promotional campaigns, seasonality (holiday shopping, specific weather conditions), economic indicators, competitor actions, and changes in customer behavior.
What kind of 'Process Reviews' are included in the checklist?
These reviews involve evaluating the data sources used for forecasting, the forecasting methods employed, the collaboration between different departments (sales, marketing, operations), and the overall forecasting process to identify areas for improvement.
How do I use the 'Action Item Tracking' section of the template?
This section is designed to document any identified issues or opportunities for improvement. It includes fields for assigning responsibility, setting deadlines, and tracking the status of each action item. This ensures accountability and follow-through.
Can I customize the checklist template?
Yes, absolutely. The template is designed to be flexible. Feel free to add or remove sections, adjust the metrics, and tailor the questions to align with your specific business needs and MRP system.
Where can I find more information about the forecasting methods mentioned in the checklist?
The checklist provides brief descriptions of common forecasting methods. For more in-depth information, we recommend researching specific techniques like moving averages, exponential smoothing, and regression analysis.
Found this Article helpful?
Related Articles
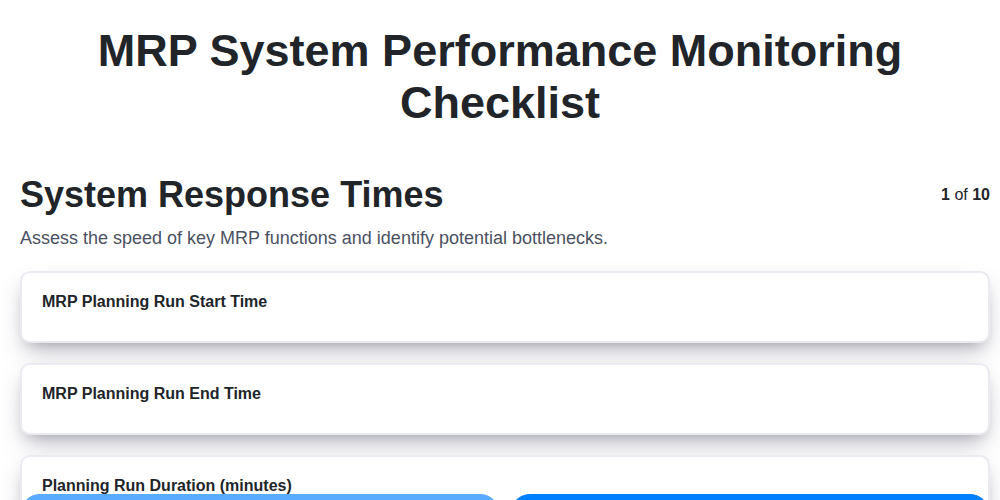
MRP System Performance Monitoring Checklist: Ensure Peak Efficiency
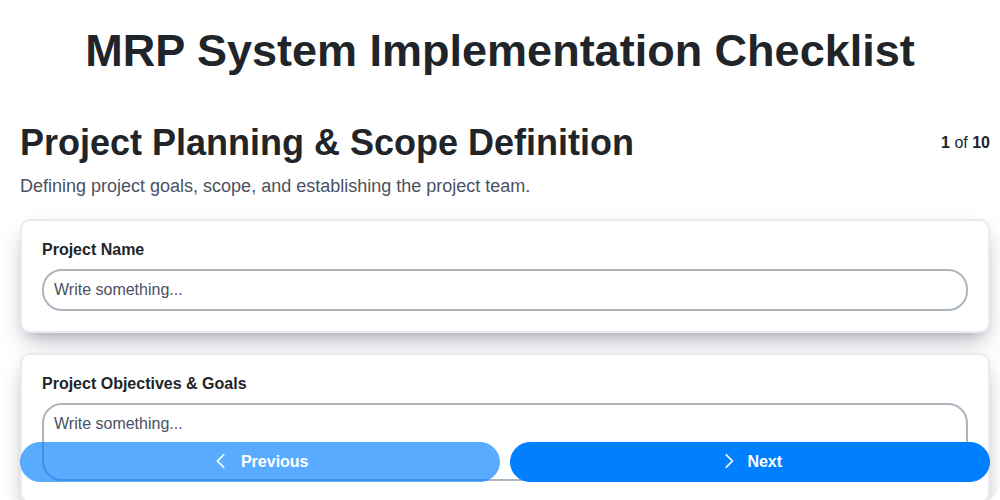
MRP System Implementation Checklist: Your Step-by-Step Guide

Top 10 MRPeasy Alternatives for 2025

The 5 Best Bill of Materials (BOM) Management Software of 2025
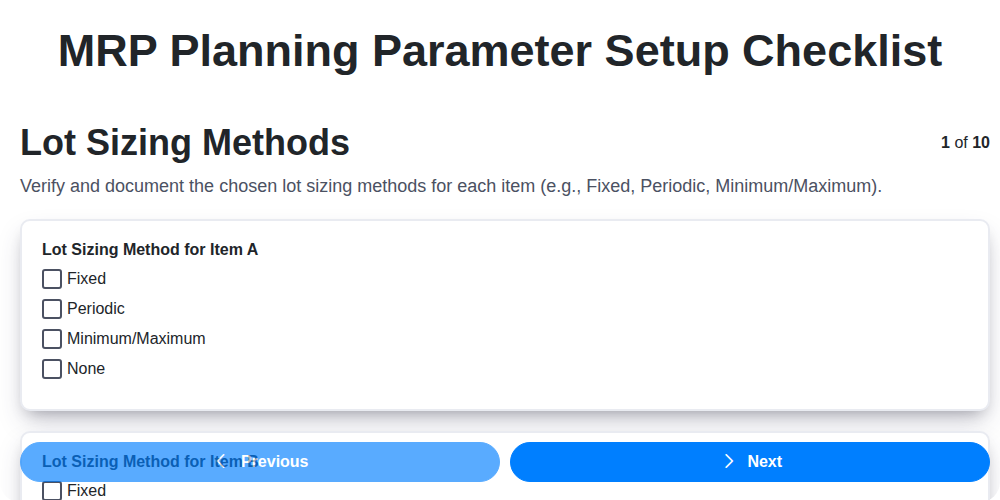
MRP Planning Parameter Setup Checklist: Your Guide to Accuracy & Efficiency
The 10 Best Manufacturing Management Software of 2025
How to improve your Bill of Materials (BOM) Management
MRP User Training Checklist: Ensuring Proficiency & Success
We can do it Together
Need help with
Material Requirements Planning (MRP)?
Have a question? We're here to help. Please submit your inquiry, and we'll respond promptly.