Mastering Data Accuracy: The Ultimate Management Reporting & KPI Dashboard Verification Checklist 2026
Published: 10/28/2026 Updated: 10/29/2026
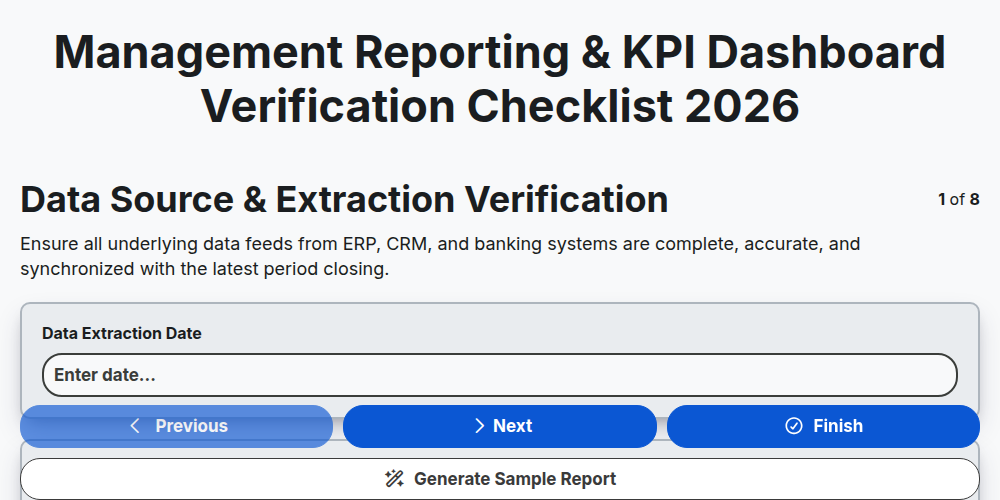
Table of Contents
- Introduction: Why Precision Matters in 2026 Reporting
- Phase 1: Data Source & Extraction Verification
- Phase 2: Ensuring Data Integrity & Reconciliation
- Phase 3: KPI Calculation & Logic Audit
- Phase 4: Period-over-Period (PoP) Variance Analysis
- Phase 5: Visual Accuracy & Formatting Review
- Phase 6: Access Control & Data Security Protocols
- Phase 7: Management Commentary & Narrative Alignment
- Phase 8: Final Distribution & Archiving Procedures
- Conclusion: Building a Culture of Continuous Verification
- Resources & Links
TLDR: Ensure your 2026 executive dashboards remain a single source of truth with this comprehensive verification checklist. Learn how to audit data integrity, validate complex KPI logic, perform variance analysis, and secure access controls to prevent costly decision-making errors and maintain stakeholder trust.
Introduction: Why Precision Matters in 2026 Reporting
The High Stakes of Real-Time Decision Making
In the rapidly evolving business landscape of 2026, the margin for error in corporate reporting has effectively vanished. As organizations move toward hyper-automated environments and real-time data streaming, the speed of decision-making has increased, but so has the potential for-cascading errors. When your leadership team relies on a dashboard to pivot strategy, a single discrepancy in a KPI isn't just a typo-it's a systemic risk that can lead to misallocated capital, missed market opportunities, and eroded stakeholder trust.
Beyond the Visuals: The Era of Data Veracity
Gone are the days when looking correct was sufficient. In 2026, a dashboard that is visually stunning but architecturally unsound is a liability. With the integration of AI-driven insights and predictive analytics into most management cockpits, the underlying data must be beyond reproach. If the foundation-the extraction, logic, and reconciliation-is flawed, the advanced predictive models built upon it will yield hallucinated or misleading forecasts.
The Cost of Garbage In, Garbage Out
The complexity of modern data ecosystems-incorporating fragmented SaaS inputs, IoT streams, and unstructured external market data-means that manual oversight is no longer enough. We are seeing more frequent data drift, where subtle changes in source systems break long-standing logic unnoticed.
This checklist is designed to serve as your final line of defense. It is not merely a technical audit; it is a strategic safeguard. By implementing this rigorous verification framework, you ensure that your management reporting moves beyond simple observation and becomes a reliable engine for high-stakes, data-driven leadership.
Phase 1: Data Source & Extraction Verification
Ensuring a Single Version of the Truth
The foundation of any reliable dashboard is the integrity of the raw data feeding it. Before you even look at a chart or a trendline, you must verify the plumbing of your reporting ecosystem. If the extraction process is flawed, every subsequent calculation and visualization will be inherently misleading, no matter how polished the final design looks.
In 2026, with the increasing use of automated pipelines and real-time API integrations, the complexity of data extraction has grown. This phase is about ensuring that the data arriving in your dashboard is complete, timely, and correctly mapped.
Critical Audit Steps
Source-to-Dashboard Mapping Audit Confirm that every data field in your dashboard maps correctly to its corresponding column in the source system (ERP, CRM, or SQL database). A common pitfall is schema drift, where a change in the source system's structure breaks the downstream dashboard connection.
Extraction Completeness Check Verify that no data packets were dropped during the ETL (Extract, Transform, Load) process. Ensure that the total record count in your dashboard matches the total record count in the source system for the selected timeframe.
Refresh Latency & Timestamp Validation Is the data actually real-time, or is it lagging? Check the Last Refreshed timestamp. For 2026 reporting standards, ensure that the data latency aligns with the business requirements (e.g., intraday vs. T+1).
Filter & Parameter Verification Review the logic applied during extraction. Are there hidden filters in the data pipeline (e.g., excluding certain regions or specific product categories) that are not explicitly documented? Ensure the extraction logic mirrors the intended business scope.
Connectivity & API Health Check For dashboards relying on third-party APIs, verify that authentication tokens are valid and that there are no intermittent connection errors that could lead to partial data loading.
Phase 2: Ensuring Data Integrity & Reconciliation
The Foundation of Truth: Validating the Data Pipeline
Once you have confirmed that your data sources are connected and extracting correctly, you enter the most critical stage of the verification process. Even the most beautiful dashboard is a liability if it is built on a foundation of flawed data. In 2026, as automated pipelines and AI-driven ETL (Extract, Transform, Load) processes become the standard, the risk of silent errors-where data flows perfectly but contains inaccuracies-is higher than ever.
Reconciling the Single Source of Truth
The goal of this phase is to ensure that the numbers appearing in your dashboard align perfectly with your official financial records and system-of-record databases.
- System-to-Dashboard Cross-Checks: Perform manual spot checks by taking a subset of data (e.g., a specific region or product line) from your primary ERP or CRM and comparing it directly to the values rendered in the dashboard.
- Granularity Audit: Ensure that when data is aggregated for high-level views, the underlying components still sum up to the correct totals. A common error occurs when filters are applied inconsistently across different dashboard layers.
- Completeness Testing: Verify that no records were dropped during the extraction or transformation process. Are all transactions from the final day of the period accounted for, or is there a data lag impacting your current view?
Identifying and Mitating Data Anomalies
Data integrity isn't just about matching totals; it is about the health of the data points themselves.
- Outlier & Null Value Detection: Scan your datasets for unexpected null values or extreme outliers that could skew averages and trends. In an automated environment, a single corrupted field can ripple through your entire KPI suite.
- Duplicate Entry Scrubbing: Ensure that your transformation logic is effectively identifying and removing duplicate entries that often occur during multi-source merges.
- Schema Consistency: Confirm that updates to the source system (such as a new field added in your CRM) haven't broken the mapping logic, leading to misaligned or missing data attributes.
By the end of this phase, you should have moved beyond simply knowing the data is there to being certain that the data is correct. This level of rigor transforms a dashboard from a mere visualization tool into a reliable instrument for strategic decision-making.
Phase 3: KPI Calculation & Logic Audit
Validating the Engine: KPI Calculation & Logic Audit
Once you have confirmed that the raw data is intact and reconciled, the next critical step is to audit the math behind your metrics. A dashboard can look beautiful and display perfectly aligned numbers, but if the underlying logic is flawed, you are simply visualizing incorrect information with high precision.
In the 2026 reporting landscape, where automated scripts and AI-driven aggregations are common, a manual black box approach is no longer acceptable. You must audit the formulas to ensure they align with your organization's evolving definitions of success.
1. Formula Integrity & Definition Alignment
The most common cause of reporting errors is metric drift-where the formula used in the dashboard no longer matches the official business definition.
- Verify Formula Accuracy: Manually recalculate a sample of key metrics (e.g., Gross Margin %, CAC, or Churn Rate) using raw data to see if they match the dashboard output.
- Check for Hard-Coded Values: Ensure no static numbers have been manually entered into the logic, which can bypass data updates and lead to stale reporting.
- Standardize Aggregations: Confirm that averages, sums, and weighted averages are being applied correctly across different dimensions (e.g., ensuring a Year-to-Date average isn't accidentally calculated as a simple sum).
2. Edge Case & Boundary Testing
Logic that works for a standard month of data often breaks during anomalies. Your audit must include testing for stress points in the calculation logic.
- Null and Zero Values: Test how your KPIs react when a data point is missing or zero. Does a $0 revenue entry cause a Division by Zero error that breaks the entire visualization?
- Handling Outliers: Determine if your logic includes filters to prevent extreme outliers from skewing the perception of normalized performance.
- Seasonality & Leap Year Adjustments: For time-based KPIs, ensure that logic accounts for varying month lengths and the complexities of leap years to prevent artificial variances.
3. Consistency Across Dimensions
A dashboard is only reliable if the logic is applied uniformly across all slices of the business.
- Cross-Dimensional Consistency: If you are viewing Revenue by Region, ensure the calculation logic is identical to Revenue by Product Category.
- Unit Uniformity: Verify that all metrics are using consistent units (e.g., ensuring one chart isn't displaying in thousands while another displays in millions).
Phase 4: Period-over-Period (PoP) Variance Analysis
Decoding the Why Behind the Numbers
A dashboard that shows a 10% drop in revenue is only half-useful; the true value lies in the ability to immediately identify the cause. The Period-over-Period (PoP) variance analysis phase is where you transition from simple reporting to actionable business intelligence. In 2026, with the increasing velocity of data, this step ensures that your dashboards don't just report shifts, but provide the context necessary for decision-making.
Critical Verification Steps
To ensure your variance analysis is robust and reliable, perform the following checks:
- Consistency of Comparison Baselines: Verify that the Current Period and Prior Period use identical parameters. A common error is comparing a 30-day window in June to a 31-day window in May without normalizing the data.
- Seasonal Adjustment Validation: Ensure that your analysis accounts for seasonality. If a spike in sales is expected every Q4, the dashboard should ideally highlight whether the growth is relative to the previous month (MoM) or the same period last year (YoY) to avoid misleading conclusions.
- Threshold & Alert Accuracy: Check that your Red/Green indicators (conditional formatting) are triggering correctly based on predefined variance thresholds. If a 5% deviation is the alert limit, ensure the dashboard accurately flags 5.1% but remains neutral at 4.9%.
- Outlier Identification: Scrutinize large, unexplained swings. Part of this verification process involves confirming that extreme variances are driven by genuine business shifts rather than data entry errors or one-time technical glitches in the ETL (Extract, Transform, Load) pipeline.
The Goal: From Observation to Insight
The objective of this phase is to ensure that the Delta (the change) is mathematically sound and contextually relevant. When this step is executed correctly, your leadership team won't spend the first ten minutes of a meeting questioning the validity of the fluctuations; instead, they can move immediately into strategic discussions about how to address the trends identified.
Phase 5: Visual Accuracy & Formatting Review
Ensuring Clarity Through Visual Integrity
Even the most accurate data loses its value if it is presented in a way that is confusing, misleading, or visually overwhelming. As we move into 2026, where data density in executive dashboards is increasing, the Visual Accuracy & Formatting Review phase is critical to ensure that your insights are immediately actionable and that no visual lies are being told by your charts.
1. Chart Type Appropriateness
Verify that the chosen visualization matches the data's intent.
- Trends over time: Ensure line charts are used instead of bar charts for continuous time-series data.
- Composition: Check that pie or donut charts are only used for simple parts-of-a-whole and do not contain too many slices.
- Comparisons: Ensure bar charts are used for categorical comparisons to allow for easy scanning of magnitude.
2. Scale and Axis Integrity
One of the most common ways to inadvertently mislead stakeholders is through improper scaling.
- Zero-Baseline Check: Ensure Y-axes for bar charts start at zero to prevent exaggerating small differences.
- Consistent Scaling: When comparing two charts side-by-side (e.g., Revenue vs. Target), ensure the scales are consistent so the visual magnitude is comparable.
- Axis Labeling: Confirm that all axes are clearly labeled with the correct units (e.g., USD, %, or Thousands).
3. Color Theory and Semantic Consistency
In 2026, dashboarding is as much about cognitive load management as it is about design.
- Semantic Color Coding: Ensure color usage is intuitive. Green should consistently represent Good/Target Met, and Red should represent Critical/At Risk.
- Avoid Color Overload: Audit the dashboard for rainbow effects. Too many colors distract from the primary KPI.
- Accessibility (Color Blindness): Verify that the color palette is accessible to users with color vision deficiencies (using high-contrast or pattern-based distinctions).
4. Legend and Annotation Audit
Data without context is just noise.
- Legend Proximity: Ensure legends are placed near the relevant data points to reduce eye strain.
- Callouts for Anomalies: Check that significant spikes or dips in the data are accompanied by text annotations explaining why the variance occurred.
- Unit Clarity: Verify that every metric clearly states whether it is a raw value, a percentage, or a ratio.
Phase 6: Access Control & Data Security Protocols
Securing the Single Source of Truth
In the 2026 data landscape, a dashboard is only as valuable as it is secure. As management reports often contain highly sensitive information-including real-time margins, payroll data, and strategic growth projections-the verification process must extend beyond mathematical accuracy to encompass rigorous security protocols.
User Permissions & Role-Based Access Control (RBAC)
Verification must ensure that the principle of least privilege is strictly enforced. Before any report is cleared for distribution, perform the following audits:
- Granular Access Audit: Verify that users can only access the specific organizational units (e.g., region, department, or product line) relevant to their role.
- Sensitivity Labeling Check: Ensure that dashboards containing PII (Personally Identary Information) or highly confidential financial data are flagged and restricted to authorized executive tiers.
- Permission Drift Detection: Confirm that recent personnel changes (promotions, departures, or transfers) have been reflected in the dashboard's access list to prevent permission creep.
Data Encryption & Transmission Integrity
As data flows from extraction to visualization, it remains vulnerable to interception or unauthorized manipulation.
- Encryption Verification: Confirm that data is encrypted both at rest (within the data warehouse) and in transit (via TLS/SSL protocols) during the dashboard refresh cycle.
- API & Connection Security: Audit the authentication methods used for data connectors. Ensure that service accounts used for automated extraction are using secure, rotating credentials rather than static passwords.
Audit Trails & Compliance Readiness
A robust verification checklist must include a review of the digital footprint left by the reporting process.
- Change Log Validation: Verify that every modification to the underlying dataset or the dashboard logic is captured in an immutable audit log.
- Compliance Alignment: Ensure the dashboard architecture adheres to 2026 regulatory standards (such as updated GDPR, CCPA, or industry-specific frameworks), particularly regarding data residency and sovereignty.
The Zero-Trust Verification Mindset
In the modern enterprise, we no longer assume a user is safe just because they are inside the corporate network. Your final verification step in this phase is to simulate an unauthorized access attempt to ensure that the dashboard's security layers-including Multi-Factor Authentication (MFA) prompts-trigger correctly and prevent unauthorized visibility.
Phase 7: Management Commentary & Narrative Alignment
Bridging the Gap Between Numbers and Insights
A dashboard, no matter how visually stunning or technically accurate, is merely a collection of data points without the context of a narrative. In the 2026 data landscape-where automated insights are becoming the norm-the true value of a management report lies in the why behind the what.
The goal of this phase is to ensure that the numbers displayed in your KPIs are perfectly synchronized with the qualitative analysis provided by leadership.
Ensuring Narrative Consistency
The most common pitfall in management reporting is a narrative-data disconnect, where the commentary describes a period of growth while the dashboard shows a decline in key metrics. During this verification step, you must perform a side-by-side audit to confirm:
- Fact-Checking the Narrative: Every claim made in the executive summary (e.g., Revenue increased by 12% due to market expansion) must be directly traceable to a specific metric in the dashboard.
- Contextualizing Variances: Ensure that the commentary addresses the drivers identified during your Period-over-Period (PoP) analysis. If the dashboard shows a dip in margin, the narrative must explain the underlying cause, such as rising COGS or supply chain disruptions.
- Tone and Clarity: The language used in the commentary should be objective, professional, and actionable. Avoid ambiguity; instead of saying performance was somewhat low, use performance fell 4% below target due to [X].
Integrating AI-Generated Insights
As we move into 2026, many organizations are using Generative AI to draft initial commentary. While this increases efficiency, it introduces new risks. Your checklist must include a verification step to ensure that AI-generated summaries have not hallucinated trends or misinterpreted complex data correlations.
Actionable Takeaways
The final step of this phase is to ensure the report does not just report on the past, but points toward the future. A high-quality management report should use the verified data to support:
- Identifying Trends: Moving from reactive reporting to proactive forecasting.
- Risk Mitigation: Highlighting anomalies that require immediate leadership intervention.
- Strategic Decision Support: Providing the empirical evidence needed to pivot strategies or allocate resources.
By verifying that your commentary and your dashboards are in perfect alignment, you transform your reporting from a simple monitoring tool into a powerful engine for strategic execution.
Phase 8: Final Distribution & Archiving Procedures
Ensuring Continuity and Compliance
The final stage of the verification process is often the most overlooked, yet it is critical for long-term governance and auditability. Once your dashboard has been validated for accuracy and visual integrity, you must ensure that the delivery mechanism is seamless and that the data lifecycle is properly documented.
Automated Distribution Workflow
The goal for 2026 is zero-manual-intervention distribution. Before finalizing the reporting cycle, verify the following:
- Recipient List Audit: Confirm that the distribution list is up-to-date. Ensure that new stakeholders have been added and that departed executives have been removed to prevent unauthorized data exposure.
- Format Compatibility Check: Ensure the dashboard is optimized for the intended delivery medium (e.g., interactive web link, mobile-responsive view, or automated PDF export for email).
- Trigger Reliability: If using automated scheduling, perform a test run to ensure the report triggers at the correct timestamp and time zone relative to your global offices.
The Audit Trail & Archiving Protocol
Data accuracy today is meaningless if you cannot prove it was accurate yesterday. Proper archiving is a cornerstone of regulatory compliance and historical trend analysis.
- Snapshot Versioning: Never overwrite your primary historical datasets. Create a frozen snapshot of the data used for the specific reporting period. This allows you to re-run reports months later to investigate discrepancies.
- Metadata Documentation: Archive a brief log containing the Date of Extraction, Data Version, and List of Changes. This provides essential context for future audits.
- Centralized Repository Management: Ensure all finalized reports and their underlying source extracts are stored in a secure, centralized, and encrypted environment. This prevents version sprawl, where different departments begin making decisions based on outdated or shadow versions of the dashboard.
Conclusion: Building a Culture of Continuous Verification
Beyond the Checklist: Cultivating Long-Term Data Trust
A checklist is more than just a final hurdle before hitting the send button; it is a fundamental component of a robust data governance strategy. In the rapidly evolving landscape of 2026, where automated pipelines and AI-driven insights are becoming the standard, the margin for error has shrunk. A single discrepancy in a KPI dashboard can undermine the credibility of an entire finance or operations department, leading to misinformed strategic pivots and lost revenue opportunities.
Moving from Reactive to Proactive Verification
To truly master your management reporting, you must transition from viewing verification as a pre-flight check to treating it as a continuous cycle of improvement. The goal is not merely to catch errors before they reach the boardroom, but to build a data ecosystem where accuracy is baked into the architecture.
- Automate the Routine, Audit the Complex: Use automation to handle repetitive reconciliation tasks, allowing your analysts to focus their intellectual energy on high-level logic audits and narrative alignment.
- Feedback Loops are Essential: When a discrepancy is found during the verification process, don't just fix the number-fix the process. Perform a root-cause analysis to determine if the error originated in the extraction layer, a broken logic formula, or a manual entry slip.
- Empower Data Ownership: Encourage a culture where every stakeholder-from data engineers to department heads-understands their role in the data lineage.
The Bottom Line
In an era of big data and real-time decision-making, the most valuable asset an organization possesses is not just information, but trustworthy information. By rigorously applying this verification checklist, you ensure that your dashboards serve as a single source of truth, providing the leadership team with the confidence needed to navigate the complexities of the 2026 business environment.
Rigorous verification turns raw data into strategic intelligence. Start implementing these steps today to safeguard your organization's decision-making integrity for tomorrow.
Resources & Links
- Tableau: Industry-leading data visualization platform for creating advanced KPI dashboards and real-time monitoring.
- Microsoft Power BI: Comprehensive business analytics service providing tools for data modeling, visualization, and report distribution.
- Gartner: Global research and advisory company providing insights into data governance and emerging reporting trends for 2026.
- Alteryx: Data automation and analytics platform useful for Phase 1 (Extraction) and Phase 2 (Data Integrity) automation.
- Snowflake: Cloud-based data warehousing service essential for maintaining a single source of truth in complex data ecosystems.
- dbt Labs: Tools for the 'transform' layer of data pipelines, critical for Phase 3 (KPI Calculation & Logic Audit).
- AuditBoard: Integrated audit and compliance software to help manage Phase 6 (Access Control) and risk management.
- Databricks: Unified analytics platform for processing large-scale data for deep-dive variance analysis.
- Google BigQuery: Serverless, highly scalable multicloud data warehouse for high-performance period-over-period analysis.
- Society for Corporate Governance: Resources for ensuring management commentary aligns with corporate governance and regulatory standards.
- ISO (International Organization for Standardization): Standards for data security and information management protocols (ISO/IEC 27001).
- Fivetran: Automated data movement service to ensure accuracy during the extraction and loading phases.
- Looker: A business intelligence and data applications platform that centralizes business logic for KPI consistency.
- NVIDIA (AI & Analytics): Exploring how AI-driven anomaly detection can assist in Phase 2 and Phase 4 of the verification checklist.
- Forbes Technology Council: Expert perspectives on the future of business intelligence and the importance of data-driven decision making.
- McKinsey & Company: Strategic insights on building organizational cultures focused on data integrity and continuous improvement.
Comments
There are no comments yet. Be the first to add one!
Accounting Management Solution Demo
Move beyond rigid, one-size-fits-all software. Leverage a fully programmable accounting environment designed to adapt to your unique workflows, complex hierarchies, and evolving business logic.
Related Articles
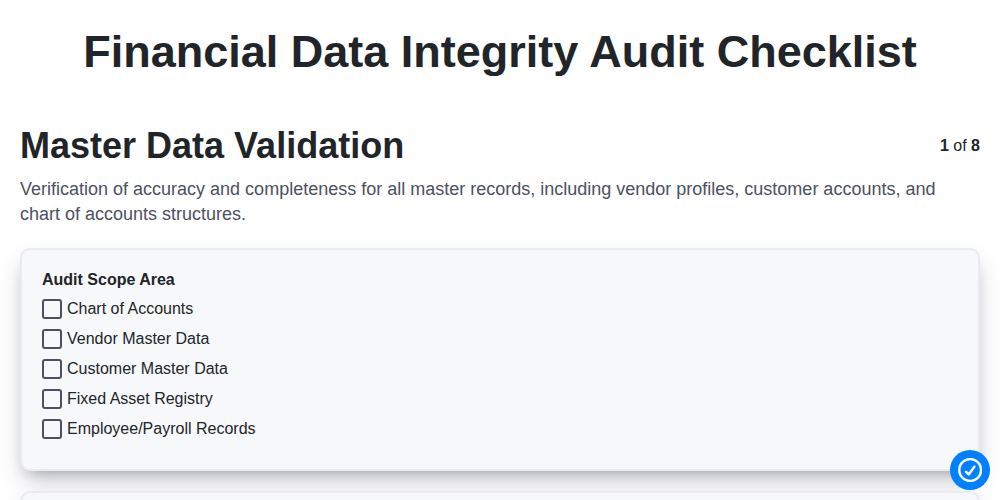
The Ultimate Financial Data Integrity Audit Checklist: A Step-by-Step Template for Precision and Compliance
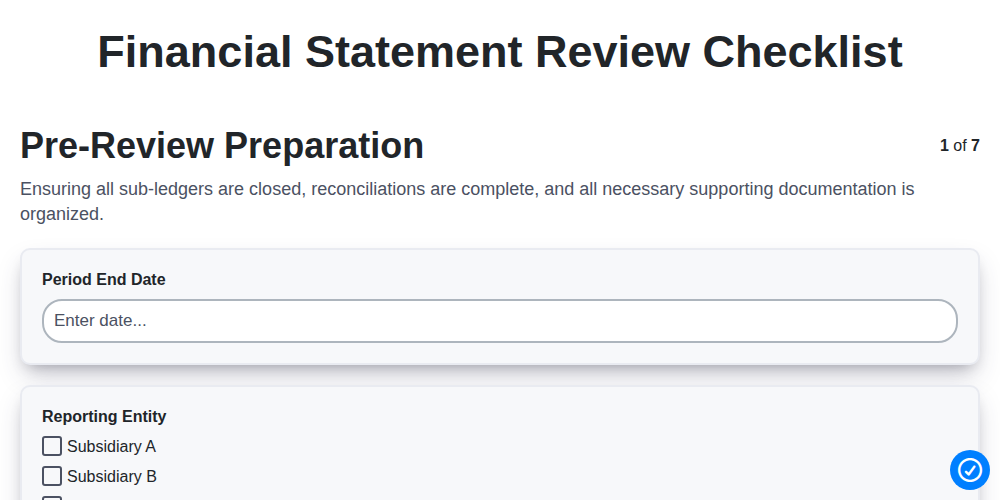
The Ultimate Financial Statement Review Checklist: A Step-by-Step Guide to Ensuring Accuracy and Compliance
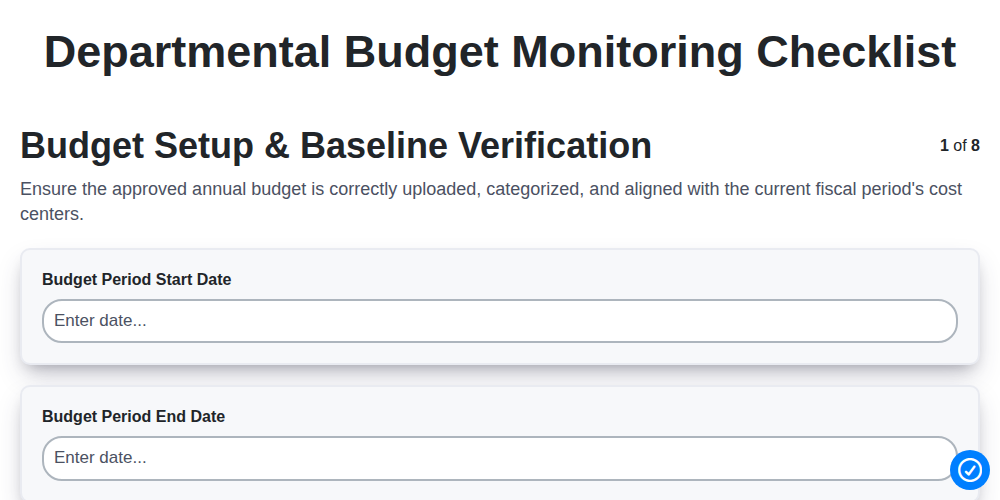
Mastering Financial Control: The Ultimate Departmental Budget Monitoring Checklist
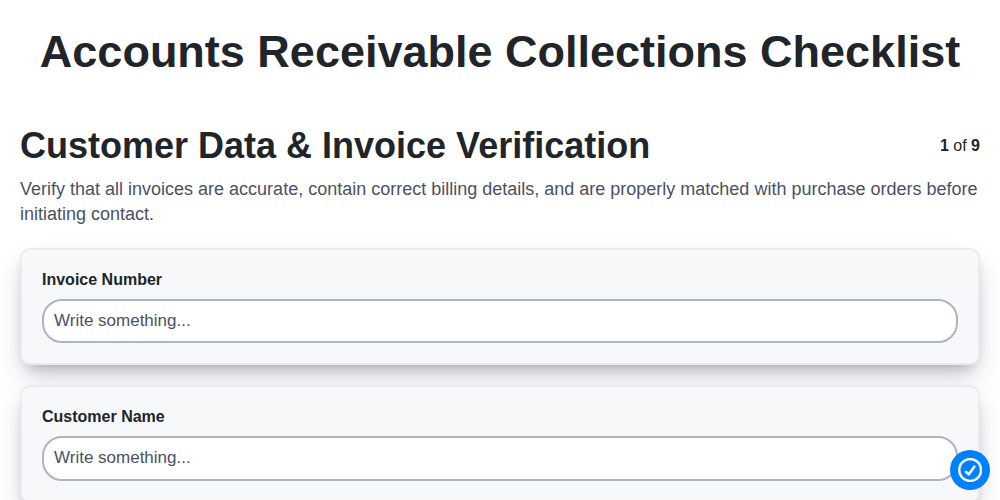
The Ultimate Accounts Receivable Collections Checklist: A Step-by-Step Guide to Streamlining Your Cash Flow
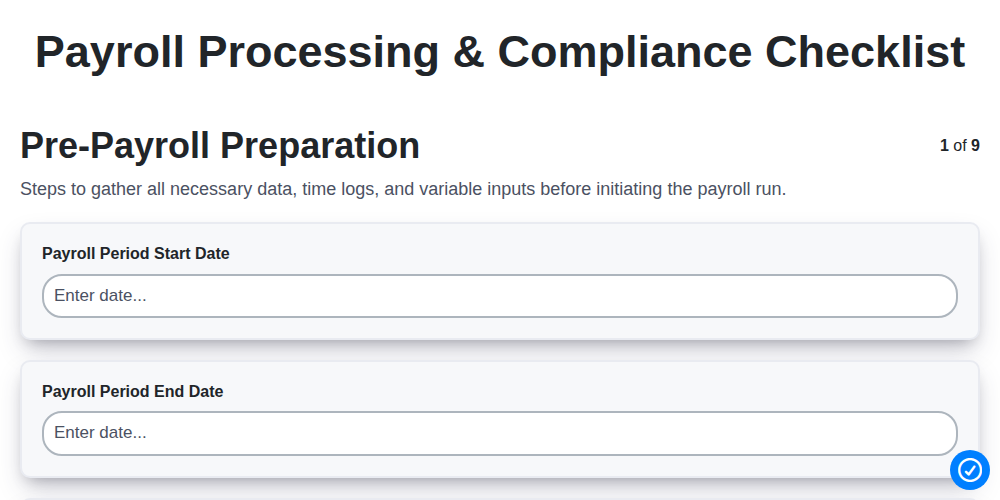
The Ultimate Payroll Processing & Compliance Checklist: A Step-by-Step Guide to Error-Free Payroll
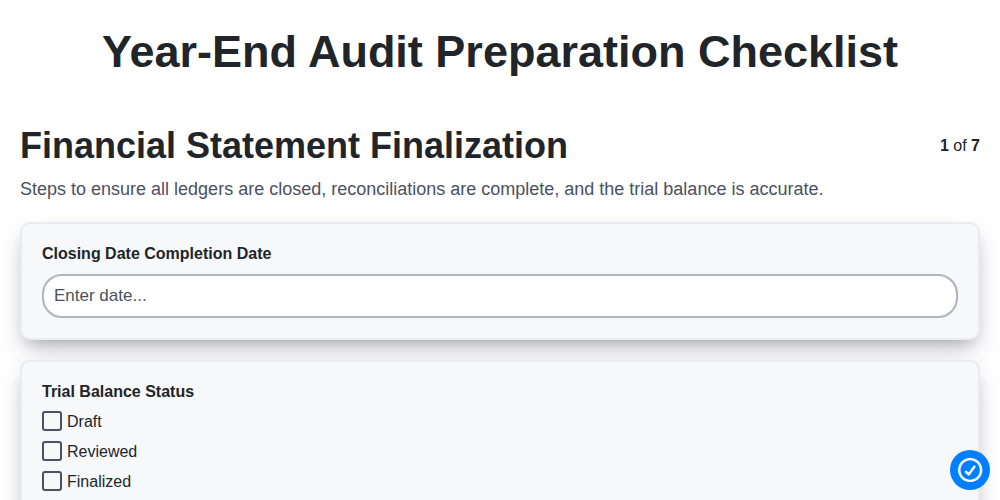
The Ultimate Year-End Audit Preparation Checklist: A Step-by-Step Guide to a Stress-Free Audit
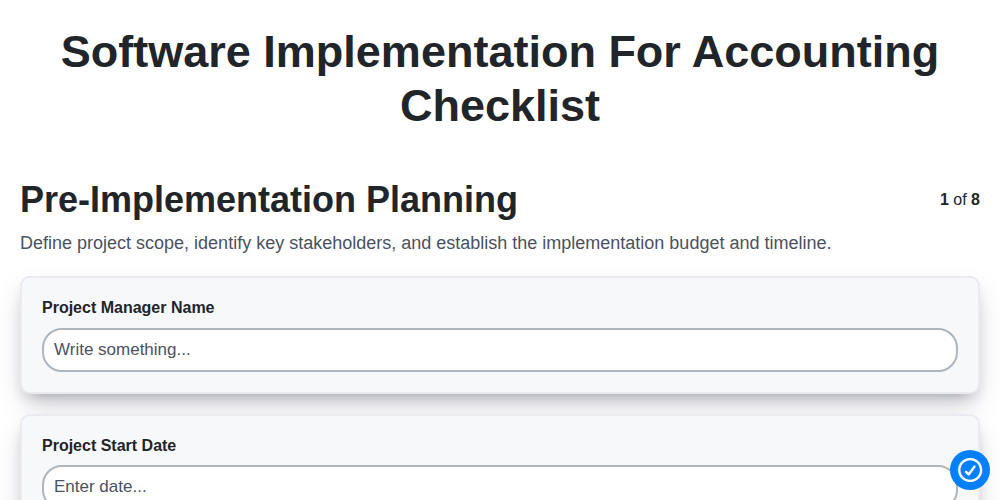
The Ultimate Software Implementation Checklist for Accounting Teams: A Step-by-Step Guide to a Seamless Transition
The Ultimate Inventory Valuation & Audit Checklist: A Step-by-Step Guide to Accuracy and Compliance
Need help with
Accounting Management?
Have a question? We're here to help. Please submit your inquiry, and we'll respond promptly.